Baker K.R. Optimization Modeling with Spreadsheets
Подождите немного. Документ загружается.


DEA produces a single, comprehensive measure of performance for each of the
DMUs. If the situation were simple, and there were just one input and one output,
then we would define performance as the ratio of output to input, and we would
likely refer to this ratio as “productivity” or “efficiency.” The best ratio among all
the DMUs would identify the most efficient DMU, and every other DMU would be
rated by comparing its ratio to the best one. As an example, suppose that we have
been hired as consultants to the White River Dairy Cooperative.
EXAMPLE 5.1
The White River Dairy Cooperative
Five dairy farms make up the White River Dairy Cooperative. The farms are similar in that they
all produce just one product—milk. Furthermore, the major resource for the farms is their cows.
Last month’s activity is summarized in the following table.
Cows Milk Productivity Efficiency
Farm 1 15 60 4.0 0.80
Farm 2 10 48 4.8 0.96
Farm 3 20 70 3.5 0.70
Farm 4 12 60 5.0 1.00
Farm 5 16 72 4.5 0.90
Using the data in this table, our task is to identify efficient and inefficient dairy farms. B
In this example, productivity is calculated as the ratio of milk produced to
cows owned, or output divided by input. The efficiency rating in the table is just
a normalized measure of the same thing. In other words, the value of 1.00 is assigned
to the maximum productivity in the set (for Farm 4), and the remaining values are
calculated as the ratio of each farm’s productivity to the maximum productivity
in the set.
Without access to detailed knowledge about the operation of each farm, we might
infer that Farm 4 has achieved its maximum efficiency rating because of factors such
as the following.
†
Investment in the latest milking equipment (Technology).
†
Adherence to a regular maintenance schedule (Procedures).
†
Incentives for worker quality and productivity (Management).
Something about these categories of factors is probably lacking at the other farms. For
instance, if Farm 1 could employ the same technology, procedures, and management
as Farm 4, then we would expect that with 15 cows, it should be able to achieve a milk
output of 75. (This target figure is the productivity of the best farm multiplied by the
number of cows at Farm 1. This output target can also be computed as the actual output
for Farm 1 divided by the efficiency of Farm 1.) Alternatively, we would expect that
the same milk output of 60 should be achievable with only 12 cows (obtained by
176
Chapter 5 Linear Programming: Data Envelopment Analysis
multiplying the input by the efficiency). In any event, the comparative analysis pro-
vides two kinds of information for Farm 1: First, its productivity could be as much
as 25 percent higher than it actually was, and second, it could probably learn a lot
by studying—and even imitating—the operation of Farm 4.
In more practical cases, a DMU is characterized by outputs and inputs.
Productivity is still a ratio, usually a weighted sum of the outputs divided by a
weighted sum of the inputs. When more than one output exists, we need to use weights
in order to value a combination of outputs and quantify them in a single number. The
same holds for inputs. When we can quantify the value of outputs and inputs in a
single number, then we can take their ratio and compute a productivity measure.
We can also normalize that value by comparing it to productivities of other DMUs
and scale the results so that the best value is 1. By relying on efficiency, DEA is
useful when no single output metric captures performance comprehensively and
when some measure of outputs relative to inputs seems appropriate. This makes
DEA a valuable tool for situations in which several dimensions of performance are
important.
DEA has often been applied in nonprofit industries, characterized by multiple out-
puts of interest and some ambiguity about the relative importance of those outputs. For
example, in comparing the performance of mental health clinics, it might be difficult to
place relative values on services for domestic abuse and drug addiction. DEA is well
suited to this type of situation because it does not require importance weights for the
various outputs (or inputs) to be established beforehand. Instead, as we shall see, it
determines the weights in the analysis and allows each DMU to be evaluated in its
best possible light.
Even in for-profit industries, a total profit figure may not be adequate for evaluat-
ing productivity. In the case of branch banks, which we use for the purposes of illus-
tration, suppose that profit is entirely determined by loan and deposit balances. In the
short run, fluctuations in the profit margins for loans or deposits may influence a
branch’s profits, but short-run profits may not indicate how productive the branch
has been at developing and managing loans and deposits. In addition, short-run profits
at a particular time may not indicate how well the branch will perform when the market
shifts and margins change. Therefore, a gross profit figure may not be the best measure
of branch productivity. Instead, DEA combines the loan and deposit balances into a
single output measure, considering every possible ratio of profit margins, and chooses
the margins that are most favorable to the branch being evaluated. Then, having chosen
a favorable set of loan and deposit margins for each branch, the DEA program rates the
efficiency of each branch on a scale of 0 to 1.
5.1. A GRAPHICAL PERSPECTIVE ON DEA
To illustrate the use of weighted averages in DEA, we move from the one-input, one-
output case of dairy farms to a simplified one-input, two-output case involving branch
banks. This time, we illustrate the analysis with a graphical approach.
5.1. A Graphical Perspective on DEA 177

EXAMPLE 5.2
Metropolis National Bank
Metropolis National Bank operates five branches around the city. The branches all offer the same
services and rely on identical mixes of labor and capital. As a result, the cost of operation is the
same at each branch, although their profiles of loans and deposits differ. The following table
summarizes the level of branch performance for the previous quarter.
DMU Expense Loans Deposits Efficiency
Branch 1 100 10 31 1.00
Branch 2 100 15 25 0.83
Branch 3 100 20 30 1.00
Branch 4 100 23 23 0.92
Branch 5 100 30 20 1.00
In the table, last quarter’s inputs are represented by total expenses (in thousands of dollars),
which happen to be identical for the branches. The table also provides the levels of activity
in loans and deposits, shown separately. Loan and deposit levels are expressed in millions of
dollars, averaged over the previous quarter. B
As shown in the table, Branches 1, 3, and 5 have the highest efficiency rating of 1;
therefore, they are classified as efficient. An efficiency rating of 1 means that we can
find a pair of weights on loans and deposits for which the branch would be the most
productive branch in the system. For instance, suppose the weights are 3 for loans and
33 for deposits. Then the weighted values of outputs for the branches are as follows.
DMU Loans Deposits Value
Branch 1 10 31 1053
Branch 2 15 25 870
Branch 3 20 30 1050
Branch 4 23 23 828
Branch 5 30 20 750
In this comparison, Branch 1 has the highest value. For the pair of weights (3, 33),
Branch 1 is the most productive DMU on the list. On the other hand, if the weights
were (12, 10), then Branch 5 would be the most productive. As long as we can find
at least one set of weights for which Branch 1 achieves the highest value, then
Branch 1 is classified as efficient. Later, we impose some restrictions on the weights
chosen.
For Branches 2 and 4, the story is different: No possible weights exist on loans and
deposits that would make these branches the most productive. For Branch 2, this is
easy to see, because it is “dominated” by Branch 3—that is, Branch 3 performs
better on both dimensions than Branch 2. Since the input expenses are the same, what-
ever weights we choose for loans and deposits, Branch 3 will show a higher total value
than Branch 2 and therefore greater productivity. The case of Branch 4, however, is
178
Chapter 5 Linear Programming: Data Envelopment Analysis
less clear. No other branch dominates Branch 4, yet it is still inefficient because no pair
of weights can give Branch 4 the highest output value.
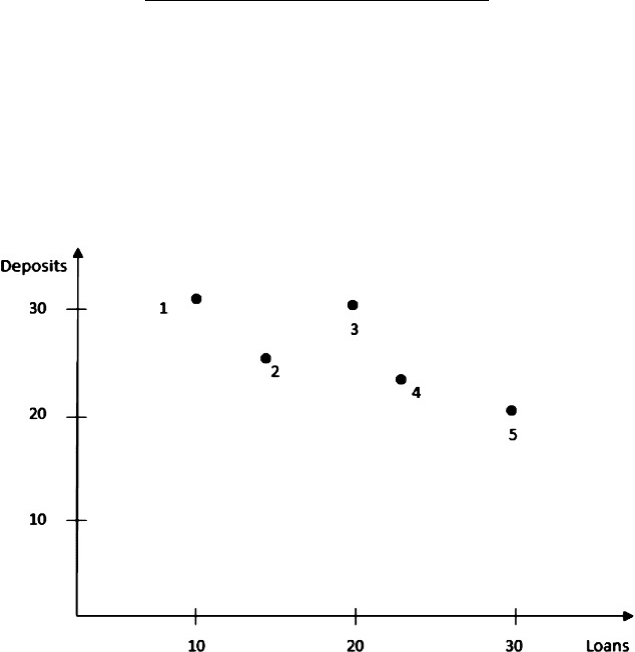
Figure 5.1 displays the output for each branch as a point on a two-dimensional
graph. Thus, Branch 1 corresponds to the point (10, 31) in the figure. The points
are labeled by branch number.
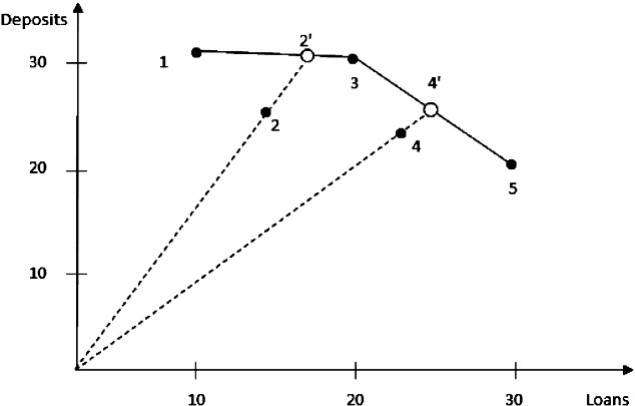
For any inefficient branch, such as Branch 4, the DEA procedure creates a
Hypothetical Comparison Unit (HCU) that is built from the features of efficient
units. These efficient DMUs are referred to as the reference set for the inefficient
branch. In the case of Branch 4, the reference set is made up of Branches 3 and 5,
and the comparison unit corresponds to the point (25, 25) in Figure 5.2. We can
form the comparison unit by adding 0.5 times the profile (inputs and outputs) of
Branch 3 and 0.5 times the profile of Branch 5
0:5 (Branch 3 Data) ¼ 0:5 (100 20 30)
0:5 (Branch 5 Data) ¼ 0:5 (100 30 20)
HCU Data ¼ (100 25 25)
Thus, we obtain a hypothetical branch with an input of 100 and with outputs of
25 (loans) and 25 (deposits). Graphically, the point (25, 25), labeled 4
0
, lies on the
straight line connecting points 3 and 5, as shown in Figure 5.2. Among all the
points on the line (i.e., all linear combinations of 3 and 5), 4
0
is the only one that
contains the same ratio of loans and deposits as that of Branch 4. Thus, we can
think of the comparison unit as producing the same product mix, but producing
Figure 5.1. Outputs for each of the branches in Example 5.2.
5.1. A Graphical Perspective on DEA 179
more of it than Branch 4. Consequently, the comparison unit dominates Branch 4, even
though there is no actual branch that does.
For Branch 2, the HCU corresponds to the point (18.1, 30.2), labeled 2
0
in
Figure 5.2. Although we noted that Branch 2 is dominated by Branch 3, this compari-
son unit does not correspond to point 3 because the output mix for Branch 3 is different
from the mix for Branch 2. The hypothetical point 2
0
, however, has a deposits-to-loans
ratio of 25:15, which matches the ratio for Branch 2, but with greater output.
Furthermore, the point 2
0
lies on the line connecting points 1 and 3, so that
Branches 1 and 3 form the reference set for Branch 2.
In the DEA approach, we presume that an inefficient branch can improve its per-
formance by emulating one or more of the efficient branches in its reference set. In the
case of Branch 2, that would mean emulating aspects of Branches 1 and 3, the com-
ponents of its HCU. In the case of Branch 4, that would mean emulating aspects of
Branches 3 and 5.
The efficiency measure also has a geometric interpretation in Figure 5.2. The dis-
tance from the origin to the point representing Branch 4 is 92 percent of the distance
from the origin to 4
0
. This percentage matches the efficiency of Branch 4. Similarly, the
point representing Branch 2 is located 82.8 percent of the way from the origin to 2
0
.
Under our definition of efficiency, Branch 1 is efficient although it has far less
loan activity than Branch 3 and only minimally larger deposits. Similarly, a branch
with $1 more in deposits than Branch 1 and no loans at all would also be efficient.
That is because we can conceive of a set of weights for loans and deposits that
would make such a branch the most productive of all the branches. In particular, if
Figure 5.2. Outputs for the HCUs in Example 5.2.
180 Chapter 5 Linear Programming: Data Envelopment Analysis
deposits were very profitable for the bank, and loans were not very profitable, then the
branch with $1 more in deposits would have a more valuable total output in terms of
profitability. Such a profitability relationship might be very unlikely, but it is still poss-
ible. Thus, when we use DEA, we deal with a theoretical notion of efficiency—based
on what is conceivable, not what is likely.
Spotting dominance in our example does not require DEA. We can simply scan
the data if we want to detect dominance. However, as the number of outputs and inputs
increases, a dominance relationship like the one between Branches 2 and 3 becomes
less likely. Consequently, direct comparisons do not reveal many inefficient DMUs,
and DEA becomes more valuable. Once we proceed beyond two outputs, geometric
analyses are difficult or impossible, and we lose the intuition that it provides. For
larger problems, we need an algebraic approach. In fact, even with two outputs, the
graphical approach is limited. Our branch bank example was simplified because iden-
tical inputs existed for all branches. If there were differences in the inputs, then the
graphical display of outputs would not convey the full comparison. In general,
DEA relies on an algebraic approach, and, as we shall see, on linear programming.
5.2. AN ALGEBRAIC PERSPECTIVE ON DEA
In order to describe a generic DEA model in algebraic terms, we let
x
ik
¼ ith input quantity for DMUðkÞ
y
jk
¼ jth output quantity for DMUðkÞ
The x- and y-values represent given information. In our branch bank example, for
Branch 1 (or k ¼ 1), we have
x
11
¼ 1st input quantity for Branch 1 ¼ 100
y
11
¼ 1st output quantity for Branch 1 ¼ 10
y
21
¼ 2nd output quantity for Branch 1 ¼ 31
Next, we define the weights, which play the role of decisions in the model
v
i
¼ weight for the ith input
u
j
¼ weight for the jth output
If there were one output and one input, as in the case of milk and cows, we could
measure productivity as y
k
/x
k
and then normalize this measure to compute efficiency.
We would have no need for weights at all. When there are two outputs, as in the
example of branch banks, we need weights to calculate an aggregate value for the
outputs. In the case of loans and deposits, there could well be actual profit margins,
reflecting market prices, that we could use for weights; but in other settings, there
may not be a market price for all of the relevant outputs. For that reason, we refer
5.2. An Algebraic Perspective on DEA 181
to weights rather than to prices as a means of valuing inputs and outputs. As we shall
see, the weights are obtained from the data, that is, they are determined intrinsically.
When there is more than one output, we use Y
k
to denote the weighted value of
outputs. That is, we let
Y
k
¼ u
1
y
1k
þ u
2
y
2k
þ u
3
y
3k
þ
Suppose that in the branch bank example, the weights selected are u
1
¼ 0.2 and u
2
¼
0.3. Then the output value for Branch 1 is 0.2(10) þ 0.3(31) ¼ 11.3. Similarly, we use
X
k
to denote the weighted value of the inputs, where
X
k
¼ v
1
x
1k
þ v
2
x
2k
þ v
3
x
3k
þ
Suppose that in the branch bank example, we take v
1
¼ 0.1. Then the input value for
Branch 1 is 0.1(100) ¼ 10. For an arbitrary set of nonnegative weights, we can com-
pute productivity as the ratio of the weighted value of outputs to the weighted value of
inputs. With the values of u
1
, u
2
, and v
1
just mentioned, the productivity measure for
Branch 1 would be 11.3/10 ¼ 1.13. With those weights, the best productivity among
the five branches is 1.30 for Branch 3. Therefore, the efficiency for Branch 1 would be
calculated as 1.13/1.3 ¼ 0.869. Later, we will constrain the weights so that they nor-
malize the measure of productivity. This means that the highest productivity measure
in the comparison is 1. With normalizing weights, we define efficiency as E
k
¼ Y
k
/X
k
,
where the capital letters are shorthand for weighted sums.
The performance of a particular DMU is considered efficient if the performance
of other DMUs does not provide evidence that one of its inputs or outputs could be
improved without worsening some of its other inputs or outputs. In other words, the
performance is efficient if it is impossible to construct a HCU that does better.
In our notation, the subscript k refers to the kth DMU. Our approach will be to
choose a particular DMU for evaluation and to denote it with the subscript k ¼ 0.
But this same DMU will still be included among the values of k . 0.
Now we can give an outline of the steps in DEA.
†
Select a particular DMU to be the focus of the analysis and refer to it as
DMU(0).
†
Choose (u
j
, v
i
) so that they maximize the ratio E
0
. In other words, choose the
weights that are most favorable to the mix of inputs and outputs belonging to
DMU(0), but use one set of weights for evaluating all DMUs.
†
Normalize the measure of productivity by requiring that Y
k
/X
k
1 for all
DMUs. In other words, the value of the output can never be greater than the
value of the input. Since DMU(0) corresponds to one of the DMU(k), the
largest value E
0
could achieve is 1.
†
If the ratio Y
0
/X
0
is equal to 1, then DMU(0) is classified as efficient; that is, we
have found a set of weights for which its outputs are at least as valuable as the
outputs of any other DMU would be with the same inputs.
182
Chapter 5 Linear Programming: Data Envelopment Analysis
†
If this ratio is less than 1, then DMU(0) is said to be inefficient; that is, for even
the most favorable choice of weights, there will be some other DMU, or
weighted combination of DMUs, that achieves higher productivity.
In the next section, we implement these steps using a spreadsheet model.
5.3. A SPREADSHEET MODEL FOR DEA
We can use a standard linear programming format to implement a spreadsheet model
for DEA. We begin by entering a table containing the data in the problem. Usually, this
table will have columns corresponding to inputs and outputs, and rows corresponding
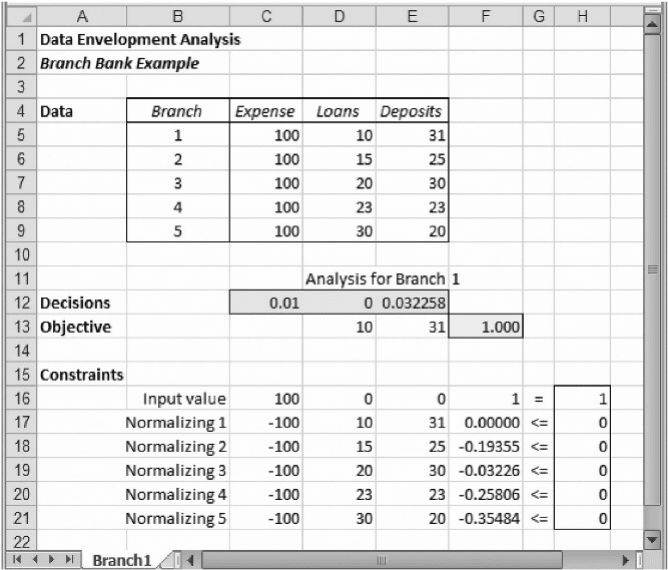
to DMUs. Figure 5.3 shows this layout for the branch bank example. The decision
variables are the weights for inputs and outputs. The decision variable cells appear
below the table containing the data, in the highlighted cells C12:E12.
First, we fix the weighted value of the inputs, arbitrarily, at X
0
¼ 1. In the spread-
sheet, this equation is enforced by requiring that cell F16 must equal H16. Moreover,
because of the form of X
0
, it is easily expressed as a SUMPRODUCT of input weights
Figure 5.3. Model for Branch 1 in Example 5.2.
5.3. A Spreadsheet Model for DEA 183
(v
i
) and input values (x
i0
). This equality constraint is just a scaling step; we could set
the input value equal to any number we like. Having fixed the weighted input value X
0
in the denominator of Y
0
/X
0
, it follows that maximizing the ratio E
0
amounts to max-
imizing Y
0
, the weighted value of the outputs. Now, Y
0
can be expressed as a
SUMPRODUCT of output weights (u
j
) and output values ( y
j0
). The value of Y
0
,
which plays the role of an objective function, is located in cell F13. Therefore, we
have a maximization problem in which the objective function is the weighted
output value and the weighted input value is constrained to equal 1.
Next, we adopt the convention that the efficiency of a DMU cannot exceed 1. This
convention reflects the sense that “perfect” efficiency is 100 percent, and we saw this
convention used earlier in Examples 5.1 and 5.2. This requirement is just a way of
ensuring that the value of the output can never be greater than the value of the
input. In symbols, we write Y
k
/X
k
1, for every k representing a DMU, or equiva-
lently, Y
k
– X
k
0. These normalizing conditions become the remaining constraints
of the model.
These steps lead to a relatively simple linear programming model. The form of the
model can be expressed as follows.
Maximize Y
0
subject to:
X
0
¼ 1 scaling of the input value (one constraint)
X
k
þ Y
k
0 efficiency no greater than 1, for each DMU(k)
Figure 5.3 shows the spreadsheet for the analysis, using the standard format for an
allocation model. The objective function in this model corresponds to the output value
of Branch 1, computed by a SUMPRODUCT formula in cell F13. The equation that
fixes the value of inputs appears in row 16, and the normalizing constraints (requiring
that output values never exceed input values) can be found in rows 17–21.
The model specification is as follows
Objective: F13 (maximize)
Variables: C12: E12
Constraints: F16 ¼ H16
F17:F24 H17:H21
When we run Solver, we obtain an objective function of 1.00, as shown in the figure,
along with the following weights,
Input Expense weight (v
1
) 0.01
Output Loans weight (u
1
) 0.00
Output Deposits weight (u
2
) 0.032258
With these weights, the input value is X
0
¼ 1.0 and the output value is Y
0
¼ 1.0 for
Branch 1, resulting in an efficiency of 100 percent. In the solution, cells F18:F21
184
Chapter 5 Linear Programming: Data Envelopment Analysis
all show negative values. This means that the output value is strictly less than the input
value for each of the other DMUs. Since the input values are identical in this example,
it follows that none of the other DMUs can achieve the productivity of Branch 1 at its
most favorable weights (0, 0.032258).
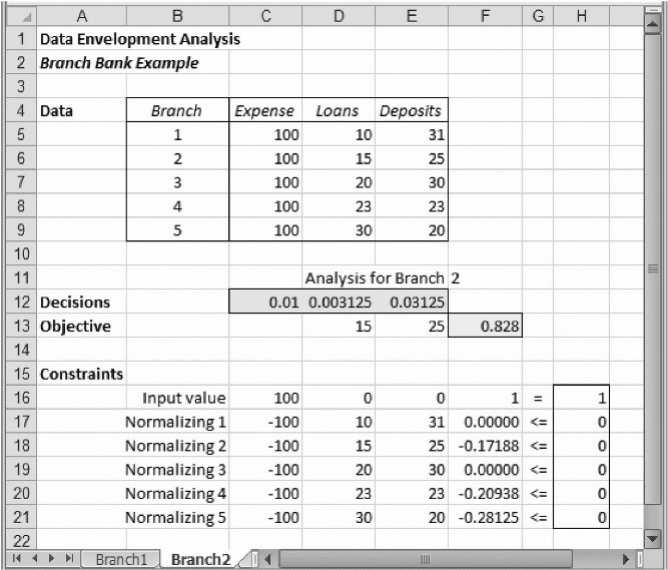
Figure 5.4 shows the analysis for Branch 2. The format is the same as the format
for Branch 1, and only two changes occur. First, the objective function now contains
data for Branch 2 in row 13. Second, the coefficients for the constraint on input value
contain data for Branch 2 in row 16. (In this example, that change does not actually
alter row 16, but in other examples, it could.) Otherwise, the parameters of the
linear program remain unchanged from the analysis for Branch 1. When we run
Solver on this model, we obtain an objective function of 0.828, as shown in the
figure, along with the following weights.
Input Expense weight (v
1
) 0.01
Output Loans weight (u
1
) 0.003125
Output Deposits weight (u
2
) 0.03125
With these weights, the input value is X
0
¼ 1.0, and the output value is Y
0
¼ 0.828,
resulting in an efficiency of 82.8 percent. In this solution, cells F17 and F19 are
Figure 5.4. Model for Branch 2 in Example 5.2.
5.3. A Spreadsheet Model for DEA 185