Battarbee R.W., Binney H.A. (Eds.) Natural Climate Variability and Global Warming: A Holocene Perspective
Подождите немного. Документ загружается.

..
170
|
Hugues Goosse et al.
..
associated with internal variability, the maximum temperatures occurred at differ-
ent locations at different times.
Even if perfect models and perfect forcing time-series were available, each model
experiment would simulate a possible evolution of the internal variability but not
necessarily the one followed in the real world. Very precise initial conditions would
only allow having an agreement between model and observations during a few
weeks at most, a classic problem in weather forecasting (Lorenz 1963). In complex
models (such as AOGCMs and some EMICs) that include a representation of the
internal variability, it is possible to compare the statistics of one simulation with
the observations or to try to extract the response to a forcing in the simulation and
in available reconstructions. A precise comparison between temperature changes
simulated in a model with a reconstruction in a particular region, for a particular
year (or decade), is usually useless because it is generally impossible to state if any
difference is due to uncertainties in the reconstruction, model, or forcing deficien-
cies, or simply to a different realization associated with the internal variability of
the system.
In this framework, ensembles of simulations are particularly useful. To per-
form such an ensemble, slightly different initial conditions are selected. After a
few simulated days, the internal variability evolves in a totally different way in
the various members. If the ensemble is large enough, a reasonable sampling of the
model variability could be obtained. In order to have an agreement between
model and a reconstruction, the reconstruction must correspond to a reasonable
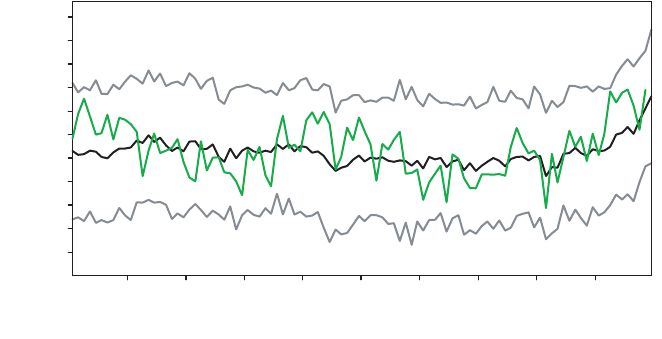
member of the ensemble (Figure 7.4). As the members of the ensemble provide
independent samples of the internal variability, averaging over all the members of
the ensemble tends to filter out the internal variability, leaving only the forced
response of the system. This provides a clear advantage compared with individual
simulations of complex models that always provide a mixture between the forced
response and the internal variability.
1100
1700
1400 150013001200 1600 19001800
Time (years)
1.8
–1.2
–0.9
–0.6
0.0
1.2
0.6
–0.3
0.9
1.5
0.3
Temperature (K)
Figure 7.4 Anomaly of
summer mean temperature in
Fennoscandia averaged over
25 simulations that differ only
in their initial conditions
(black). The mean over the
ensemble of 25 simulations
plus and minus two standard
deviations of the ensemble are
in grey. The reconstruction of
Briffa et al. (1992) is in green.
As the reconstruction is
within the range of the
various simulations
performed with the model,
we can consider that there is
no disagreement between
model results and the
reconstruction. The reference
period is 1500–1850. The
time series are grouped in
10-year averages.
9781405159050_4_007.qxd 6/3/08 4:44 PM Page 170

Climate of the past millennium
|
171
..
Using model-derived pseudo-proxies to test
reconstruction methods
As discussed above there are primarily two distinct methods that have been used
in proxy-based climate reconstruction: the CPS method, and the CFR method.
Experiments using synthetic proxies or “pseudo-proxies” derived from climate
model simulations have been used to test the performance of both the CPS (Mann
et al. 2005b) and CFR methods (Mann and Rutherford 2002; Rutherford et al.
2003; Zorita et al. 2003; von Storch et al. 2004; Mann et al. 2005b; Wahl et al. 2006).
Since our primary interest here is on regional and spatial patterns of change, we
will focus on the CFR approach, which provides spatial patterns as well as hemi-
spheric mean reconstructions.
Most of the studies described above have found that CFR-based reconstruc-
tions for past centuries are likely to be skilful, given the spatial distributions
and estimated signal-to-noise characteristics of available proxy records. Von
Storch et al. (2004) argue that proxy-based CFR reconstructions are likely to
underestimate low-frequency variability, based on experiments using pseudo-
proxy networks derived from a millennial simulation of the GKSS ECHO-G
coupled model. Wahl et al. (2006) have challenged the von Storch et al. (2004)
calculations, arguing that they suffer from an artefact of an originally undis-
closed procedure in which data were detrended by von Storch et al. (2004) prior
to calibration. Wahl et al. (2006) note that such a procedure a priori removes
the primary pattern of low-frequency variability from the surface temperature
data.
Von Storch et al. (2004) considered only the more primitive EOF-based CFR
method of Mann et al. (1998), and not the RegEM CFR approach used in recent
work by Mann and collaborators (e.g. Mann and Rutherford 2002; Rutherford
et al. 2003, 2005). Mann et al. (2005b) tested the “RegEM” CFR method using a
simulation of the climate of the past millennium using the NCAR CSM 1.4 coupled
ocean–atmosphere model driven by estimated long-term natural and anthro-
pogenic radiative forcing histories. The simulated Northern Hemisphere mean
surface temperature history indicates modestly greater variability than most
other simulations (cf. Figure 7.3), providing a challenging test for CFR methods.
“Pseudo-proxy” data were constructed from the model surface temperature field
to have signal-to-noise attributes similar to actual proxy data networks used in
reconstructing past climates (e.g. as in Mann et al. 1998). Application of the
RegEM method to the calibration of the surface temperature field against the
pseudo-proxy networks produced skilful reconstructions of the actual surface
temperature history, underscoring that CFR methods are likely to yield reliable
reconstructions of past variations given realistic assumptions regarding the statis-
tical attributes of actual proxy data networks.
Zorita et al. (2007) have, in turn, argued that the skilful results demon-
strated by Mann et al. (2005b) may represent an artefact of the use of a long
..
9781405159050_4_007.qxd 6/3/08 4:44 PM Page 171
..
172
|
Hugues Goosse et al.
..
combined 19th–20th century (1856–1980) rather than a short, 20th century only
(1900–1980) calibration interval. They also suggest that the skilful results demon-
strated by Mann et al. (2005b) might be peculiar to the specific (NCAR CSM 1.4)
model simulation used and not possible in other simulations such as the GKSS
ECHO-G simulation used in their analyses. Finally, Zorita et al. (2007) and von
Storch et al. (2006) argue that the results presented by Mann et al. (2005b) may
represent an artefact of an inappropriate model for the proxy noise, and that
poorer results would be achieved if proxy noise was assumed to be spectrally “red”
rather than, as assumed in previous studies such as Mann et al. 2005b and von
Storch et al. (2004), “white”.
We investigate these issues based on more recent experiments by Mann et al.
(2007a,b) wherein the RegEM approach was applied to surface temperature
reconstructions using pseudo-proxy networks diagnosed from two different
model simulations: the NCAR CSM 1.4 coupled simulation used by Mann et al.
2005b, and the GKSS ECHO-G “ERIK” simulation used by von Storch et al.
(2004) and Zorita et al. (2007). The pseudo-proxy networks, as in Mann et al.
2005b, von Storch et al. (2004), and Zorita et al. (2007), have the spatial dis-
tribution of the full Mann et al. (1998) proxy network. Reconstructions were
performed based on the “short” (1900–1980) calibration interval, and a lower
signal-to-noise ratio (“SNR”) than used by Zorita et al. (2007; the proxy signal-
to-noise amplitude ratio was 0.4 whereas Zorita et al. (2007) used SNR = 0.5). The
proxy noise was specified to be spectrally “red” as in Zorita et al. (2007), using the
average noise autocorrelation coefficient ρ=0.32 estimated from the actual Mann
et al. (1998) network (see Mann et al. (2007a) for details). The resulting RegEM
reconstructions are observed to track closely the actual model temperature his-
tories for both the NCAR and GKSS simulations, and the Northern Hemisphere
mean reconstructions lie entirely within the self-consistently estimated uncertain-
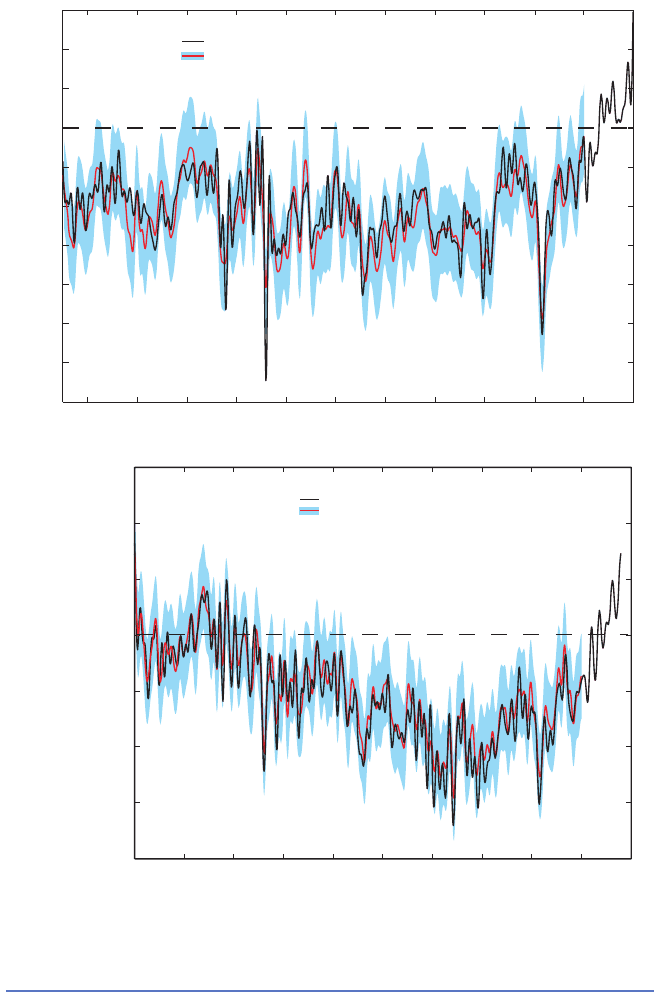
ties of the true respective model histories (Figure 7.5). The most pronounced
feature in the simulations – the cold temperatures of the 15th–19th centuries asso-
ciated with anomalous negative radiative forcing by a combination of solar irradi-
ance reduction and active explosive volcanic aerosol forcing – is well captured in
both simulations, even with the short calibration interval and “red” proxy noise
employed.
As discussed earlier the anomalous initial warmth and much of the subsequent
long-term cooling trend in the GKSS “ERIK” simulation is an artefact of the model
initialization procedures used. Mann et al. 2005b speculated that the unphysical
drift resulting from this initialization might degrade CFR performance in tests
using the “ERIK” simulation, since the drift pattern might not be captured over
the modern training intervals used for calibration. The above test using the ERIK
simulation (i.e. Figure 7.5b), however, demonstrates that this drift does not in fact
pose an obstacle for the RegEM CFR method. In conclusion, the RegEM CFR
approach should provide reliable reconstructions of past surface temperature
histories over the past millennium within estimated uncertainties, given available
proxy data networks.
9781405159050_4_007.qxd 6/3/08 4:44 PM Page 172
Climate of the past millennium
|
173
..
Using proxy reconstructions to constrain model
parameters and detect the role of the various forcings
The time evolution during the past millennium of the annual mean tempera-
ture averaged over the Northern Hemisphere generally closely follows variations in
the external forcing. This is probably the main reason for the success of relatively
..
–1.2
–1.0
–0.8
–0.6
–0.4
–0.2
0.0
0.2
0.4
0.6
Year
Actual NH mean
Reconstructed (1900–1980 calibration,
SNR = 0.4, ρ = 0.32) with uncertainties
Actual NH mean
Reconstructed (1900–1980 calibration,
SNR = 0.4, ρ = 0.32) with uncertainties
20001100 1200 1300 1400 1500 17001600 1800 1900900 1000
Year
20001100 1200 1300 1400 1500 17001600 1800 19001000
1.5
–2.0
–1.5
–1.0
–0.5
0.0
0.5
1.0
Temperature anomaly (°C)
Temperature anomaly (°C)
(a)
(b)
Figure 7.5 Reconstruction of
Northern Hemisphere (NH)
mean temperature based on
RegEM CFR reconstructions
using “pseudo-proxy”
networks taken from
(a) NCAR CSM 1.4 and
(b) GKSS ECHO-G “ERIK”
simulations. In both cases, the
pseudo-proxy network
locations correspond to the
104 unique locations used by
Mann et al. (1998), a proxy
signal-to-noise ratio SNR =
0.4, red proxy noise with noise
autocorrelation ρ=0.32, and
a 1900–1980 calibration
interval is used. Self-
consistent uncertainties in the
reconstructions are estimated
from the unresolved residual
variance during an
1856–1899 “validation”
interval, and are indicated by
shading (95% uncertainty
region). Actual model NH
series is shown for
comparison (black). All series
are decadally smoothed.
(From Mann et al. 2007a,
©American Meteorological
Society.)
9781405159050_4_007.qxd 6/3/08 4:44 PM Page 173
..
174
|
Hugues Goosse et al.
..
simple models in simulating this variable. At this spatial scale, the response of the
climate system to the total forcing is, in good approximation, equal to the sum of
the responses to all the individual forcings. It is thus possible to disentangle the role
of the various forcings by performing simulations in which only one forcing is
applied at a time (e.g. Crowley 2000; Bertrand et al. 2002; Bauer et al. 2003; see also
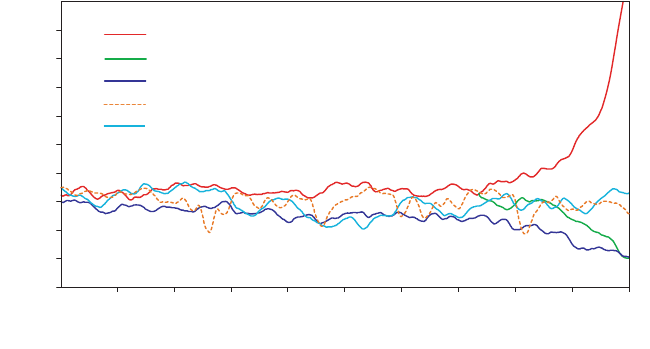
Figure 7.6).
Such simulations have allowed that, as expected, a higher than average solar
irradiance is associated with higher temperature and vice versa. As a consequence,
the solar forcing alone, as reconstructed in Figure 7.2, induces similarly high tem-
peratures during the 12th, 13th, and 20th centuries, whereas lower temperatures
are simulated during the 16th and the period covering the late 18th to early 19th
centuries. The large volcanic forcing is responsible for the simulated cold periods
after large volcanic eruptions, in particular those of 1258, 1452, 1600, 1641, and
1815. The land–use changes are associated with a long-term cooling trend and
the simulated cooling due to aerosols is mainly restricted to the 20th century.
Greenhouse gas forcing mainly induces a large warming during the past 150 years,
and if the forcing is excluded it is not possible to simulate the large temperature
increase observed during the 20th century.
The temperature response averaged over the Southern Hemisphere is more
complex than in the Northern Hemisphere. Between 50°S and 70°S, the Earth’s
surface is nearly exclusively covered by oceans, implying that the effective heat
capacity at these latitudes is much larger than in the Northern Hemisphere, induc-
ing a damped and delayed response to the forcing and thus a less clear imprint of
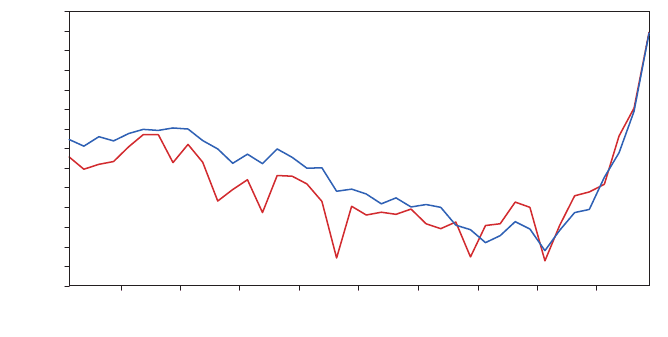
the volcanic signal than in the Northern Hemisphere (Figure 7.7). Furthermore,
the Southern Ocean experiences large-scale upwelling of relatively old water
masses that acquire their characteristics decades to centuries before they reach the
surface in the Southern Ocean. As a consequence, the surface temperature at one
particular time in the Southern Ocean is not only influenced by the radiative forc-
ing at that time but also by the previous history of forcing changes, which has left
its imprint on the characteristics of the older water masses that upwell there. This
Time (years)
20001100 1200 1300 1400 1500 17001600 1800 1900
0.6
–0.1
0.0
0.1
0.2
0.3
0.4
0.5
Temperature (K)
–0.3
–0.2
Greenhouse gas
Aerosols
Volcanos
Solar irradiance
Land-use changes
Figure 7.6 Annual mean
temperature anomaly
averaged over the Northern
Hemisphere in simulations
performed with
ECBILT–CLIO–VECODE
using only one forcing at a
time: greenhouse gas forcing
(red), aerosol forcing (green),
land-use changes (dark blue),
volcanic forcing (orange), and
solar forcing (light blue). The
curves shown are the average
over an ensemble of 10
simulations performed with
the model using one of the
forcings described in Figure
7.2. A 25-year running mean
has been applied to all the
time series. The reference
period is 1500–1850.
9781405159050_4_007.qxd 6/3/08 4:44 PM Page 174
Climate of the past millennium
|
175
..
results in a much more complex link between the forcing and the response than in
the Northern Hemisphere. For instance, this has led to the hypothesis that the
Medieval Warm Period was delayed in the Southern Ocean by 50 to 200 years com-
pared with the Northern Hemisphere (Goosse et al. 2004).
The previous discussion is mainly based on model results. The data are only
used to show that the models are providing results in agreement with the recon-
structions if all the forcings are included and that the conclusions deduced from
model simulations appear reasonable. The results could thus be model-dependent
and strongly influenced by uncertainties in the reconstruction of one particular
forcing. It is possible, however, to combine directly the model results and observa-
tions in order to detect the influence of various forcings on Northern Hemispheric
temperature during the past millennium (Hegerl et al. 2003), using techniques
similar to the ones applied for the 20th century, and to distinguish the anthro-
pogenic and natural forcings (e.g. Tett et al. 1999; Stott et al. 2001). The first step is
to obtain, from model simulations, the signal associated with a forcing, i.e. the time
evolution of the temperature change when only one forcing is applied. This is
usually called the “fingerprint” of the forcing. A multiple regression is then used
to obtain the linear combination of those fingerprints that provide the best agree-
ment with the reconstructions. In other words, the model provides the shape of the
response to a forcing whereas it is the fitting of the linear combination of the
fingerprints with observations that gives the amplitude of the response to this forc-
ing. The conclusions of such analyses are relatively insensitive to the magnitude of
the response of the model to a particular forcing or to uncertainties in the ampli-
tude of the forcing. Indeed, an error in the amplitude of the forcing of a factor of
two would simply induce a change by a factor of two in the regression coefficient, if
the response of the system could be considered as linear (e.g. Tett et al. 1999).
Using an EBM to obtain the fingerprints of the externally forced signals and
various reconstructions of Northern Hemisphere mean temperature, Hegerl et al.
(2003) were able to detect clearly the influence of volcanic forcing on temperature
changes during the past millennium. Furthermore, in their model, the time-scale
..
1100 1200 1300 1400 1500 17001600 1800 1900
Time (years)
5.0
1.0
1.5
2.0
2.5
3.0
3.5
4.5
Normalized temperature
0.0
0.5
–2.0
–1.5
–1.0
–0.5
4.0
Figure 7.7 Annual mean
temperature anomaly
averaged over the Northern
Hemisphere (red) and over
the latitude band 50–70°S in
simulations performed with
ECBILT–CLIO–VECODE
driven by natural and
anthropogenic forcings. The
time series are grouped by 25-
year average and divided by
their standard deviation to
facilitate the comparison. The
reference period is
1500–1850.
9781405159050_4_007.qxd 6/3/08 4:44 PM Page 175

..
176
|
Hugues Goosse et al.
..
of the response is similar to the one deduced from the reconstructions. The
influence of anthropogenic forcings during the late 20th century is also detected,
in agreement with studies focusing on the 20th century. Solar forcing has been
marginally detected only over some periods and in some records, thus they con-
clude that the role of this forcing has probably been weak for the multi-decadal
variability of the temperature averaged over the Northern Hemisphere.
It is possible to combine model results and data to constrain the magnitude of
the changes during the past millennium as well as the value of some important
characteristics of the climate system such as the climate sensitivity. Using a coupled
physical–biogeochemical climate model, driven by different reconstructions of
past changes in solar irradiance and volcanic forcing, Gerber et al. (2003) com-
pared the simulated CO
2
and temperature evolution with available observations.
In their analysis, for large changes in solar irradiance and hemispheric mean tem-
perature, they find large discrepancies between observed CO
2
concentration and
that simulated by the model. They argue that, between 1100 and 1700, changes in
multi-decadal Northern Hemispheric mean surface temperature larger than 1°C
are inconsistent with CO
2
records and thus not realistic. Following a similar objec-
tive to Gerber et al. (2003), Hegerl et al. (2006) recently performed a large ensemble
of simulations with an EBM over the past millennium varying two important
model parameters, namely the equilibrium climate sensitivity to a doubling of CO
2
and the effective ocean diffusivity, and using different scaling of the reconstruc-
tions of past radiative forcing. By comparing the results of this ensemble with
several reconstructions of surface temperature in the Northern Hemisphere at
(nearly) hemispheric scale, using a technique based on a Bayesian approach, they
derive a probability density function (PDF) for climate sensitivity. Such methods,
however, could be strongly dependent on prior assumptions made in the process
of the PDF estimation (e.g. Frame et al. 2005) and additional work is still required
before being able to constrain efficiently the model parameters using all the avail-
able information from the data.
Analyzing regional changes using observations
and models
At regional scales, the temperature and precipitation anomalies are strongly
influenced by the dominant mode of variability of the climate system, such as the
North Atlantic Oscillation (NAO) or El Niño–Southern Oscillation (ENSO). Any
change in these modes of variability, for instance, a shift from a positive to a nega-
tive phase, could be purely related to internal dynamics or caused by changes in the
forcing. The analysis of proxy data could allow determination of the magnitude of
the changes and the potential correlation with the reconstructions of past forcings.
Alternatively, if a model is able to simulate reasonably well the observed changes,
this could provide a reasonable hypothesis for the mechanism responsible for the
change. Despite the complementary information from model and data, determining
9781405159050_4_007.qxd 6/3/08 4:44 PM Page 176
Climate of the past millennium
|
177
..
the cause of a change in one mode of variability or in the probability to have one
phase of a mode is nearly impossible, currently, as internal variability alone could
explain the observed changes in those modes.
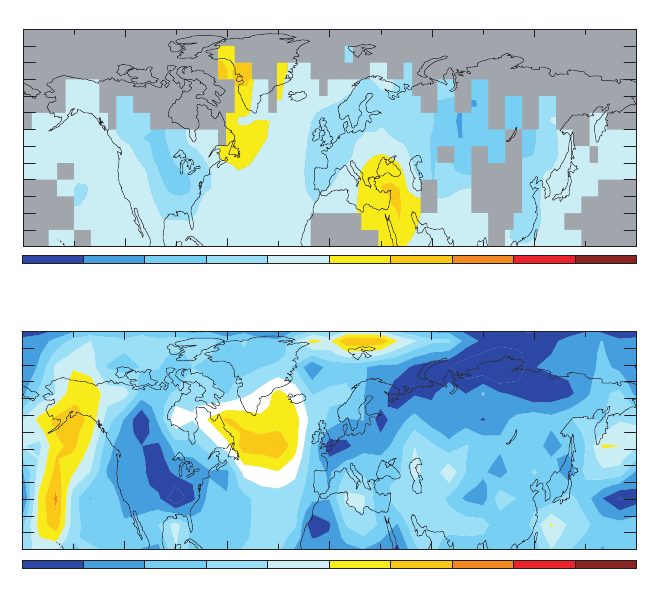
The observed substantial cooling in large parts of Europe during the late 17th
and early 18th centuries appears to be related to long-term variations in the NAO
pattern of climate variability (Figure 7.8), which are associated with variations over
time in the pattern of the Northern Hemisphere jet stream. In model simulations,
these changes are associated with a large-scale dynamical response of the climate
system to natural radiative forcing by explosive volcanic activity (Robock 2000;
Schmidt et al. 2004; Shindell et al. 2004) and solar output (Shindell et al. 2001;
Schmidt et al. 2004) that interacts with the NAO pattern of atmospheric circula-
tion. This has led to the suggestion that the moderate apparent lowering of solar
irradiance during the 17th century leads to only moderate decreases in hemi-
spheric mean temperature, but a tendency for strong annual mean cooling in some
regions, such as Europe.
Recent work suggests that the El Niño–Southern Oscillation may also be an
important component of the response of the climate to forcing over the past
1000 years. Model simulations using simple models of the coupled tropical
ocean–atmosphere to study the response of ENSO to solar and volcanic forcing
(Mann et al. 2005a) indicate a counterintuitive tendency towards El Niño (warm
..
Proxy data reconstruction, 1660–80 vs 1770–90, ANN surface temperature
GCM simulation, 1680 vs 1780 solar + volcano, ANN surface temperature
80
20
40
60
–1.5 0.6 0.80.40.20.0–0.2–0.4–0.6–0.8 1.0
–1.5 0.6 0.80.40.20.0–0.2–0.4–0.6–0.8 1.0
80
20
40
60
Figure 7.8 Reconstructed
(top) and simulated (bottom:
GCM, general circulation
model) annual (ANN)
average surface temperature
differences between 1660–80
and 1770–90. The
reconstructed surface
temperatures are based on a
multi-proxy estimate using
tree rings, ice cores, corals,
and historical data. Model
results are based on the sum
of the response in two
simulations: one
incorporating reconstructed
solar irradiance changes
during this period and one
using volcanic forcing scaled
to changes over this time.
(From Schmidt et al. 2004.
Copyright Elsevier (2004).)
9781405159050_4_007.qxd 6/3/08 4:44 PM Page 177

..
178
|
Hugues Goosse et al.
..
eastern and central tropical Pacific) conditions in response to negative radiative
forcing (past explosive tropical volcanic eruptions or decreases in solar irradiance)
and a tendency for La Niña-like conditions in response to positive radiative forcing
(i.e., increases in solar irradiance). This prediction matches available evidence
from tropical Pacific coral records (Cobb et al. 2003). The response of ENSO to the
combined effects of solar and volcanic forcing in past centuries provides a poten-
tial explanation for why the tropical Pacific appears to have been in a cold La Niña-
like state during the so-called “Medieval Warm Period” and a warm El Niño-like
state during the “Little Ice Age” (Adams et al. 2003).
Changes in oceanic circulation could also have an impact on regional changes
during the past millennium. Unfortunately, there are not enough high-frequency
observations in the ocean to derive a clear and comprehensive view of oceanic
changes during this period. The available information is mainly derived from some
local observations and model results. A thorough model–data comparison has not
been performed yet but that could certainly be very useful and would help to fill
some of the gaps in our knowledge. In particular, when driven by a reduction of the
solar irradiance (or more generally in case of a moderate cooling), models tend to
simulate an intensification of the meridional overturning circulation in the
Atlantic (Cubasch et al. 1997; Goosse and Renssen 2004; Weber et al. 2004). This is
due to an increase in the density of the surface water in the North Atlantic, caused
by cooling and by changes in the freshwater budget, inducing more vigorous deep
water formation there. The intensification of the oceanic circulation implies a
larger heat transport towards the high latitudes and is thus associated with a nega-
tive feedback in those regions of the initial cooling. For a moderate warming, the
opposite mechanism is noticed, presenting some similarities with what is expected
for the 21st century (e.g. Gregory et al. 2005). A reduction of the solar forcing
might also modify the probability of having years with significantly reduced inflow
of warm Atlantic waters at high latitudes (Goosse and Renssen 2004). This leads to
a higher probability of having very cold conditions in the Nordic Seas and over
Scandinavia, resulting overall in a very strong positive feedback in the northern
North Atlantic and surrounding regions during those cold periods. There is also
evidence for the potentially important response of the Atlantic meridional over-
turning to low-frequency changes in the NAO (Delworth and Dixon 2000), which
have in turn been simulated as a possible response to long-term solar and volcanic
forcing in past centuries (Shindell et al. 2001, 2004; Schmidt et al. 2004).
Assimilation of observations
Classically, the information deduced from the analysis of observations and from
model simulations is obtained from two different, clearly separated streams that
are then combined to provide additional insight, in order to give more strength to
the conclusions, or to propose a new interpretation. In the sections above, we have
shown examples where a stronger coupling between modeling and data analysis
9781405159050_4_007.qxd 6/3/08 4:44 PM Page 178
Climate of the past millennium
|
179
..
could be very instructive. This is precisely the goal of the assimilation of observa-
tions or data assimilation, which is defined by Talagrand (1997) “as the process
through which all the information is used to estimate as accurately as possible
the state of the atmospheric or oceanic flow. The available information essentially
consists of the observations proper, and of the physical laws which govern the
evolution of the flow. The latter are available in practice under the form of a
numerical model.”
Data assimilation techniques have been used successfully in various domains of
meteorology and oceanography during the past decades (for a review, see for
instance Talagrand 1997; Kalnay 2003, Brasseur 2006). One of the initial and most
important applications of such techniques is in weather forecasting, to determine
the initial conditions at a time t
0
from which subsequent evolution of the system at
time t > t
0
will be deduced. This step, which is called the analysis, combines some
background information (also denoted as first guess or prior information) with
available observations. Following the notation and formulation of Kalnay (2003),
observed variables are noted y
0
, while x
b
is the background field. It is generally
obtained from a previous forecast using a model simulation starting from an ana-
lysis at time t − 1 (t − 1<t
0
) until time t
0
. Both y
0
and x
b
are three-dimensional
fields. Variables y
0
and x
b
are not usually obtained at the same location and some
interpolation is needed. Furthermore, observations could provide a different vari-
able than the one needed by the model. Some transformation of model results (or
alternatively of observations) is then needed before they can be compared with
data. This is represented by H(x
b
), where H is called the observation operator. The
difference between the first guess obtained from the model forecast and observa-
tions, y − H(x
b
), is called observational increment or innovation. The analysis x
a
is
then obtained by adding this innovation to the model forecast, using some weight
W that is determined by accounting for uncertainties in model results as well as in
observations. This could be mathematically represented by
x
a
= x
b
+ W(y
0
− H(x
b
)) (1)
The sequence of obtaining a first guess from model results and then updating
using data to provide the analysis can be repeated from time to time in an “analysis
cycle”. Such a technique is often called sequential assimilation (e.g. Talagrand
1997; Kalnay 2003).
In weather forecasting, model and data assimilation schemes (for instance the
formulation of W and H) are improved regularly, providing potential inconsis-
tencies between different periods. Reanalyses of the past 50 years, using the same
procedure during all periods covered (e.g. Kalnay et al. 1996), have provided a very
valuable and widely used comprehensive set of atmospheric fields.
Such a procedure could, in theory, be applied to any period and thus also for the
past millennia. However, several difficulties arise, a major one being the amount of
data. Hundreds of thousands of atmospheric and surface observations are used for
the analyses in weather forecasting, covering all areas of the world, and providing a
very detailed knowledge of the atmospheric state, whereas only a few tens up to
..
9781405159050_4_007.qxd 6/3/08 4:44 PM Page 179