Chen C.J. Physics of Solar Energy
Подождите немного. Документ загружается.


i
i
“ChenSolarEnergy” — 2011/5/17 — 17:56 — page 102 — #129
i
i
i
i
i
i
102 Tracking Sunlight
Equation 4.75 can be used to convert standard time to solar time. Standard time
is defined by an offset Δ from UT, almost always an integer number of hours. For
example, Eastern Standard Time (EST) is defined by UT–5h, or Δ = −5; Eastern
Daylight Saving Time (EDT) is defined by UT–4h, or Δ = −4. The solar time t
is
t
=UT+
1
15
λ − Δ+ET, (4.76)
where λ is the longitude of the observer, each hour corresponds to 15
◦
degree; and ET
is the equation of time given by Eq. 4.73.
By setting t
= 0, the standard time for solar noon, T
0
, can be determined from
Eq. 4.76,
T
0
=Δ−
1
15
λ − ET. (4.77)
As an example, New York City, where λ = −73
◦
58
, corresponds to minus 4 h
and 56 min. For EST, Δ = −5. At EST noon, the mean solar time is 12:04 in the
afternoon. In mid-November, Eq. 4.75 gives ET = 16 min, which means the real Sun
is 16 min faster than the mean Sun. Therefore, at 12:00 EST, solar time is 12:20 in the
afternoon. The Sun is 5
◦
west of the meridian.
4.4.7 Declination of the Sun
In Section 4.3.1, we presented an approximate equation for the declination of the Sun
(Eq. 4.27). Here, we derive a more accurate equation for the declination δ of the Sun.
The reference point of the Sun’s declination is the March equinox, where by definition
the declination is zero and the ecliptic longitude is also zero. If the Sun’s longitude
runs linear over time, the sine formula gives
sin δ =sinε sin l. (4.78)
However, the ecliptic motion of Earth gives rise to an additional term,
sin δ =sinε sin {l +2e [sin(l − l
0
) − sin l
0
]}. (4.79)
Consequently,
δ = arcsin (sin ε sin {l +2e [sin(l − l
0
) − sin l
0
]}) . (4.80)
4.4.8 Analemma
As a combined result of Equation of Time and the variation of declination, the apparent
position of the Sun at a given time of the day varies over the date in a year, which forms
a well-defined trajectory on the sky, the analemma. The trajectory can be recorded
by fixing a camera towards the Southern sky (in the Northern hemisphere), taking one
picture at the same time of the day everyday, then superimpose the pictures of the
sunny days. A “8”-like pattern is revealed. Plate 2 is compiled by Greek astronomer
Anthony Ayiomamitis from 47 clear-day photos taken in 2003 near the Temple of
Apollo, Corinth, Greece.

i
i
“ChenSolarEnergy” — 2011/5/17 — 17:56 — page 103 — #130
i
i
i
i
i
i
Problems
4.1. For a place in the frigid zone with latitude φ that satisfies φ>π/2 −ε, determine
the starting day and ending day in a year that the Sun never sets.
4.2. For a place in the frigid zone with latitude φ that satisfies φ>π/2 −ε, determine
the starting day in a year and ending day in the next year that the Sun never rises.
4.3. For a south-facing window of area A, calculate the total solar radiation for any
day in the year.
Hint: For days after the vernal equinox and before the autumnal equinox, the time
of radiation is between the two points where the Sun crosses the east–west great circle.
Otherwise the Sun is at the west side of the building.
4.4. On gage C3 of the 2009 Astronomical Almanac, the leading terms of the equation
of time in units of seconds are (using our notations)
ET = −108.5sinl + 596.0sin2l − 428.2cosl, (4.81)
where
l = 279
◦
.791 + 0.985647N, (4.82)
where N is the number of days counted from January 1, and l is the mean longitude
of the Sun.
Questions:
1. What is the meaning of the number 0.985647?
2. What is the meaning of the phase angle 279
◦
.791?
4.5. Write the sine and cosine terms in Eq. 4.81 in the form of sin (l −l
0
), where l
0
is
a constant phase angle. Explain the meaning of the constant l
0
.
4.6. Determine the sunset time (in solar time) and the length of daytime of New York
City on New Years Day, Memorial Day, Labor Day, and Thanksgiving Day.
4.7. What is the ratio of solar power on a vertical surface facing south, a horizontal
surface, and a latitude-tilt surface, at solar noon of an equinox (vernal equinox or
autumnal equinox) for New York City?
4.8. In New York City, where the latitude is 40
◦
47’, on Memorial Day (May 25) and
Thanksgiving Day (Nov 27) of 2009, at solar noon, determine the declination of the
Sun, the height of the Sun, and the power density of direct sunlight in watts per square
meter on a horizontal surface at that time.
4.9. In New York City, where the latitude is 40
◦
47’ and longitude is -73
◦
58’, on Memo-
rial Day (May 25) and Thanksgiving Day (Nov 27) of 2009, determine the civil time
(EST, or EDT if necessary) of solar noon (the time the Sun passes the local meridian).
Problems 103

i
i
“ChenSolarEnergy” — 2011/5/17 — 17:56 — page 104 — #131
i
i
i
i
i
i
104 Tracking Sunlight
4.10. For a surface of arbitrary orientation β and γ, find out the starting time and
ending time of solar radiation on the surface.
4.11. For a surface facing south, γ = 0 but β = 0, find out the starting time and
ending time of solar radiation on the surface.
4.12. For a surface facing south, γ = 0 but β = 0, find out the direct daily radiation.
i
i
“ChenSolarEnergy” — 2011/5/17 — 17:56 — page 105 — #132
i
i
i
i
i
i
Chapter 5
Interaction of Sunlight with Earth
In this chapter, we study the interaction of sunlight with Earth. Due to the effect of
the atmosphere, about one-half of sunlight is reflected, scattered, or absorbed before
reaching the ground. The available sunlight varies with location and time. Furthermore,
the sunlight absorbed by the ground penetrates into Earth, is stored as heat, and
becomes shallow geothermal energy, a significant component of renewable energy.
5.1 Interaction of Radiation with Matter
In this section, the general physical phenomena of the interaction of radiation with
matter are described.
5.1.1 Absorptivity, Reflectivity, and Transmittivity
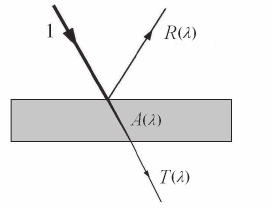
When a ray of radiation falls on a piece of matter, in general, part of the radiation is
reflected, another part is absorbed, and yet another part is transmitted. To describe and
characterize the interaction of radiation with matter, the following three dimensionless
coefficients are introduced:
A(λ), absorptivity or absorptance: fraction of incident radiation of wavelength λ
absorbed
R(λ), reflectivity or reflectance : fraction of incident radiation of wavelength λ re-
flected
Figure 5.1 Absorptivity, reflectivity,
and transmittivity. Part of the radi-
ation falling on a piece of matter is ab-
sorbed, another part is reflected, and the
rest is transmitted. Three dimensionless
coefficients are introduced: absorptivity
A(λ), reflectivity R(λ), and transmittivity
T (λ). Conservation of energy requires that
A(λ)+R(λ)+T (λ)=1.
105Physics of Solar Energy C. Julian Chen
Copyright © 2011 John Wiley & Sons, Inc.

i
i
“ChenSolarEnergy” — 2011/5/17 — 17:56 — page 106 — #133
i
i
i
i
i
i
106 Interaction of Sunlight with Earth
T (λ), transmittivity or transmittance: fraction of incident radiation of wavelength
λ transmitted
If the nature of the radiation does not change or its wavelength stays unchanged, conser-
vation of energy requires that incident radiation be absorbed, reflected, or transmitted;
see Fig. 5.1. Therefore
A(λ)+R(λ)+T (λ)=1. (5.1)
For opaque surfaces, the transmittivity is zero. Conservation of energy requires that
incident radiation be either absorbed or reflected,
A(λ)+R(λ)=1. (5.2)
5.1.2 Emissivity and Kirchhoff’s Law
When matter is heated, it will radiate according to Planck’s law (Fig. 5.2). The ac-
tual power density of radiation also depends on the nature of the surface. However, it
never exceeds that of a blackbody. The actual radiation from a surface as a fraction
of blackbody radiation at a given wavelength is called its emissivity E(λ). It is less
than 1, except it equals exactly 1 for a blackbody. Based on classical thermodynam-
ics, Kirchhoff showed that the emissivity of a surface at a given wavelength must equal
its absorptivity. At thermal equilibrium, the radiation energy emitted must equal the
radiation energy absorbed. Otherwise heat can transfer from a cold reservoir to a hot
reservoir, which violates the second law of thermodynamics (see chapter 6). There-
fore, the absorptivity at a given wavelength must equal the emissivity at the same
wavelength,
E(λ)=A(λ). (5.3)
Figure 5.2 Emissivity and absorptivity.
When heated, matter radiates electromagnetic
waves. The maximum radiation power spec-
trum follows Planck’s law. For the general
case, the radiation from a surface as a fraction
of blackbody radiation at a given wavelength is
called its emissivity, E(λ). At thermal equilib-
rium, the radiation energy emitted must equal
the radiation energy absorbed. Consequently,
E(λ)=A(λ).
i
i
“ChenSolarEnergy” — 2011/5/17 — 17:56 — page 107 — #134
i
i
i
i
i
i
5.1 Interaction of Radiation with Matter 107
5.1.3 Bouguer–Lambert–Beer’s Law
An empirical relationship between the absorption of light and the property of the
absorbing medium was discovered by Pierre Bouguer before 1729, then was formulated
by Johann Heinrich Lambert in 1760 in his monograph “Photometria.” It states that
the light intensity depends exponentially on the thickness of the optical path z,
I
λ
(z)=I
λ
(0) e
−A(λ) z
, (5.4)
where A(λ) is the absorption coefficient of the medium at wavelength λ, which has a
dimension of inverse length and z is the optical path.
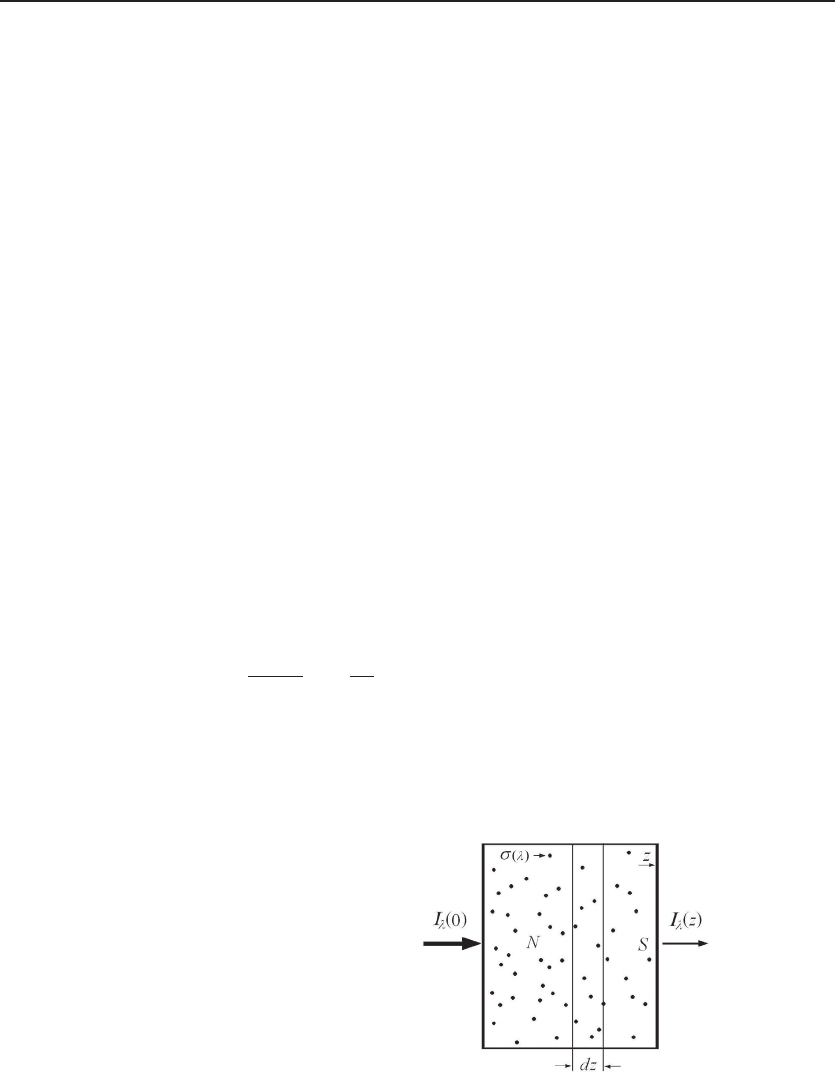
The empirical relation was further developed by August Beer in 1852 to correlate
the absorption coefficient with the concentration of absorbing particles, known as the
Beer’s law or Bouguer–Lambert–Beer’s law,
I
λ
(z)=I
λ
(0) e
−Nσ(λ) z
, (5.5)
where N is the number of absorbing particles per unit volume and σ(λ)istheabsorption
cross section of the absorbent at wavelength λ. An intuitive proof is shown in Fig. 5.3.
For a thin slice in the absorption path of thickness dz and cross sectional area S,the
fractional area dS occupied by the absorbing particles is
dS = Nσ(λ) Sdz. (5.6)
Obviously, a proportion dS/S of radiation energy is blocked by the absorbing particles,
dI
λ
(z)
I
λ
(z)
= −
dS
S
= −Nσ(λ) dz. (5.7)
Integrating over z and using the initial condition at z = 0, one obtains
I
λ
(z)=I
λ
(0) e
−Nσ(λ) z
. (5.8)
Figure 5.3 Bouguer–
Lambert–Beer’s law. Variation
of light intensity with the concen-
tration of the absorbing particles
and the length of the optical
path plays an important role in
the study of the effect of the
atmosphere on sunlight.
i
i
“ChenSolarEnergy” — 2011/5/17 — 17:56 — page 108 — #135
i
i
i
i
i
i
108 Interaction of Sunlight with Earth
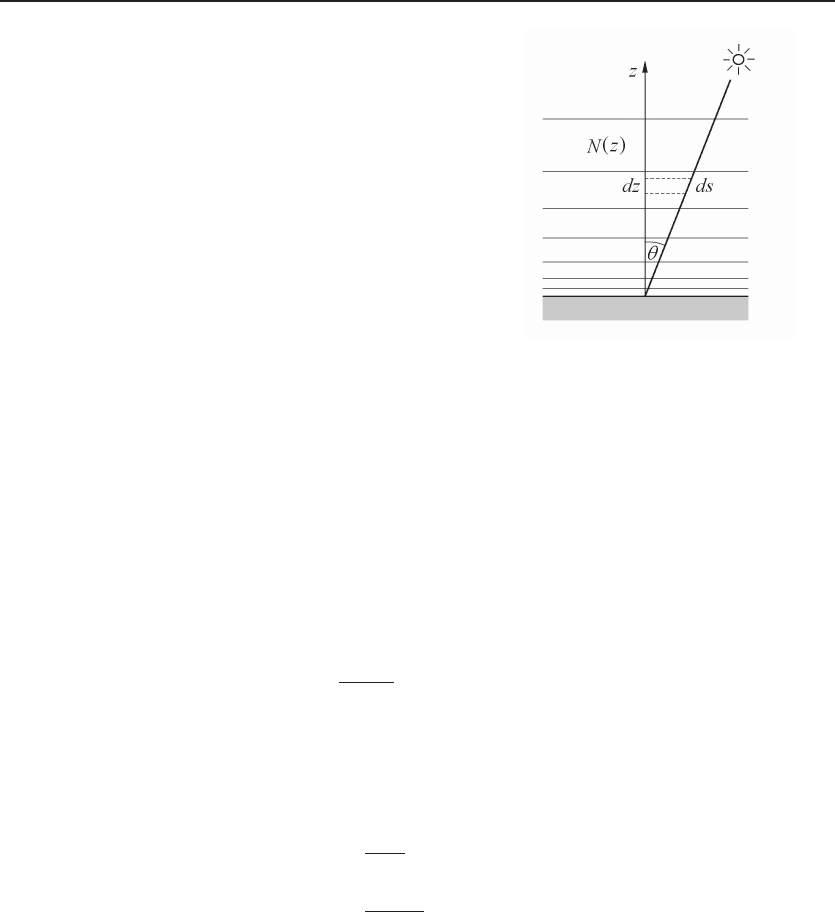
Figure 5.4 Attenuation of sun-
light at azimuth θ. Variation of
light intensity with the concentration
of the absorbing particles and the
length of the optical path plays an
important role in the study of the ef-
fect of the atmosphere on sunlight.
Comparing with Eq. 5.4, one finds A(λ)=Nσ(λ). If the concentration of particles is
not uniform over the optical path, which can be described by a concentration distribu-
tion N(z), the above relation can be extended to
I
λ
(z)=I
λ
(0) exp
−
z
0
σ(λ) N (z) dz
. (5.9)
Now we look into a situation relevant to the attenuation of sunlight by the atmo-
sphere; see Fig. 5.4. In the atmosphere, to a good approximation, the distribution of
molecules and particles is a function of height z. If the Sun is at the zenith, according
to Eq. 5.9, the absorbance over the entire atmosphere is
α(λ, 0) =
I
λ
(0)
I
λ
(∞)
=exp
−
∞
0
σ(λ) N (z) dz.
. (5.10)
If the azimuth of the Sun is θ — notice that dz = ds cos θ (see Fig. 5.4) — the absorbance
becomes
α(λ, θ)=exp
−
∞
0
σ(λ) N (z) ds
=
1
cos θ
exp
−
∞
0
σ(λ) N (z) dz
=
α(λ, 0)
cos θ
.
(5.11)
5.2 Interaction of Sunlight with Atmosphere
The interaction of sunlight with the atmosphere has been studied extensively by climate
scientists. Here is a summary. Approximately, 30% of solar radiation is reflected or
i
i
“ChenSolarEnergy” — 2011/5/17 — 17:56 — page 109 — #136
i
i
i
i
i
i
5.2 Interaction of Sunlight with Atmosphere 109
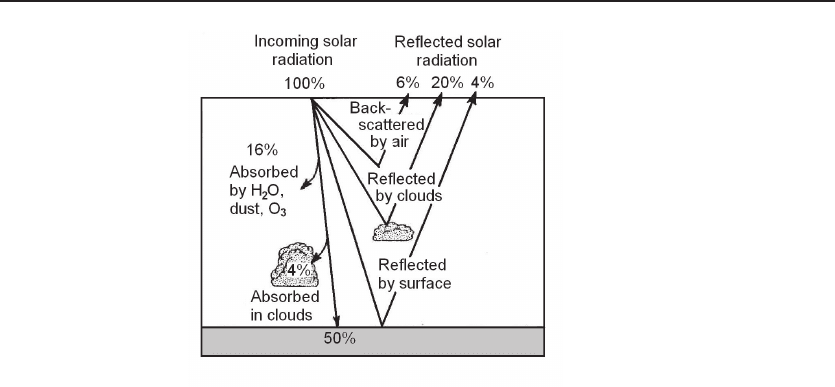
Figure 5.5 Interaction of sunlight with atmosphere. Approximately 30% of solar radiation is
reflected or scattered back to space immediately, 20% is absorbed by the atmosphere and cloud, and
50% is absorbed by Earth. (See Ref. [66], p. 94).
scattered back to space, see Fig. 5.5. Six percent is scattered by air; 20% is reflected by
clouds; 4% is reflected by the surface of Earth; and 20% is absorbed by the atmosphere:
16% is absorbed by water vapor, dust, and O
3
. Another 4% is absorbed by the cloud.
The solar radiation thus absorbed heats up the atmosphere. Fifty percent is absorbed
by the solid surface of Earth. The total radiation energy received by the atmosphere
and the solid Earth is about 70%.
Earth should be in thermal equilibrium with the surroundings. Indeed, the 70% of
solar energy entering the atmosphere and Earth is transferred back to space as heat
radiation.
5.2.1 AM1.5 Reference Solar Spectral Irradiance
According to several decades of careful measurements, the power density of solar radia-
tion outside the atmosphere is 1366 W/m
2
. On the surface of Earth, due to scattering
and absorption, even under a perfectly clear sky, when the Sun is right at the zenith,
solar radiation is reduced by about 22%. Because, on average, the Sun should have an
azimuth angle with the horizon, the reduction should be on average more than 22%.
To standardize the measurement of solar energy applications, in 1982, the American
Society for Testing and Materials (ASTM) started to promulgate Standard Tables of
Reference Solar Spectral Irradiance at Air Mass 1.5. The standard was revised in
2003 as ASTM G173-03. A separate standard for zero air mass was promulgated in
2006 to become ASTM E490-06. An extension to different tilt angles was promulgated
in 2008 as ASTM G197-08. In both ASTM G173-03 and G197-08, atmospheric and
climatic conditions are identical. These standards represent the solar radiation under
reasonable cloudless atmospheric conditions favorable for the computerized simulation,
i
i
“ChenSolarEnergy” — 2011/5/17 — 17:56 — page 110 — #137
i
i
i
i
i
i
110 Interaction of Sunlight with Earth
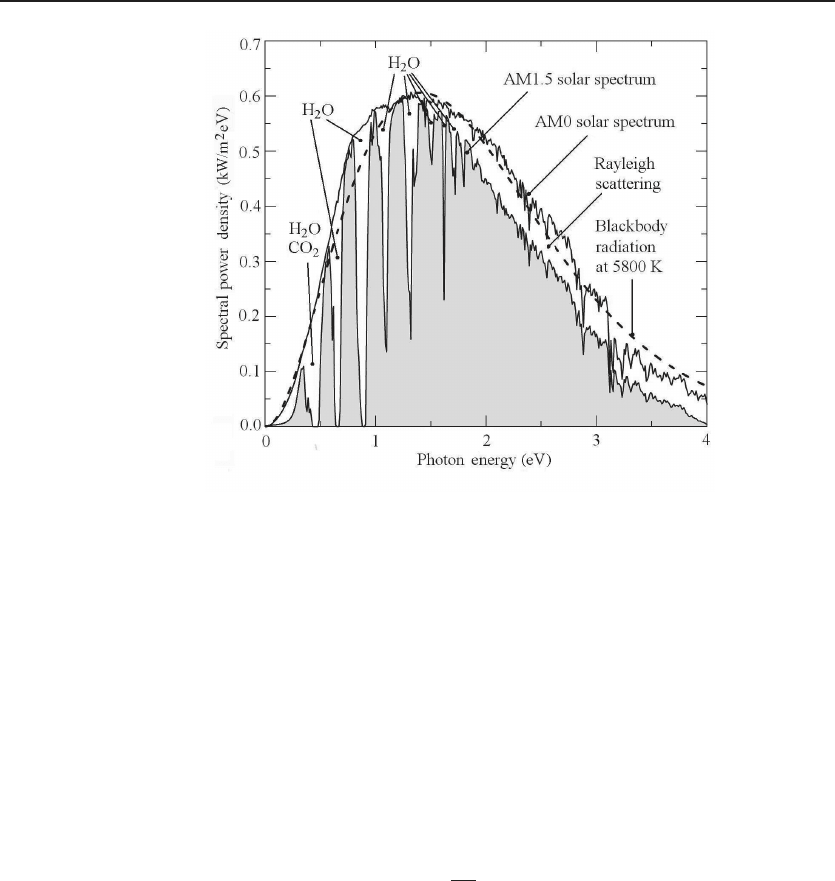
Figure 5.6 AM0 and AM1.5 solar radiation spectra. The AM0 spectrum is the solar radiation
outside the atmosphere. It is approximately a blackbody radiation at 5800 K. The integrated power
density is 1.366 kW/m
2
. The AM1.5 spectrum shows a number of atmospheric effects. On the blue
side, there is a broad-band reduction of power density due to Rayleigh scattering from molecules and
dust particles. On the infrared side, water vapor contributes the most absorption, followed by carbon
dioxide.
comparative rating, or experimental testing of fenestration systems. The U.S. standard
was adapted by the International Organization for Standardization (ISO) to become
ISO 9845-1, 1992.
The meaning of air mass (AM) is as follows. When the Sun is at the zenith under
reasonable cloudless atmospheric conditions, the absorption due to the atmosphere is
defined as air mass 1. In most cases, the zenith angle of the Sun is not zero. ASTM
chose as the standard the condition when the absorption is 1.5 times the normal air
mass, abbreviated as AM1.5. According to Eq. 5.11, the standard zenith angle is
θ = arccos
1
1.5
=48.19
◦
. (5.12)
Also see Fig. 5.4. The integrated power density of the AM1.5 solar radiation is 1
kW/m
2
. The quantity 1 kW/m
2
is defined as a unit of radiation, called one sun.We
shall use this unit throughout the book.
The spectral irradiance or the radiation power spectrum for AM0 and AM1.5 solar
radiation is shown in Fig. 5.6. The AM0 spectrum is the solar radiation outside the
atmosphere. It is approximately a blackbody radiation at 5800 K. The integrated power
density is 1.366 kW/m
2
. The AM1.5 spectrum shows a number of atmospheric effects.

i
i
“ChenSolarEnergy” — 2011/5/17 — 17:56 — page 111 — #138
i
i
i
i
i
i
5.2 Interaction of Sunlight with Atmosphere 111
On the blue side, there is a broad-band reduction of power density due to Rayleigh
scattering from molecules and dust particles. The probability of Rayleigh scattering is
proportional to the inverse fourth power of the wavelength of the radiation, and thus
the short-wavelength radiation is reduced heavily. On the infrared side, water vapor
contributes the most absorption followed by carbon dioxide. Plate 1 is a colored verion
of Fig. 5.6. A table of the data is shown in Appendix E.
5.2.2 Annual Insolation Map
In Chapter 4, we discussed the variation of direct solar radiation as a function of time
(day in a year and time in a day) and location (latitude and longitude). Because of the
interaction of solar radiation with the atmosphere, the actual solar radiation received
at the surface is always less, and the percentage of reduction depends on the location.
A frequently used representation is the annual insolation map; see Plates 3–5. There
are two conventions:
1. Annual radiation energy in kilowatt-hours per square meter. The standard solar
radiation is defined as one sun, or 1 kW/m
2
. Therefore, the insolation is often expressed
in hours per year. The number ranges from more than 2000 h/year (Sahara desert,
part of Outback of Australia, part of South Africa) to less than 600 h/year (Greenland,
northern parts of Siberia, Finland, and Canada).
2. Average diurnal radiation energy in kilowatt-hours per square meter over a year.
Similarly, it is often expressed in h/day. The number ranges from more than 6 h/day
to less than 2 h/day.
There is an obvious relation between those two conventions:
Annual insolation = 365.2422 × average diurnal insolation. (5.13)
Plate 3 is an average diurnal insolation map of the world, Plate 4 is an average diurnal
insolation map of the United States, and Plate 5 is an annual insolation map of Europe.
5.2.3 Clearness Index
In most cases the insolation shown on the maps is smaller than the solar radiation
derived in Chapter 4. The ratio is the clearness index,
K
T
=
H
H
0
, (5.14)
where
H
0
is the average diurnal insolation under cloudless conditions from Chapter 4;
and
H is the observed average diurnal insolation, typically over a year or a month.
From a practical point of view, monthly averaged diurnal insolation is the most
useful data for the application of solar energy and is also widely measured at many
solar observation stations in the world. The clearness index
K
T
, in percent, is also
collected for many cities in the world. Table 5.1 shows the clearness index at several
U.S. cities, from the sunniest city on Earth, Yuma, Arizona, to one of the wettest cities,
Hilo, Hawaii. The last column is the annual average clearness index.