Chen C.J. Physics of Solar Energy
Подождите немного. Документ загружается.


i
i
“ChenSolarEnergy” — 2011/5/17 — 17:56 — page 112 — #139
i
i
i
i
i
i
112 Interaction of Sunlight with Earth
Table 5.1: Monthly Clearness Index K
T
[%] of Selected U.S. Cities
City Jan Feb Mar Apr May Jun Jul Aug Sep Oct Nov Dec Ave
Yuma, AZ 83 87 91 94 97 98 92 91 93 93 90 83 91
Las Vegas, NV 74 77 78 81 85 91 84 86 92 84 83 75 82
Los Angeles, CA 70 69 70 67 68 69 80 81 80 76 79 72 73
Denver, CO 67 67 65 63 61 69 68 68 71 71 67 65 67
New York, NY 49 56 57 59 62 65 66 64 64 61 53 50 59
Seattle, WA 27 34 42 48 53 48 62 56 53 36 28 24 45
Hilo, HI 48 42 41 34 31 41 44 38 42 41 34 36 39
5.2.4 Beam and Diffuse Solar Radiation
Most solar radiation data are collected with a pyranometer to measure the global solar
irradiance from a hemisphere. A typical pyranometer is shown in Fig. 5.7. The cen-
terpiece of the instrument is a dishlike blackbody absorber (1), covered by a protective
glass dome (2). The radiation received by the absorber generates a voltage which is
proportional to the heat and is connected to a voltmeter through the cable (3). No
battery and electronics are needed. By design, the instrument receives direct (beam)
sunlight and the diffuse sunlight from the entire sky.
The solar radiation on a surface is always a mixture of direct (beam) sunlight
and diffuse sunlight. In any practical application, direct (beam) sunlight and diffuse
sunlight behave differently. For example, for concentrated solar applications, only direct
sunlight is used. On the other hand, for flat solar thermal or photovoltaic receivers,
diffuse sunlight plays a significant role. It is important to know the proportion of these
two.
In general, the cloudier the climate, the higher the proportion of diffuse radiation.
There should also be a quantitative correlation between the clearness index and the
ratio between beam sunlight and diffuse sunlight. The problem was studied in detail
by Liu and Jordan [52], and a large body of literature has been accumulated. The
central issue is to estimate the ratio of diffuse radiation averaged over a period of time
Figure 5.7 Pyranometer. The
center piece of the instrument is
a dishlike blackbody absorber (1),
covered by a protective glass dome
(2). It generates a voltage propor-
tional to the radiation received by
the absorber over the entire hemi-
sphere, then outputs it through the
cable (3).
i
i
“ChenSolarEnergy” — 2011/5/17 — 17:56 — page 113 — #140
i
i
i
i
i
i
5.2 Interaction of Sunlight with Atmosphere 113
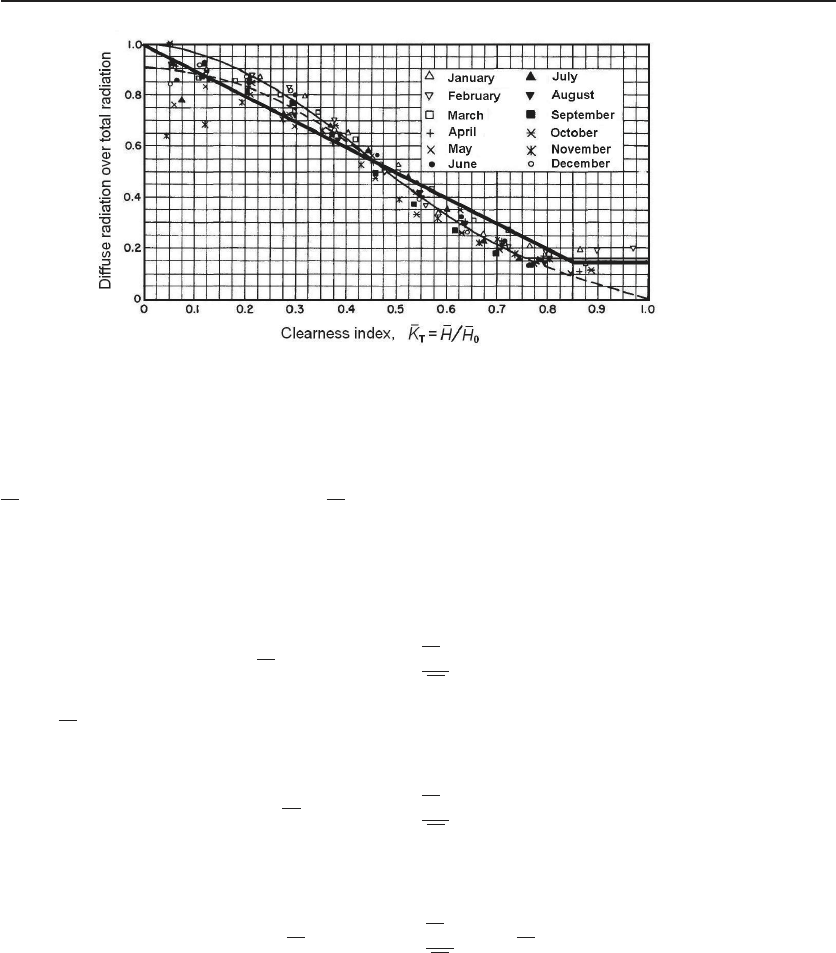
Figure 5.8 Correlation between diffuse radiation and clearness index. Data points are from
Liu and Jordan [52]. The thick straight lines represent the simplified model, Eqs. 5.15 – 5.17. The
curves represent third-order polynomials by Liu and Jordan [52]. Later data and analysis also support
a simple linear relation, see Ref. [54].
H
d
over the total averaged radiation H. Here we present a conceptually simple model
for a rule-of-thumb estimate. It has three components.
First, even for a perfectly clear day, diffuse radiation from the sky is appreciable.
Experiments show that the average proportion of diffuse radiation is about 15% of total
radiation. Therefore, if the clearness is greater than 85%, the ratio is 15%:
if
K
T
> 0.85, then
H
d
H
=0.15, (5.15)
where
K
T
is defined in Eq. 5.14.
Second, for a heavily cloudy sky, all the radiation is diffuse.
if
K
T
≈ 0, then
H
d
H
=1. (5.16)
Third, for the cases in between, the simplest mathematical representation is a linear
interpolation,
If 0.85 >
K
T
> 0, then
H
d
H
=1−
K
T
. (5.17)
The conceptually and mathematically very simple model fits the data published by
Liu and Jordan [52] reasonably well and is in agreement with several later publications.
See Fig 5.8. The thick straight lines represent the simplified model, Eqs 5.15 – 5.17.
The curves represent more complicated formulas by Liu and Jordan.

i
i
“ChenSolarEnergy” — 2011/5/17 — 17:56 — page 114 — #141
i
i
i
i
i
i
114 Interaction of Sunlight with Earth
5.3 Penetration of Solar Energy into Earth
It is an experimental fact that in most solids the heat flux q
z
along direction z is
proportional to the temperature gradient in the solid along that direction,
q
z
= −k
∂T
∂z
, (5.18)
where k is the thermal conductivity, a constant depending on the material nature of the
solid; and the negative sign is a result of that fact that the heat flows in the direction
of decreasing temperature. In the International System of Units (SI), the unit for heat
flux is watts per square meter. The unit for thermal conductivity is watts per meter
Kelvin. A table of thermal conductivities of commonly used materials in construction
is given as Table 5.2.
Consider a one-dimensional system in which the temperature and heat flux are a
function of position z and time t. Practically, the system could be a bar with uniform
cross section A. The temperature and the heat flux are uniform within each cross
section. If the density of the material is ρ and its heat capacitance is c
p
, the change in
the heat content of a slab with thickness Δz with temperature is
ΔQ = ρc
p
A ΔT Δz. (5.19)
Combining Eqs 5.18 and 5.19, we find the differential equation for the temperature
distribution,
∂T
∂t
=
k
ρc
p
∂
2
T
∂z
2
. (5.20)
Let
α =
k
ρc
p
. (5.21)
Table 5.2: Thermal Property of Earth
Material Density Heat Thermal Coefficient
ρ capacity c
p
conductivity kα
(10
3
kg/m
3
)(10
3
J/kg·K) (W/m·K) (10
−6
m
2
/s)
Limestone 2.18 0.91 1.5 0.626
Granite 3.0 0.79 3.5 1.47
Earth (wet) 1.7 2.1 2.5 0.70
Earth (dry) 1.26 0.795 0.25 0.25
Source : American Institute of Physics Handbook,
American Institute of Physics, New York, 3rd Ed., 1972; and Ref. [31].

i
i
“ChenSolarEnergy” — 2011/5/17 — 17:56 — page 115 — #142
i
i
i
i
i
i
5.3 Penetration of Solar Energy into Earth 115
Equation 5.20 then becomes
∂T
∂t
= α
∂
2
T
∂z
2
. (5.22)
We seek a solution of Eq. 5.22 for a semi-infinite space z ≥ 0 with boundary conditions
T = T
0
+ΔT cos ωt, z =0, (5.23)
T = T
0
,z= ∞, (5.24)
where ΔT is the amplitude of the temperature variation at z = 0 and ω is its circular
frequency. In the case we are considering, that is, the annual variation of temperature,
the circular frequency is
ω =
2π
(365.25 × 86400)
≈ 2 × 10
−7
s
−1
. (5.25)
Introducing a dimensionless temperature,
Θ=
T −T
0
ΔT
, (5.26)
Equation 5.22 becomes
∂Θ
∂t
= α
∂
2
Θ
∂z
2
(5.27)
with boundary conditions
Θ=cosωt, z =0, (5.28)
Θ=0,z= ∞. (5.29)
Equation 5.27 can be resolved much easier in complex numbers using the Euler relation
e
ix
=cosx + i sin x,orcosx =Re[e
ix
]. The boundary conditions now become
Θ=Re
e
−iωt
,z=0, (5.30)
Θ=0,z= ∞, (5.31)
and Eq. 5.27 can be resolved using the Ansatz,
Θ=Re
e
λz−iωt
. (5.32)
Obviously, the suggested solution (Eq. 5.32), satisfies the boundary condition at z =0
(Eq. 5.30). The constant λ can be determined by the differential equation Eq. 5.27.
In fact, it gives
αλ
2
= −iω. (5.33)
There are two solutions to Eq. 5.33,
λ = ±
ω
2α
− i
ω
2α
. (5.34)
i
i
“ChenSolarEnergy” — 2011/5/17 — 17:56 — page 116 — #143
i
i
i
i
i
i
116 Interaction of Sunlight with Earth
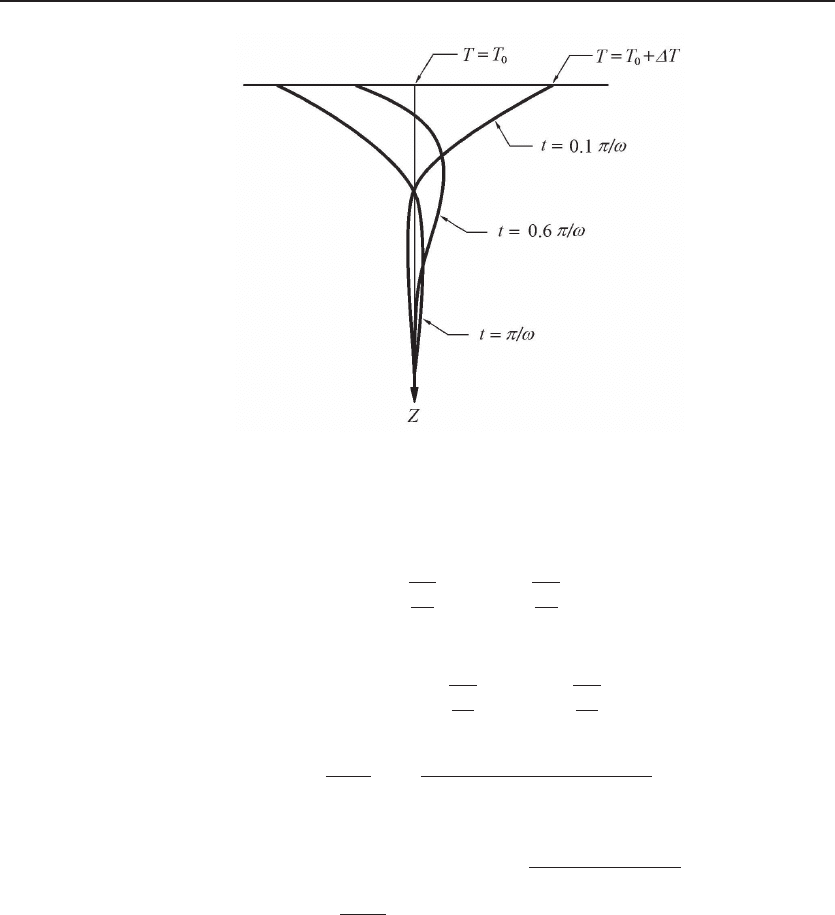
Figure 5.9 Penetration of solar energy into Earth. On the ground, the average temperature is
T
0
, and the amplitude of annual temperature variation is ΔT . The heat penetrates into the ground
with a time delay. At a certain depth, the profile of annual temperature variation is reversed.
Because of the boundary condition at z = ∞, only the negative sign is admissible.
Finally,
Θ=exp
−
ω
2α
z
cos
ω
2α
z − ωt
. (5.35)
Or, using Eq. 5.26, the solution is
T = T
0
+ΔT exp
−
ω
2α
z
cos
ω
2α
z − ωt
. (5.36)
For a numerical example, we use T
0
=15
◦
C, ΔT =12
◦
C, and limestone. From Eq. 5.25
and Table 5.2, one finds
ω/2α =
2 × 10
−7
/2 × 0.626 × 10
−6
≈ 0.33 m
−1
. Taking
the number of the month as a parameter,
T =15
◦
+12
◦
e
−0.33 z
cos
0.33 z −
2π × (month − 7)
12
. (5.37)
At a distance z where
ω/2α = π, the value of the cosine function becomes its
negative. For example, according to Eq. 5.37, when 0.33z = π,orz =9.5m,the
tempeture in the summer is the lowest and the temperature in the winter is the highest.
The profile of the annual temperature variation is reversed; see Fig. 5.9. Therefore,
the stored solar energy can be effectively utilized. We will discuss the details of its
implementation in chapter 6.

i
i
“ChenSolarEnergy” — 2011/5/17 — 17:56 — page 117 — #144
i
i
i
i
i
i
Problems
5.1. Modeling the Sun as a blackbody radiator of T
= 5800 K, calculate Earth’s sur-
face temperature T
⊕
, assuming that the temperature is uniform over its entire surface
which is also a blackbody radiator.
5.2. As in the previous problem, assume the Sun as a blackbody radiator of T
=
5800 K. If the absorptivity of Earth is 0.65 over the entire spectral range and its entire
surface, what is Earth’s surface temperature T
⊕
?
5.3. By direct substitution, prove that
u(z,t)=
A
√
t
exp
−z
2
4αt
(5.38)
is a solution of the one-dimensional heat conduction equation
∂u
∂t
= α
∂
2
u
∂z
2
. (5.39)
5.4. Because the heat conduction equation is linear, if u(z, t) is a solution, then the
infinite integral of u(z, t) is also a solution. Prove that
u(z, t)=A erf
z
2
√
αt
(5.40)
is a solution of Eq. 5.39, where the error function erf(x) is defined as
erf(x)=
2
(π)
x
0
e
−ξ
2
dξ. (5.41)
5.5. If the surface temperature of Earth suddenly changes from 0
◦
CtoT
0
,howlong
does it take for the interior of Earth to be in equilibrium with its surface, which means
it reaches 99% of the surface temperature? Make estimates for depths of 10 m, 100 m,
and 1000 m, where the ground is made of granite.
5.6. Using the theory of solar energy penetration into Earth, determine the effect of
the average daily variation of earth temperature. Assume that the amplitude of daily
temperature is ΔT =5
◦
C and the ground is made of limestone:
1. At what depth the phase of temperature profile is reversed (i.e., cooler at about
3pm and warmer at about 3am)?
2. What is the ratio of the amplitude of temperature variation at the depth of
temperature profile reversal versus the temperature amplitude at the surface?
5.7. The average temperature of Oklahoma City is 28
◦
CinJulyand4
◦
C in January.
The temperature profile is approximately a sinusoidal curve during the entire year. If
the ground is made of granite, what is the monthly temperature variation (list the
values for each month) 10 m beneath the ground?
Problems 117
i
i
“ChenSolarEnergy” — 2011/5/17 — 17:56 — page 119 — #146
i
i
i
i
i
i
Chapter 6
Thermodynamics of Solar Energy
Thermodynamics is a branch of physics devoted to the study of energy and its trans-
formation. It was established in the eighteenth and nineteenth centuries in attempts to
better understand the underlying principles of heat engine, which converts heat energy
to mechanical energy, such as the steam engine and the internal combustion engine. In
the middle of nineteenth century, thermodynamics evolved into a logically consistent
system starting with a few axioms, or laws, from which the entire theory could be
deduced. In the twentieth century, the theory was extended to refrigeration and heat
pumps as well as other forms of energy, such as electric, magnetic, elastic, chemical,
electrochemical, and nuclear. At the core is the first law of thermodynamics regarding
the conservation of energy and the second law of thermodynamics regarding the conver-
sion of thermal energy to other forms of energy. In many textbooks of thermodynamics,
there is also a zeroth law and a third law. The zeroth law is a self-evident definition
of temperature. The third law has limited applications, most of which are unrelated
to the study of solar energy. The theory of thermodynamics is macroscopic in nature,
dealing directly with measurable physical quantities. The corresponding microscopic
theory is statistical physics, where the laws of thermodynamics are derived from an
atomic point of view.
In this chapter, we will present the basic concepts of thermodynamics that are essen-
tial for the understanding of solar energy. Complete presentations of thermodynamics,
including the details of the third law of thermodynamics, can be found in standard
textbooks.
6.1 Definitions
In this section, we introduce several basic definitions. The object of investigation by
thermodynamics is called a system. A typical system is a uniform body of substance
with a well-defined boundary, such as a piece of solid, a volume of liquid, a package of
gas, and a surface layer. The physical objects outside the system boundary are called
the surroundings. A state of a system represents the totality of its macroscopic prop-
erties. Two types of physical quantities are present in thermodynamics: the extensive
quantity and the intensive quantity. An extensive quantity is proportional to the vol-
ume or mass of the system and is additive, such as mass, volume, energy, and entropy.
119
Physics of Solar Energy C. Julian Chen
Copyright © 2011 John Wiley & Sons, Inc.

i
i
“ChenSolarEnergy” — 2011/5/17 — 17:56 — page 120 — #147
i
i
i
i
i
i
120 Thermodynamics of Solar Energy
Intensive quantities are independent of the volume or mass of the system and are not
additive, such as temperature, density, pressure, and the specific values of the extensive
quantities such as energy density. A thermodynamic system can be connected to the
surroundings or isolated. There is no heat or work exchange between an isolated system
and its surroundings. The state of a system can go through a process where at least
one of the physical quantities is changing over time. Two processes are of particular
interest: the isothermal process, where the temperature of the system does not change,
and the adiabatic process, where there is no heat change between the system and its
surroundings.
An infinitesimal quantity of work, dW , is defined as the product of the force F
acting on the boundary of the system and the length dL it moves in the direction of
the force. Because the force F is a product of pressure P and area A, it is convenient
to write work as
dW = FdL= PAdL = PdV, (6.1)
where dV is the infinitesimal change of the volume of the system. The occurrence of
the negative sign is because, when the pressure is positive, the force is pointing to the
inside of the system. When the system expands under a positive pressure, it does work
to the surroundings. The total work during a process from state 1 to state 2 is then
W =
2
1
FdL=
2
1
PdV. (6.2)
Heat is defined as the energy transferred to the system across the boundary without
moving the surface. If the temperature of the surroundings is higher than that of the
system, the heat is transferred to the system, which is denoted as positive. Similarly,
the total heat transferred to the system during a process from state 1 to state 2 is
Q =
2
1
dQ. (6.3)
Temperature is defined by the zeroth law of thermodynamics, which asserts as fol-
lows:
When two systems are in thermodynamic equilibrium with a third system,
the two systems are in thermodynamic equilibrium with each other, and all
three systems have the same temperature.
The zeroth law tells us how to compare temperature, but it does not define the scale
of temperature. In thermodynamics, there are two independent definitions of temper-
ature. The first one is defined by Lord Kelvin based on the Carnot cycle, which bears
his name; (see Section 2.3.2). The second definition is based on the properties of ideal
gas; (see Section 2.5.1). The two definitions are equivalent within a constant multiplier.

i
i
“ChenSolarEnergy” — 2011/5/17 — 17:56 — page 121 — #148
i
i
i
i
i
i
6.2 First Law of Thermodynamics 121
6.2 First Law of Thermodynamics
The first law of thermodynamics asserts that energy can be converted from one form to
another but can never be created or annihilated. A succinct presentation is as follows:
It is impossible to build a perpetual motion that generates energy from noth-
ing.
The first law of thermodynamics is by no means trivial, regarding the fact that each
year, numerous patent applications on perpetual motion are still received by the patent
offices of countries all over the world, even in the era of high technology. Searching on
Google for “perpetual motion”, you would be surprised by the exotic new designs of
perpetual motion proposed by overambitious inventors.
In his autobiography, Max Planck described how his physics teacher taught him
about the concept of energy: A construction worker lifted a brick and put it at the top
of the building. His work increased the energy of the brick. But the increase of energy
was in the form of potential energy and not explicit. One day, the brick fell down from
the top. As it almost reached the ground, the brick moved fast, which had an explicit
kinetic energy. Finally, the brick hit the ground and converted the energy to heat. In
the first step, the construction worker did the work as
W = fh = mgh, (6.4)
where m is the mass of the brick and g =9.81m/s
2
is the gravitational acceleration. The
gravitational force f = mg.Andh is the height, or the distance along the direction of
force the brick moves. The increase of potential energy ΔE equals the work performed
on the system,
ΔE = W = mgh. (6.5)
Just before the brick hit the ground, its velocity v is given as
v =
2gh, (6.6)
which satisfies the law of conservation of energy,
ΔE =
1
2
mv
2
= mgh. (6.7)
The unit of energy is the product of the unit of force, the newton, and the unit
of length, the meter. The unit of energy, newton-meter, or joule, is named after En-
glish physicist James Prescott Joule, who did the first experiment to demonstrate the
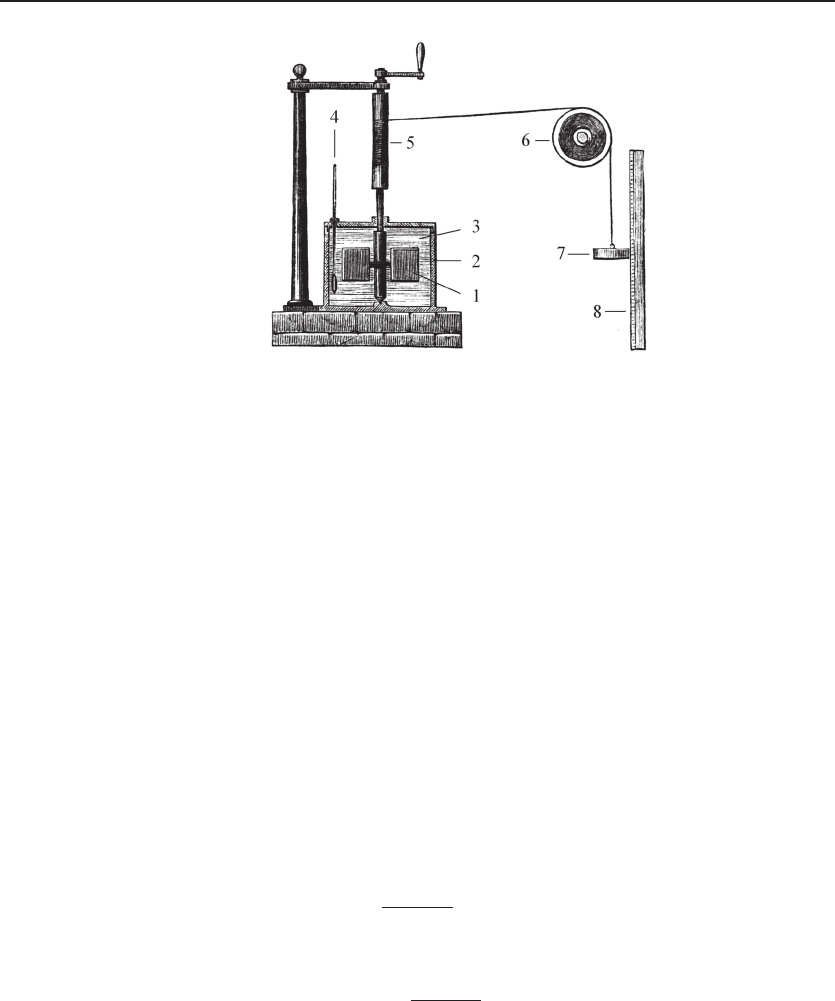
equivalence of mechanical work and heat in 1844. A schematic of Joule’s experiment is
shown in Fig. 6.1.
In Joule’s experiment, at the beginning, the weight is positioned at a predetermined
distance from its equilibrium position. The initial temperature of the water, T
0
,is
measured. Then, by setting the weight to move and waiting to the end of motion,
i
i
“ChenSolarEnergy” — 2011/5/17 — 17:56 — page 122 — #149
i
i
i
i
i
i
122 Thermodynamics of Solar Energy
Figure 6.1 Joule’s experiment. A paddle-wheel 1 is placed inside an insulated barrel 2 filled with
water 3. The temperature is measured by a thermometer 4. The wheel is driven through a spindle 5
and a pulley 6 by a falling weight 7. The height of the weight is measured by the ruler 8. After setting
the paddle-wheel to move, the mechanical energy is transformed into heat, which is measured by the
thermometer.
the final temperature of the water barrel, T
1
, is measured. The heat generated by
mechanical disturbance is
Q =(T
1
− T
0
)M. (6.8)
If M is the mass of water in grams, then the heat Q is in calories. The mechanical
equivalence of one calorie of heat found by Joule is 4.159 J/cal, very close to the result
of modern measurements. As a result of the equivalence of mechanical work and heat,
the increment of the energy of a system is the sum of mechanical work and heat,
ΔE = W + Q. (6.9)
Energy could transfer as heat as well. By pushing two systems with heat capacity C
1
and C
2
at temperatures T
1
and T
2
into contact, as shown in Fig. 6.5, heat transfers from
the hotter system to the cooler system. Assuming that the thermal capacities of the
two systems are constant, that is, independent of temperature within the temperature
range of interest, eventually, the temperature becomes a single value T
0
,
T
0
=
1
C
1
+ C
2
(C
1
T
1
+ C
2
T
2
). (6.10)
The heat transferred from one system to another is
Q = ±
C
1
C
2
C
1
+ C
2
(T
1
+ T
2
). (6.11)
In Joule’s experiment, mechanical work transforms into heat. However, there no
simple way to transform heat back to mechanical work. In the case of heat transfer,