Czichos H., Saito T., Smith L.E. (Eds.) Handbook of Metrology and Testing
Подождите немного. Документ загружается.


388 Part C Materials Properties Measurement
Principle. The total measured compliance C
T
is the sum
of contact compliance C
s
and the machine compliance
C
f
thus
C
T
=C
s
+C
f
, (7.35)
where C
T
is derived from the derivative of the (uncor-
rected) test force removal curve at maximum force
C
T
=
dF
dh
−1
(7.36)
and C
s
is the contact compliance of the specimen ma-
terial
C
s
=
√
π
2E
r
·
1
√
A
P
(h
c
)
(7.37)
with
1
E
r
=
1 −ν
s
E
IT
+
1 −ν
i
E
i
(7.38)
and
h
c
= h
max
−ε F
max
C
T
, (7.39)
where E
i
and ν
i
are, respectively, the Young’s modulus
and the Poisson number of the indenter.
Thus the total compliance is
C
T
=C
f
+
√
π
2E
r
1
A
p
(h
c
)
. (7.40)
If it can be assumed that the elastic modulus is con-
stant and independent of indentation depth, a plot of C
T
versus A
−1/2
is linear for a given material and the in-
tercept of the plot is a direct measure of the machine
load-frame compliance. The best values of C
f
are ob-
tained when the second term on the right-hand side
of (7.39) is small, i. e., for large indentations. In addi-
tion, the largest indentations are advantageous to find
area function. A perfect modified Berkovich indenter,
for instance
A(h
c
) =24.5h
2
c
(7.41)
can be used to provide a first estimate of the contact
area. Initial estimations of C
f
and E
r
are thus obtained
by plotting C
T
versus A
−1/2
for the two largest indenta-
tions in the reference block. Using these values, contact
areas are computed for all, at least six, indentation sizes
by rewriting (7.39)as
A
P
=
π
4
1
E
2
r
1
(C −C
f
)
2
, (7.42)
from which an initial guess at the area function is made
by fitting A
p
versus h
c
data to the relationship
A(h
c
)
P
=24.5h
2
c
+C
1
h
1
c
+C
2
h
1/2
c
+C
3
h
1/4
c
+···+C
8
h
1/128
c
, (7.43)
where C
1
–C
8
are constants. The lead term describes
a perfect modified Berkovich indenter; the others de-
scribe deviations from the Berkovich geometry due to
blunting of the tip.
The procedure is not complete at this stage because
the exact form of the area function influences the values
of C
f
and E
r
, so using the new area function the pro-
cedure shall be applied again and iterated several times
until convergence is achieved.
7.4 Strength
The strength of materials is influenced by the strain
rate, temperature, loading manner and chemical envi-
ronment. The conventional test for the examination of
the strength of materials is tension testing with a slow
strain rate of around 10
−3
s
−1
at room temperature.
Tensile properties obtained using this test are widely
used in engineering practices such as mechanical de-
sign, fabrication and maintenance of products. In the
case of brittle materials, compression or bending tests
are frequently used to examine their strength. These
tests are done under so-called quasistatic-loading con-
ditions. Tests at very slow strain rates are performed
to examine creep or stress–relaxation behavior. To con-
sider automobile collision, earthquakes etc., strength at
a high strain rate such as 10
3
s
−1
is required; impact
or high-speed deformation testing, such as a Hopkinson
pressure-bar test, is employed. Resistance to fracture
under cyclic loading is called fatigue strength. Strength
is also influenced by temperature as well as the envi-
ronment accompanied by chemical reactions such as
corrosion, or radiation damage. Fracture is frequently
found to occur under combined conditions of stress,
microstructural change and chemical reaction. In some
cases, high-temperature strength or low-temperature
toughness are of importance for engineering application
of materials, so that the meaning of the strength of ma-
terials is not unique but depends on the conditions of
their use.
Part C 7.4
Mechanical Properties 7.4 Strength 389
7.4.1 Quasistatic Loading
Strength
According to their loading speed, tests are classified
as quasistatic (or simply static) or dynamic. The most
common quasistatic measurement of the strength of ma-
terials is tension testing. The strength of a material has
three different meanings, which it is important not to
confuse. First, when the applied load is small, defor-
mation is reversible, that is, elastic deformation occurs.
Stresses are proportional to elastic strains and the so-
called Hooke’s law holds. The slope between tensile
stress and tensile elastic strain is called the Young’s
modulus, as was explain in Sect. 7.1. A material with
high Young’s modulus is strong, or rigid to elastic de-
formation. Secondly, when the applied stress becomes
higher, materials usually show plastic deformation. The
stress at the onset of plastic flow is called the yield
strength, which has no direct relation with the Young’s
modulus. The yield strength indicates resistance against
plastic flow. In the case of engineering materials, it is
necessary to define how to determine the yield strength
for mechanical design. Usually, 0.2% proof stress or
lower yield strength is employed. Thirdly, materials
show fracture under applied stress. Since there are many
fracture mechanisms, the strength against fracture is dif-
ferent from the yield strength. Ductile materials show
workhardening with plastic deformation and plastic in-
stability, i. e., necking in the case of tension, resulting in
dimple fracture. Frequently fracture occurs after a con-
siderable amount of plastic flow, but fracture takes place
with little or no plastic deformation. This is called brit-
tle fracture, so that the resistance to brittle fracture is
another aspect of strength. Fracture is also strongly de-
pendent on the chemical environment.
Tension Test
This test is usually performed at room temperature with
a strain rate of 10
−4
–10
−1
s
−1
. The testing procedure
and the shape and dimensions of a tensile specimen
should be taken from the ISO or other related standards,
depending on the materials and products under consid-
eration. The loading speed, or extending speed, should
be controlled within the above strain-rate range us-
ing a gear-driven type or servo-hydrostatic-type tester.
During testing, the applied load and displacement of
a gage length of a tensile specimen should be recorded.
Then, the load–displacement diagram can be obtained.
The curve is converted to a nominal stress–strain curve
and sometimes further to a true stress–strain curve.
Typical tensile properties such as the yield strength,
tensile strength, uniform elongation, total elongation,
workhardening exponent (n-value), r-value etc., can be
obtained from the results of the tension test.
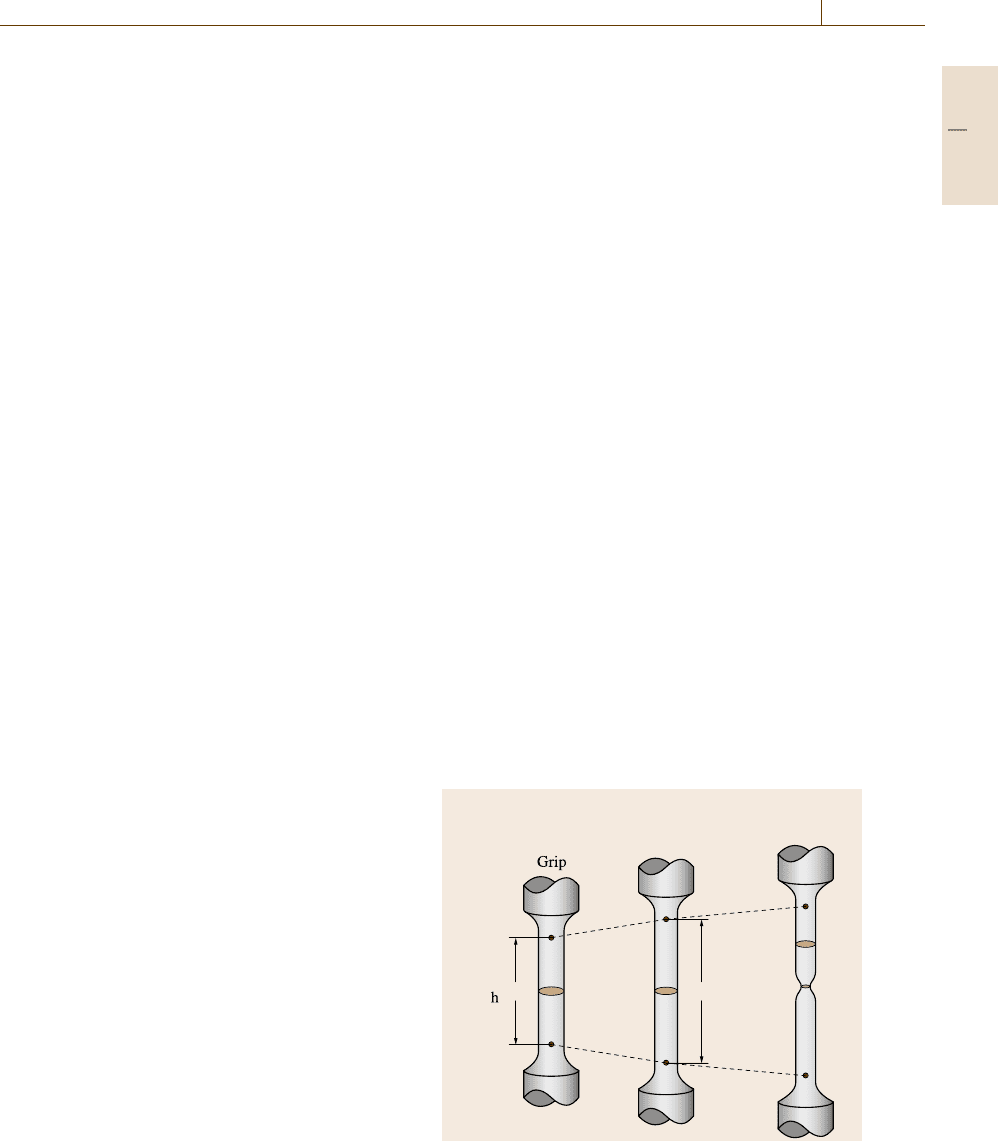
Stress–Strain Curves of Ductile Materials
An example of the standard tension specimens is shown
in Fig. 7.37. Depending on the purpose, a strain gage or
extensometer is attached to monitor the change in gage
length (ΔL), while the load (F) is measured simultane-
ously with a load cell. Based on the initial area (A
0
)and
gage length (L
0
), the nominal stress (σ ) and nominal
strain (ε) are obtained by the following equations
σ = F/A
0
, (7.44)
ε =ΔL/L
0
. (7.45)
Here, the units for F and ε are Pa (= N/m
2
)andm/m
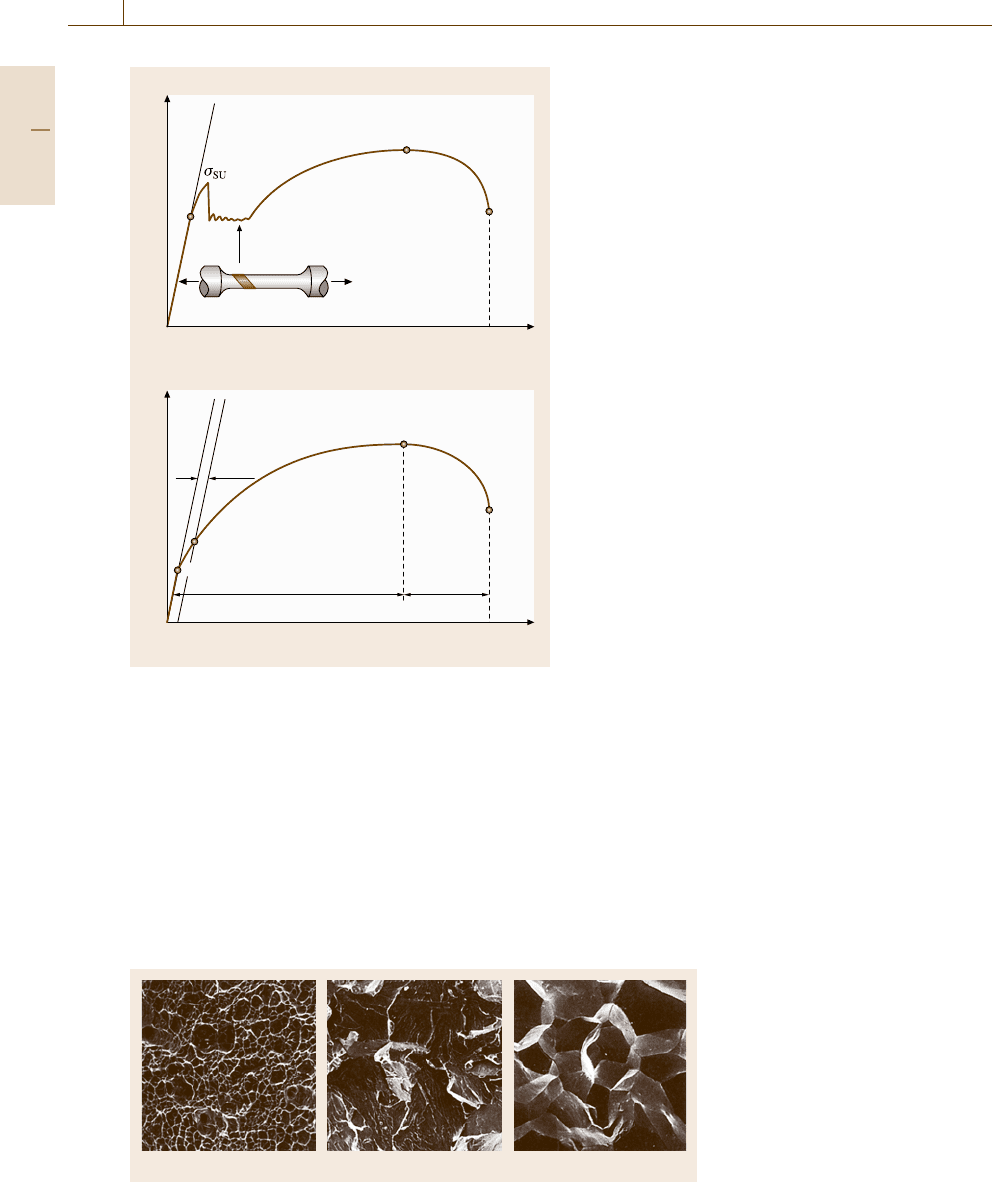
(nondimensional), respectively. In Fig. 7.38, two typical
examples of nominal stress–strain curves are presented;
one shows the case of discontinuous yielding (a) and
the other shows continuous yielding (b). Most metals
and alloys show the type of yielding shown in (b). How-
ever, annealed mild steels, which are widely used, show
the type shown in (a). As can be seen, these curves are
divided into three regions.
1. A linear elastic region at the beginning, where stress
is proportional to strain and the deformation is re-
versible.
2. After the onset of plastic flow, the curve devi-
ates from the elastic line. The flow stress increases
with increasing strain, meaning that the material is
strengthened by plastic deformation; this is called
Before test
Gauge
length
Uniform
deformation
Local
deformation
L
0
A
0
A
f
ALNecking
Grip
a) b) c)
Fig. 7.37a–c Tension specimen and macroscopic tensile
deformation behavior
Part C 7.4
390 Part C Materials Properties Measurement
Nominal stress
Nominal stress
Nominal strain
Nominal strain
Elastic line
Elastic line
Luders band
Uniform elongation
Local
elongation
σ
P
σ
B
σ
F
σ
F
σ
B
σ
0.2
σ
P
σ
SL
δ
δ
0.2%
a)
b)
Fig. 7.38a,b Nominal stress–strain curves: (a) discontinu-
ous yielding and (b) continuous yielding
workhardening. When unloaded, only the elastic
strain is recovered but a permanent deformation,
i. e., plastic strain, remains. In this region, uni-
form plastic deformation occurs. For plastic strains,
the condition of constant volume is often assumed
(Fig. 7.37b[7.206]).
3. After reaching the maximum stress, which is called
the ultimate tensile strength (UTS) or simply the
tensile strength (TS), a lower stress is enough to
a) b) c)
20 µm 200 µm 200 µm
Fig. 7.39a–c Fracture surface:
(a) dimple, (b) cleavage and
(c) intergranular fracture
continue to deform the material plastically because
necking occurs (Fig. 7.37c). After the onset of neck-
ing, deformation is localized to a necked region in
which the stress condition is no longer uniaxial but
is triaxial. Microvoids form inside the necked re-
gion, grow, connect to each other and lead to slip-off
of the remaining, outside ring region. Thus, the view
after fracture looks like a cup and a cone and hence
is called cup-and-cone fracture. This phenomenon
is typical of ductile fracture. The inner, flat area con-
sists of dimples; the dimple pattern observed on the
fracture surface is shown in Fig. 7.39a.
4. When a material is brittle, as is the case for ce-
ramics, necking is not observed and the flow curve
stops suddenly at the fracture stress, often within
the elastic regime. In such a case, the fracture sur-
face consists of cleavage or transgranular facets.
Examples of the fracture surface are presented in
Fig. 7.39band7.39c,
True Stress–Strain Curves
and the Workhardening Exponent (n-Value)
Within the uniformly elongated regime in Fig. 7.38,the
assumption of constant volume for plastic strains holds
approximately. This means that the cross section in the
gage volume in Fig. 7.37 decreases with increasing ten-
sile strain. Hence, the area (A) to support the applied
stress decreases with deformation so that the stress per
unit area is given by
σ
∗
= F/A (7.46)
instead of (7.44); σ
∗
is called the true stress. Similarly
to σ
∗
, the gage length l
0
changes continuously with
deformation. Then, the true strain (ε
∗
)isdefinedby
ε
∗
=
l
l
0
dl/l =ln(l/l
0
) . (7.47)
One of the merits of using ε
∗
is its additive nature.
For instance, when a length changes from L
A
to L
B
,
Part C 7.4
Mechanical Properties 7.4 Strength 391
R
a
σ
3
σ
3
σ
2
σ
1
Fig. 7.40 Stress condition in a necked region in tension
test
and then to L
C
, the true strain from L
A
to L
B
is
ln(L
B
/L
A
) and from L
B
to L
C
is ln(L
C
/L
B
). There-
fore, ln(L
B
/L
A
) +ln(L
C
/L
B
) = ln(L
C
/L
A
) holds. In
contrast, in the case of nominal strain, we have (L
B
−
L
A
)/L
A
+(L
C
−L
B
)/L
B
=(L
C
−L
A
)/L
A
, and hence
this property is not additive. Taking the assumption of
constant volume (A
0
L
0
= AL) we obtain the following
conversion from nominal stress and strain to true stress
and strain. Thus, we find the relation for true stress
versus true strain starting from Fig. 7.38 by using
σ
∗
= F/A
0
=σ(1 +ε) , (7.48)
ε
∗
=ln(L/L
0
) =ln(1 +ε) . (7.49)
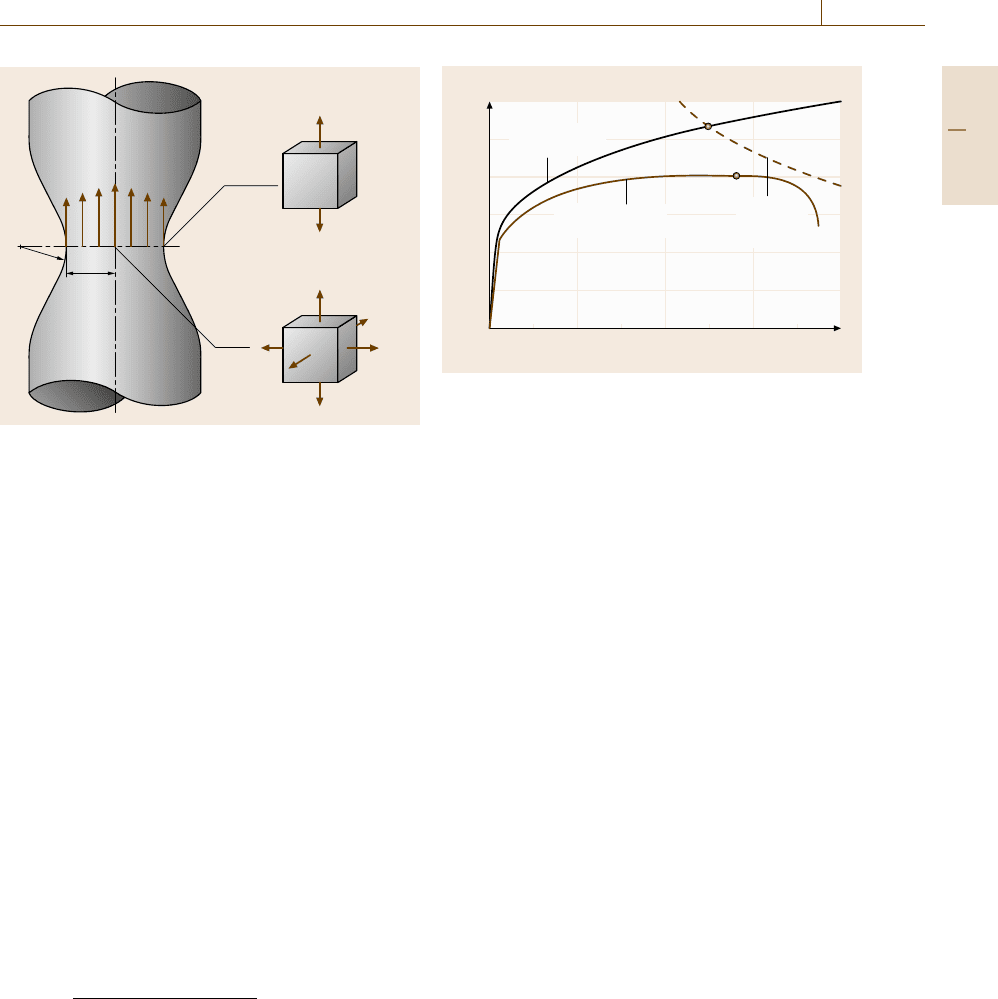
After the onset of necking, the specimen geometry
changes and the stress condition is also altered. As
showninFig.7.37c and Fig. 7.40, the stress condition
in a necked region is not uniform but is a compli-
cated triaxial stress condition. According to Bridgman’s
analysis [7.207], the tensile stress at the surface of the
smallest cross section, σ
0
(Fig. 7.40), is given by
σ
0
=
F/ A
(1 +2R/a)ln(1+a/2R)
, (7.50)
where R and a are given in Fig. 7.40. Microvoids form
in the center of the necked region under triaxial stresses,
as explained above, leading to cup-and-cone fracture.
An example of curves of true stress versus true strain
converted from the nominal stress–strain curve by us-
ing (7.49)and(7.50) is shown in Fig. 7.41. This shows
that workhardening continues even in local deforma-
Nominal stress/true stress (MPa)
Nominal strain/true strain
1200
1000
800
600
400
200
0
0 0.1 0.2 0.3 0.4
True stress/
true strain
Nominal stress/
nominal strain
Work
hardening
rate
Fig. 7.41 True stress–strain curve in which the workhard-
ening rate is plotted to indicate the onset of necking
tion; the necking is caused from the balance between
cross-sectional area reduction and workhardening with
increasing tensile plastic strain. Hence, the crossing
point of the true stress σ
∗
and the workhardening rate
dσ
∗
/dε
∗
shows the onset of necking (Fig. 7.41).
Tensile Properties
Tension testing is simple and gives us lots of useful in-
formation on mechanical properties. So, this test is the
most basic and popular to understand the mechanical
behavior of materials. Several parameters for engineer-
ing use obtained by tension testing are explained below.
Elastic Limit and Proportional Limit
Most mechanical products are designed to be used
within the regime of elastic deformation. The rigor-
ous limit of elastic deformation is determined by the
elastic limit or proportional limit on the stress–strain
curve. The proportional limit is the point of deviation
from the linear relationship between stress and strain.
On the other hand, the elastic limit is found as the max-
imum stress without permanent strain after unloading.
These stresses are very sensitive to the method used to
measure strain. Within the linear stress–strain regime,
as was explained in details in Sect. 7.1, the Young’s
modulus (E) is determined from the slope, while the
Poisson’s ratio (ν) is determined by the absolute ratio
between the transverse strain and tensile strain. When
the tensile direction is taken as the x
3
-axis, these are
determined by
E = σ
33
/ε
33
, (7.51)
ν =
|
ε
11
/ε
33
|
=
|
ε
22
/ε
33
|
.
(7.52)
Part C 7.4

392 Part C Materials Properties Measurement
In the case of steel, E is nearly 200 GPa and ν is ap-
proximately 0.3. The elastic strain in steels is usually
less than 1%, which is very small compared with the
uniform elongation of the order of 10%. We note here
that the constant-volume assumption is not applicable
to elastic deformation.
Yield Strength
Special measurements such as those based on strain
gages are required for the measurement of elastic strains
less than 0.01 so that the yield strength (YS)isde-
termined for mechanical design using the conventional
tensile test. In the case of discontinuous yielding ob-
served in mild steel, as shown in Fig. 7.38a, the upper or
lower yield point is observed on the stress–strain curve
and used as the yield strength in engineering. After the
upper yield point, a plastic-deformation regime called
the Luders band appears and spreads within the speci-
men gage volume under the lower yield stress. Since the
upper yield strength is strongly dependent on the ten-
sile speed, i. e., the strain rate, the lower yield strength
is more popularly used. The strain during this hetero-
geneous deformation is called the Luders elongation,
which is also dependent on grain size.
On the other hand, Fig. 7.38b shows the case of
continuous yielding, which is observed in many met-
als and alloys such as aluminum, austenitic stainless
steel etc. 0.2% proof stress is usually employed, which
means a plastic (permanent) strain of 0.2% remains af-
ter unloading. Usually the elastic linear line is shifted by
0.2% and the intersection with the stress–strain curve is
found. Macroscopic yielding can be observed to take
place at this point. Although 0.2% strain is the choice
for engineering, other strains, for instance 0.1%, are
employed in other industrial fields.
Tensile Strength
The maximum stress appearing in Fig. 7.38 is deter-
mined by the tensile strength (TS), frequently called the
ultimate tensile strength (UTS). In the case of an ex-
treme design that allows plastic flow, TS is employed as
the design strength.
Ductility
Parameters to describe the ductility includes uniform
elongation, total elongation and reduction in area af-
ter fracture. Uniform elongation is important for plastic
forming etc. and is determined as the strain at the tensile
strength. After the tensile strength, local deformation,
i. e. necking, starts. The total strain is given as the strain
to fracture in Fig. 7.41. It should be noted that the to-
tal elongation is dependent on the gage length adopted.
Therefore, fracture strain (ε
f
) is sometimes used, which
is defined as ln(A
0
/A
f
), where A
f
refers to the smallest
area in the necked region after fracture. Conventionally,
the reduction in area (ϕ)definedby[(A
0
− A
f
)/A
0
]×
100% is used. The extreme case observed in a pure
metal is a point fracture, where A
f
=0.
Workhardening Exponent (n-Value)
The true stress–strain curve shown in Fig. 7.41 is often
fitted by using the following Hollomon’s equation
σ
∗
= K(ε
∗
)
n
, (7.53)
where K and n stand for the strengthening factor
and the workhardening exponent (n-value), respec-
tively. By taking two measuring points or by using
the least-squares method for ln σ
∗
versus ln ε
∗
within
an appropriate strain regime, these K and n values
are determined. The n-value is important because it is
equivalent with uniform elongation. The plastic insta-
bility condition, i. e., the onset of necking can be given
by
dF = σ
∗
dA + A dσ
∗
=0 , (7.54)
where F is the applied tensile load. This equation
is rewritten by σ
∗
= dσ
∗
/dε
∗
under the assumption
of constant volume and therefore ε
∗
= n is obtained.
Alargen-value means excellent plastic formability.
Rankford Value (Plastic Anisotropy: r-Value)
Another parameter that indicates the plastic formability,
and which is also obtained by the tension test for sheet
metals and alloys, is the r-value. When tensile strain
reaches 10–20%, the strain for a thickness of ε
t
and the
strain for a width of ε
w
are measured and the r-value is
determined by
r =ε
w
/ε
t
. (7.55)
If the assumption of constant volume is used, this be-
comes
r =ln(W
0
/W)/ ln(LW/L
0
W
0
) , (7.56)
where W
0
, L
0
and W, L refer to the width and gage
length in the tensile direction before and after the ten-
sion test, respectively. These values are much more eas-
ily measured precisely than the thickness because most
cases use thin sheets. In an isotropic material, the r-value
equals unity. Commercially available materials gener-
ally show anisotropic feature in plastic flow because of
their texture. Materials with high r-values are desirable
Part C 7.4
Mechanical Properties 7.4 Strength 393
for heavy drawing because the thickness change is small.
To achieve this, texture control is important.
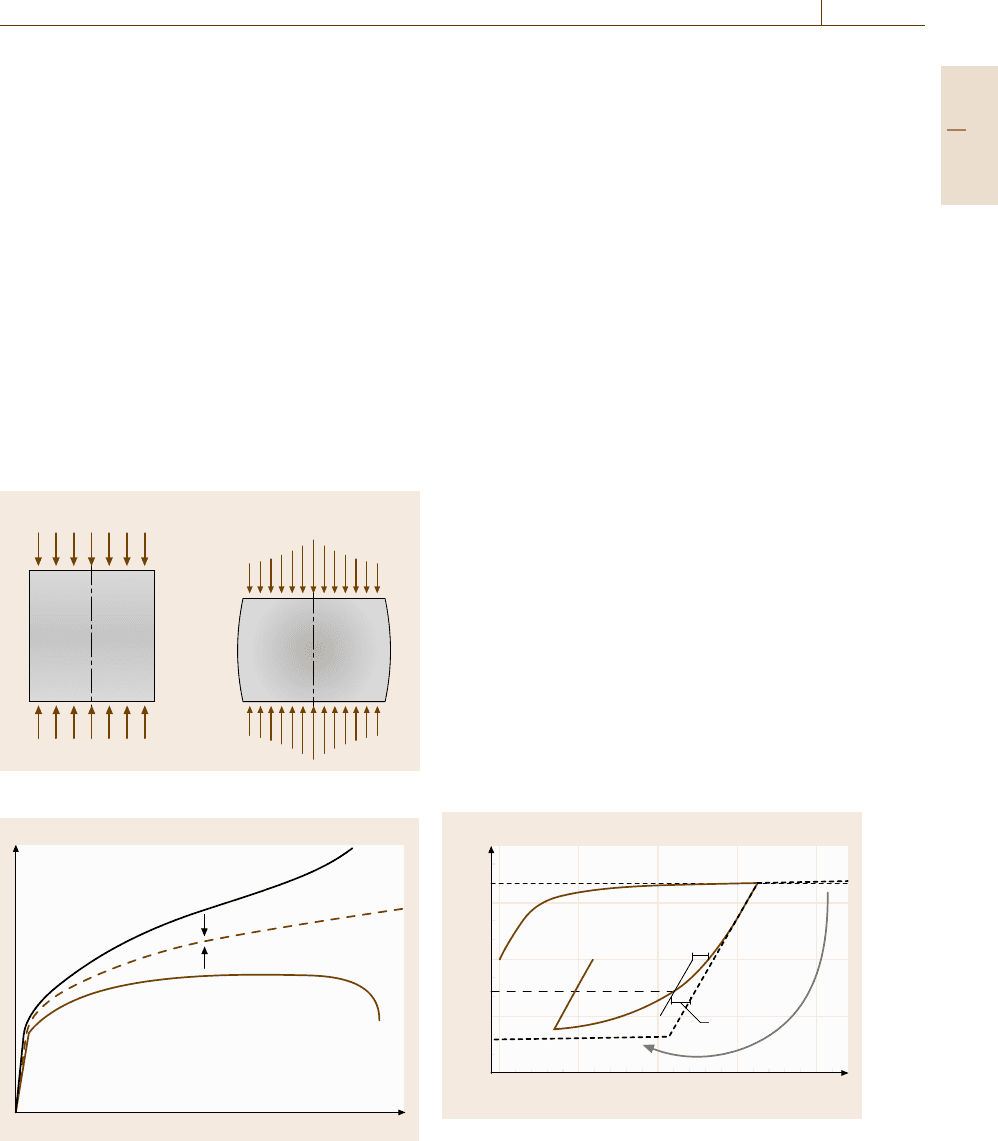
The Compression Test
The compression test looks like the reverse of the ten-
sion test, but more skill is required to obtain reliable
stress–strain curves. A schematic illustration of com-
pression of a round column is presented in Fig. 7.42,
where the top and bottom surfaces of the specimen
should be maintained with good parallelism. Friction
between the specimen and the anvil must be mini-
mized using an appropriate lubricant such as graphite or
Mo
2
S powder otherwise bulging, shown in Fig. 7.42b,
becomes serious and leads to constrained deformation.
If the compression alignmanet is not satisfactory with
respect to the specimen axis, buckling or bending oc-
curs easily at small strains. To avoid such buckling,
the length of the specimen should be designed taking
a) b)
σσ
Fig. 7.42a,b Compression test where bulging is illustrated
Nominal stress/true stress
Nominal strain/true strain
True stress/
true strain
Nominal stress/
nominal strain (compression)
Nominal stress/
normal strain (tension)
Fig. 7.43 Compression flow curve compared with that in
tension
the cross-sectional area into consideration. Usually, the
ratio of the diameter of the cross-sectional area d
0
to
the length h
0
is chosen as 1.0–3.0. When the top and
bottom of a specimen are plastically constrained by an
anvil, the stress distribution within the cross section is
not uniform and plastic deformation occurs in an inho-
mogeneous manner within the specimen.
The nominal stress–strain curve obtained by the
compression test is higher than that obtained by the
tension test because the cross-sectional area increases
with deformation. Hence, flow curves measured by the
tension test and the compression test should be com-
pared in terms of true stress–strain curves. If a material
shows isotropic plastic deformation, these two flow
curves (the true stress–strain curves) coincide, as shown
in Fig. 7.43. However, if a material contains phase
or intergranular residual stress, so-called second-type
residual stresses, the yield strength will differ between
compression and tension, which is called the strength
difference (SD) effect. The SD effect is also caused
by crystallographic features in plastic flow or stress-
induced martensitic transformations.
In general, the flow stress (true stress) in compres-
sion after some amount of tensile plastic deformation
is smaller than that for continuous tension, as shown
in Fig. 7.44. This is called the Bauschinger effect (BE).
As seen in Fig. 7.44, the magnitude of the BE is of-
ten expressed by the BE stress or BE strain (Fig. 7.44).
Generally speaking, the flow stress becomes smaller
when the strain path changes, even under biaxial or
triaxial stresses. In a stress space (the general stress
condition is described by six components, as will be
described later), the yield condition is shown using
True stress (MPa)
600
300
0
–300
–600
0 0.005 0.01 0.015 0.02
True strain
Tension
Tension Redrawing
Compression
0.001
0.5σ
P
σ
P
σ
R
β
0.5
Fig. 7.44 Tension-compression test to examine the Bau-
schinger effect (BE) in which the parameters of BE stress
(σ
P
−σ
R
)andBE strain β
0.5
are defined
Part C 7.4
394 Part C Materials Properties Measurement
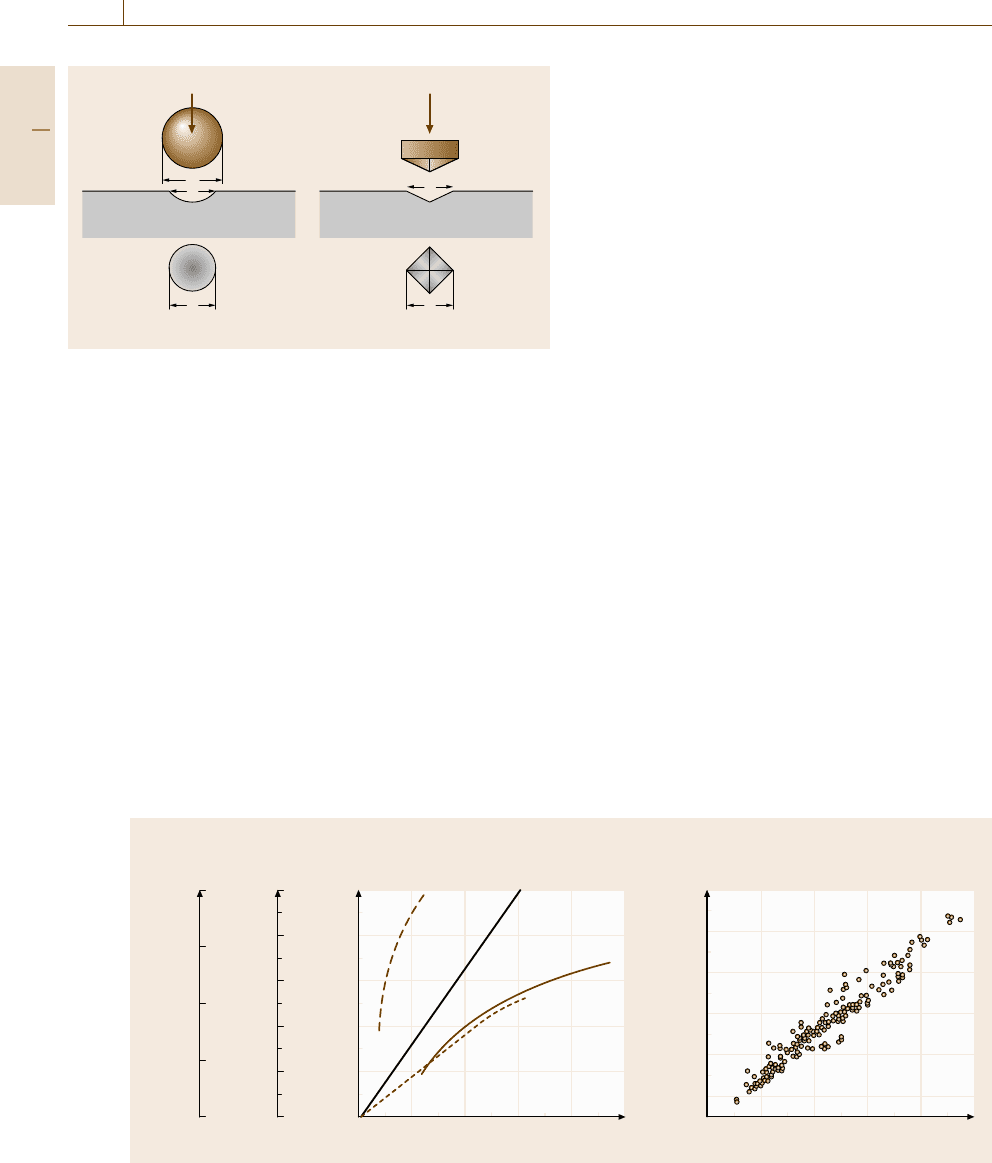
a) b)
Brinell test
Cross section
of specimen
Cross section
of specimen
Vickers test
FF
D
d
d
d
Specimen surface
d
Specimen surface
Fig. 7.45a,b Hardness tests by indenting deformation
the yielding surface. When a material is plastically
deformed and thus workhardened, the yielding stress
surface expands and moves in the stress space. Hence,
the yield strength after plastic deformation depends on
the loading conditions. Typical cases are: (1) isotropic
hardening, where the yield surface expands homoge-
neously, and (2) kinematic hardening, where the surface
moves without changing its shape and size. The BE is
important in order to understand plastic forming, which
is used to make mechanical parts. In addition, the BE
behavior is closely related to low-cycle fatigue behavior.
In the case of brittle materials such as concrete, in which
the SD effect for fracture is remarkable, the compressive
fracture strength is much higher than the tensile value.
Hardness Test and Strength/Hardness Relations
In addition to the treatment of hardness measurements
methods given in Sect. 7.3, relations between strength
a)
b)Tensile
strength
(GPa)
Rockwell
hardness
HR
Brinell
hardness
HB
Vickers
hardness
HV
HRB
HRC
HB
Vickers hardness HV 0.2 % proof stress (GPa)
21.61.20.80.40
σ
B
2
1
0
0
20
40
60
80
100
0
0 200 400 600 800 1000
200
400
600
800
1000
1.5
0.5
100
200
300
400
500
600
Fig. 7.46a,b Relationship between hardness and tensile properties
and hardness are briefly considered. The most popu-
lar measurement is a kind of compression test with
an indenter. The indenter is made from a hard mater-
ial such as diamond or high-carbon martensite steel.
As explained above and shown again in Fig. 7.45 an
indenter is pressed on the surface of a testing mater-
ial, and the indentation after unloading is measured.
Since the Vickers hardness test employs a pyramidal
diamond indenter, the applied stress is almost pro-
portional to the area, which means that the Vickers
hardness number is insensitive to the applied load.
As is estimated in Fig. 7.45, the deformation zone is
limited to just underneath of the indenter and is com-
plicated. According to an elasto–plastic analysis, the
representative plastic strain in the plastic zone is about
8%, so that the hardness number should correspond to
8% flow stress in the simple tension or compression
test [7.208, 209]. Figure 7.46 shows the relationship
between the hardness and tensile properties, the yield
strength or tensile strength (8% proof stress is usually
not recorded). Excellent correspondence is found be-
tween the yield or tensile strength and hardness. The
experimental relationship of (7.57) is used to connect
the Vickers hardness number (HV) to the yield or tensile
strength (Y)
HV =cY , (7.57)
where the coefficient c is 2.9–3.0. Therefore, the hard-
ness test is a convenient way to check the strength of
materials, particularly for engineering products.
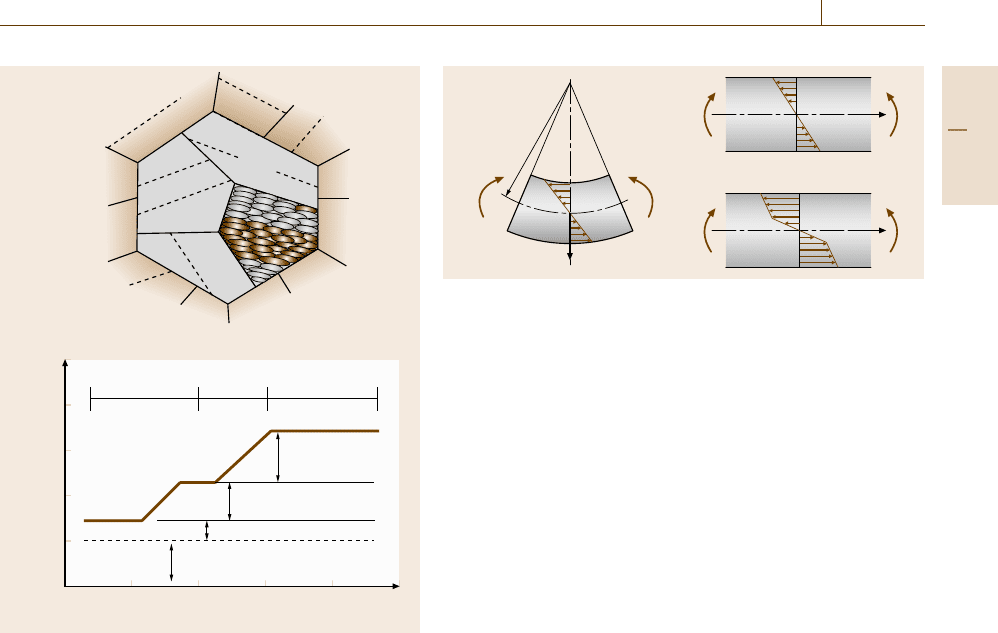
Supplementing the discussion of nanohardness
measurements given in Sect. 7.3.4, strengthening mech-
anisms will be considered briefly. In most cases, the
Part C 7.4
Mechanical Properties 7.4 Strength 395
a)
b)
Vickers hardness HV
500
400
300
200
100
0
10
–2
10
–1
10
0
10
1
10
2
10
3
Square root of contact area (μm
1/2
)
Base hardness
Dislocations hardening
Precipitation hardening
Conventional test
Micro test
Ultra-micro test
Grain (block) size
hardening
Lath
Packet
Block
Fig. 7.47a,b Hardness with various loads to examine the
strengthening mechanism in a tempered martensite steel
shape of a diamond indenter is triangle pyramid because
the tip of square pyramid is difficult to make precisely.
The test is performed under very small loads, such as
a few grams, and is widely used for thin-film or elec-
tronics devices. One of the recent application [7.210]is
summarized in Fig. 7.47, where the hardness was meas-
ured using a wide range of applied loads for a tempered
martensite steel. Because an engineering material shows
multiscale heterogeneous microstructure that brings the
multiscaled heterogeneous plastic deformation. For ex-
ample, the tempered martensite is composed of laths,
blocks and packets as shown in Fig. 7.47a and hence
the strengthening mechanisms due to grain refinement,
dislocation density, carbon solid solution and carbide
precipitation overlap. By examining the hardness with
various loads, using three kinds of hardness testers, the
contribution of individual strengthening mechanism can
be found separately, as illustrated in Fig. 7.47b.
The Bending Test
Schematic illustration of the bending test is presented
in Fig. 7.48. This test is frequently used to measure the
a) b)
c)
MM
M
M
M
M
x
x
y
ρ
Fig. 7.48a–c Bending test: (a) deformation aspect, (b) stress dis-
tribution in elastic deformation and (c) that in elasto–plastic
deformation
strength of brittle materials or the bending formability
of ductile materials. As shown in Fig. 7.48, two kinds
of tests, three- and four-point bending are used. three-
point bending is easy to carry out. However, four-point
bending is preferable because the bending moment M is
then constant in the central part of the specimen. When
a rectangular specimen is bent, as shown in Fig. 7.48a,
strain and stress distribution occurs in the cross sec-
tion, where the upper surface is in compression and
the lower surface is under tension. There exists a neu-
tral stress-free plane, which is denoted by the x-axis. If
the curvature is expressed by ρ, the normal strain under
elastic deformation is given by
ε = y/ρ . (7.58)
The normal stress is proportional to the strain, and
hence we obtain the maximum stress by
σ =6M/(bh
2
) , (7.59)
where b and h refer to the width and thickness of the
specimen, respectively. The stress distribution is shown
in Fig. 7.48b.
After yielding at M = σ
s
bh
2
/6, the stress distribu-
tion changes from Fig. 7.48b–c, where σ
s
stands for the
yield strength. When M is further increased, the bound-
ary between the elastic region and the elasto–plastic
region moves towards the neutral plane. The stress or
strain distribution in the plastic region is dependent on
the workhardening of a material. A schematic illustra-
tion is given in Fig. 7.48c. When the applied moment
is removed, the residual stress distribution remains: ten-
sile stress at the upper surface and compression at the
bottom surface.
The Torsion Test
Shear deformation is related to the combination of bi-
axial deformation of tension and compression. This
Part C 7.4
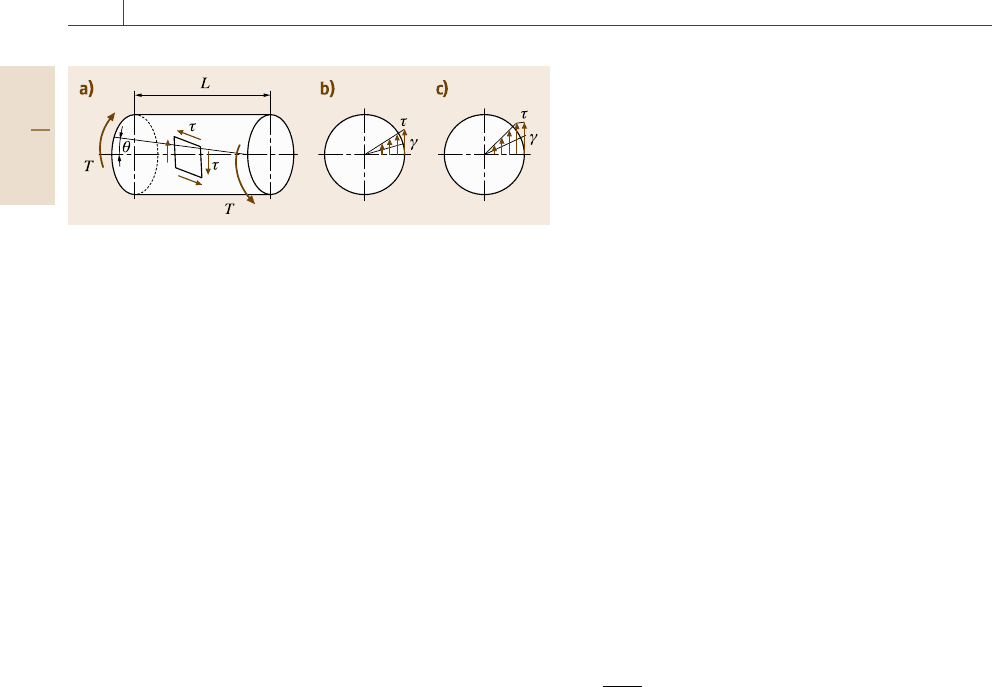
396 Part C Materials Properties Measurement
Fig. 7.49a–c Torsion test: (a) deformation aspect, (b) stress dis-
tribution in elastic deformation and (c) that in elasto–plastic
deformation
conversion is achieved by rotating the coordinate sys-
tem by 45
◦
. In particular, the torsion test is used for
wires and bars. Figure 7.49 shows a schematic illustra-
tion of torsion (a) and the shear stress distribution (b) in
the cross section of a round bar with radius r. The engi-
neering shear strain γ is related to the shearing angle θ
and the bar length L by
γ =rθ/L . (7.60)
Considering the stress equilibrium, the torsion moment
(for torque T )isgivenby
τ =16T/πd
3
, (7.61)
where d refers to the diameter of the round bar speci-
men. Similarly to the bending test depicted in Fig. 7.48,
the stress distribution changes after yielding, as rep-
resented in Fig. 7.49c. Fracture usually takes place
perpendicularly to the specimen axis in ductile frac-
ture while along 45
◦
direction in case of brittle fraction.
In some cases, fracture along the longitudinal direc-
tion occurs, which is called delamination. Delamination
fracture has to be avoided for practical application of
wires.
Yielding Criteria under Multiaxial Stresses
Tension and compression tests are performed with uni-
axial loading. The general stress condition is a triaxial
stress, which is described by six components
⎛
⎜
⎝
σ
11
τ
12
τ
31
τ
12
σ
22
τ
23
τ
31
τ
23
σ
33
⎞
⎟
⎠
.
When a special coordinate related to the principal
stresses, σ
i
(σ
1
,σ
2
,σ
3
) is employed, the shear stress
components all become zero. For instance, in the case of
the tension test along the tensile direction of the x
3
-axis,
the six stress components or three principal stresses are
written as
σ
33
=σ
3
,σ
11
=σ
1
=0 ,σ
22
= σ
2
=0 ,
τ
23
=τ
31
=τ
12
=0 . (7.62)
The yield strength σ
s
is the determined by σ
33
at 0.2%
plastic strain, or the Luders deformation. In the case of
the general stress condition, the stresses are converted
to principal stresses by changing the coordinate system.
For example, in the torsion test, τ =16T/πd
3
and the
other stresses are zero at the surface of a bar speci-
men from (7.61). Rotating the coordinate by 45
◦
gives
σ
1
=−σ
2
=16T/πd
3
and the other stress components
are zero.
Two of the most popular criteria for yielding un-
der general stress conditions are the Tresca and von
Mises criteria. The Tresca criterion is based on the
maximum shear stress theory. When σ
3
>σ
2
>σ
1
,the
maximum shear stress is given by
σ
3
−σ
1
/2. There-
fore, the yielding criterion is written by
|
σ
3
−σ
1
|
=2k , (7.63)
where k is a constant and is given by σ
s
/2 for the tension
test.
On the other hand, the von Mises criterion is based
on the theory of shear strain energy. The shear strain
energy per unit volume is given by
1 +ν
6E
(σ
1
−σ
2
)
2
+(σ
2
−σ
3
)
2
+(σ
3
−σ
1
)
2
.
Using the results of the tension test, the criterion can be
written as
(σ
1
−σ
2
)
2
+(σ
2
−σ
3
)
2
+(σ
3
−σ
1
)
2
=2σ
2
s
.
(7.64)
In general, yielding is found to occur at a stress con-
dition between these two criteria. Hence, the general
stress condition is projected to the case of the tension
test and the equivalent stress is then determined. For
instance, in the case of the von Mises criterion, the
equivalent stress σ
eq
is given by
σ
eq
=
(σ
1
−σ
2
)
2
+(σ
2
−σ
3
)
2
+(σ
3
−σ
1
)
2
1/2
or more generally,
σ
eq
=
(σ
11
−σ
22
)
2
+(σ
22
−σ
33
)
2
+(σ
33
−σ
11
)
2
+6
σ
2
23
+σ
2
31
+σ
2
12
1/2
. (7.65)
Another interpretation of the von Mises criterion is the
maximum shear stress acting on the pyramidal plane in
the principal stress space.
Part C 7.4
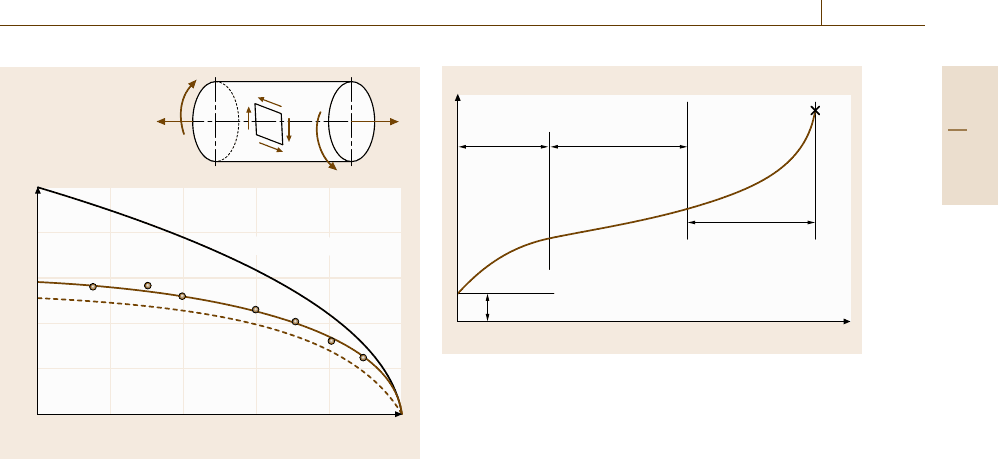
Mechanical Properties 7.4 Strength 397
Torsion τ/σ
s
τ
τ
Tension σ/σ
s
von Mises
Tresca
1
0.8
0.6
0.4
0.2
0
0 0.2 0.4 0.6 0.8 1
T
T
F
F
Maximum stress
Fig. 7.50 Yielding under combined tension and torsion
stresses
A schematic illustration of the yielding surface un-
der combined torsion and tension loads [7.211, 212]
is shown in Fig. 7.50. Such a yielding condition un-
der general stress conditions is given by the yielding
surface in the stress space (six-dimensional or prin-
cipal stress space (three dimension)), which changes
with plastic deformation. This is called workhardening,
which includes isotropic hardening and kinematic hard-
ening. The Baushinger effect in Fig. 7.44 is an example
of kinematic workhardening, as already mentioned.
The Creep Test
Plastic deformation and fracture usually show time
dependence. When an external load is kept constant,
a specimen deforms plastically gradually, which is
called creep deformation. This is clearly observed at
high temperatures (T > 0.3T
m
), where T
m
denotes the
melting temperature of a material. In general, creep de-
formation at constant temperature is divided into three
stages in the creep curve, as shown in Fig. 7.51.
Here, after the initial strain that occurs during load-
ing to a certain fixed stress, plastic strain initially
increases gradually, which is called transient creep. The
rate of increase of the strain in transient creep satu-
rates to a constant rate in the second regime. This is
called steady creep. The third regime, called tertiary
or accelerated creep, leads to the rupture of the spec-
imen. This effect is important, but it is not clear why
and when this acceleration from steady to tertiary creep
takes place. When the external load is small, tertiary
Elongation
Transient
creep
Accelerated
creep
Initial strain
Steady creep
Fracture
Holding time
Fig. 7.51 General creep deformation behavior under con-
stant load and temperature
creep is not observed and hence the specimen does not
fracture.
The experimental methods to examine creep behav-
ior include the constant-stress creep test, the torsion
creep test, the tension-torsion combined test, cyclic
loading creep, and the creep crack-propagation test.
A tester with an electric furnace and a lever-type load-
ing system for a round bar specimen is popular. In
general, creep rupture requires a long time, so that
many testers are used simultaneously. A dial gage
or differential transducer with a high sensitivity is
also required for strain measurement. When the ex-
perimental data obtained at various temperatures are
summarized by employing the following Larson–Miller
parameter,
λ = T(20 +log t
r
)×10
−3
, (7.66)
where t
r
stands for the rupture time, the experimen-
tal data for applied stress (σ) versus t
r
are well sum-
marized by a σ –λ master curve. The master curve
is influenced by strengthening mechanisms such as
solid solution hardening, grain refinement, precipitation,
etc. The speed of crack growth is evaluated from the
viewpoint of fracture mechanics as will be explained
in Sect. 7.4.
Stress Relaxation
Plastic deformation shows time dependence, as ex-
plained for creep where the external stress is kept
constant. On the other hand, when a specimen is
pulled to induce plastic flow and then kept at a con-
stant total strain, plastic flow occurs with holding time
and hence stress (elastic strain) decreases, which is
called stress relaxation. To measure relaxation behavior,
Part C 7.4