Devore J.L., Berk K.N. Modern Mathematical Statistics with Applications
Подождите немного. Документ загружается.


Since the pdf factors and the region of positive density is rectangular, we have
demonstrated that
1. Th e distribution of system lifetime X
1
+ X
2
is gamma(a ¼ 2, b ¼ 1/l)
2. Th e distribution of the proportion of system lifetime during which the original
component functions is uniform on (0, 1)
3. Y
1
¼ X
1
+ X
2
and Y
2
¼ X
1
/(X
1
+ X
2
) are independent of each other ■
In the foregoing example, because the joint pdf factored into one pdf
involving y
1
alone and another pdf involving y
2
alone, the individual (i. e. marginal)
pdf’s of the two new variables were obtained from the joint pdf without any further
effort. Often this will not be the case – that is, Y
1
and Y
2
will not be independent.
Then to obtain the marginal pdf of Y
1
, the joint pdf must be integrated over all
values of the second variable. In fact, in many applications an investigator wishes to
obtain the distribution of a single function u
1
(X
1
, X
2
) of the origina l variables. To
accomplish this, a second function u
2
(X
1
, X
2
) is selected, the joint pdf is obtained,
and then y
2
is integrated out. There are of course many ways to select the second
function. The choice should be made so that the transformation can be easily
inverted and the integration in the last step is straightforward.
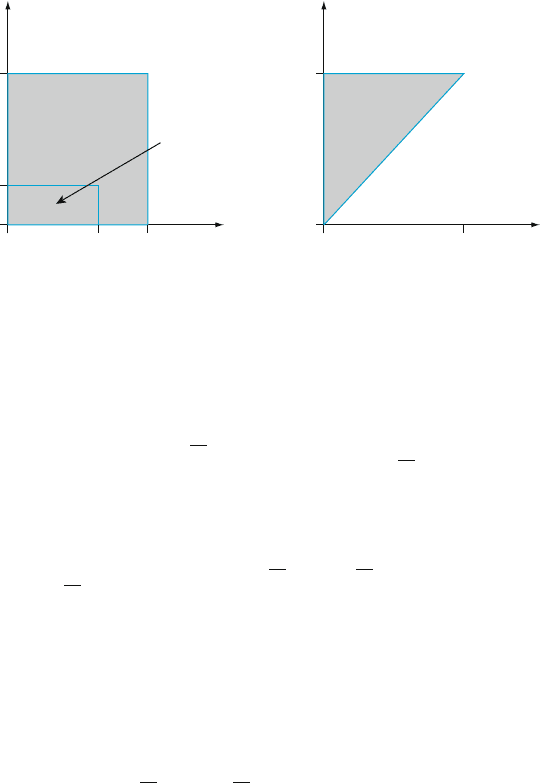
Example 5.26 Consider a rectangular coordinate system with a horizontal x
1
axis and a vertical x
2
axis as shown in Figure 5.7(a). First a point (X
1
, X
2
) is randomly select ed, where the
joint pdf of X
1
, X
2
is
f ðx
1
; x
2
Þ¼
x
1
þ x
2
0 < x
1
< 1; 0 < x
2
< 1
0 otherwise
(
Then a rectangle with vertices (0, 0), (X
1
, 0), (0, X
2
), and (X
1
, X
2
) is formed. What is
the distribution of X
1
X
2
, the area of this rectangle? To answer this question, let
Y
1
¼ X
1
X
2
Y
2
¼ X
2
so
y
1
¼ u
1
x
1
; x
2
ðÞ¼x
1
x
2
y
2
¼ u
2
x
1
; x
2
ðÞ¼x
2
Then
x
1
¼ n
1
ðy
1
; y
2
Þ¼
y
1
y
2
x
2
¼ n
2
ðy
1
; y
2
Þ¼y
2
Notice that because x
2
(¼y
2
) is between 0 and 1 and y
1
is the product of the two x
i
’s,
it must be the case that 0 < y
1
< y
2
. The region of positive density for the new
variables is then
T ¼ y
1
; y
2
ðÞ: 0 < y
1
< y
2
; 0 < y
2
< 1
fg
which is the triangular region shown in Figure 5.7(b).
268 CHAPTER 5 Joint Probability Distributions
Since ∂v
2
/∂y
1
¼ 0, the product of the two off-diagonal elements in the matrix
M will be 0, so only the two diagonal elements contribute to the Jacobian:
M ¼
1
y
2
?
01
0
@
1
A
jdetðMÞj ¼
1
y
2
The joint pdf of the two new variables is now
gðy
1
; y
2
Þ¼f
y
1
y
2
; y
2
detðMÞ
jj
¼
y
1
y
2
þ y
2
1
y
2
0 < y
1
< y
2
; 0 < y
2
< 1
0 otherwise
8
>
<
>
:
To obtain the marginal pdf of Y
1
alone, we must now fix y
1
at some arbitrary
value between 0 and 1, and integrate out y
2
. Figure 5.7b shows that we must
integrate along the vertical line segment passing through y
1
whose lower limit is
y
1
and whose upper limit is 1:
g
1
ðy
1
Þ¼
ð
1
y
1
y
1
y
2
þ y
2
1
y
2
dy
2
¼ 2ð1 y
1
Þ 0 < y
1
< 1
This marginal pdf can now be integrated to obtain any desired probability involving
the area. For example, integrating from 0 to .5 gives P(area < .5) ¼ .75.
■
The Joint Distribution of More than Two New Variables
Consider now starting with three rando m variables X
1
, X
2
, and X
3
, and forming
three new variables Y
1
, Y
2
, and Y
3
. Suppose again that the transformation can be
inverted to express the original variables in terms of the new ones:
x
1
¼ v
1
y
1
; y
2
; y
3
ðÞ; x
2
¼ v
2
y
1
; y
2
; y
3
ðÞ; x
3
¼ v
3
y
1
; y
2
; y
3
ðÞ
Then the foregoing theorem can be extended to this new situation. The Jacobian
matrix has dimension 3 3, with the entry in the ith row and jth column being ∂v
i
/∂y
j
.
The joint pdf of the new variables results from replacing each x
i
in the original pdf f(·)
by its expression in terms of the y
j
’s and multiplying by the absolute value of the
Jacobian.
1
0
x
2
y
2
1
0
x
1
y
1
1
0
1
0
A possible
rectangle
For (X
1
,
X
2
) For (Y
1
,
Y
2
)
ab
Figure 5.7 Regions of positive density for Example 5.26
5.4 Transformations of Random Variables 269

Example 5.27 Consider n ¼ 3 identical components with independent lifetimes X
1
, X
2
, X
3
, each
having an exponential distribution with parameter l. If the first component is used
until it fails, replaced by the second one which remains in service until it fails, and
finally the third component is used until failure, then the total lifetime of these
components is Y
3
¼ X
1
+ X
2
+ X
3
. To find the distribution of total lifetime, let’s first
define two other new variables: Y
1
¼ X
1
and Y
2
¼ X
1
+ X
2
(so that Y
1
< Y
2
< Y
3
).
After finding the joint pdf of all three variabl es, we integrate out the first two
variables to obtain the desired information. Solving for the old variables in terms of
the new gives
x
1
¼ y
1
x
2
¼ y
2
y
1
x
3
¼ y
3
y
2
It is obvious by inspection of these expressions that the three diagonal elements of
the Jacobian matrix are all 1’s and that the elements above the diagonal are all 0’s,
so the determinant is 1, the product of the diagonal elements. Since
f ð x
1
; x
2
; x
3
Þ¼l
3
e
lðx
1
þx
2
þx
3
Þ
x
1
> 0; x
2
> 0; x
3
> 0
by substitution,
gðy
1
; y
2
; y
3
Þ¼l
3
e
ly
3
0 < y
1
< y
2
< y
3
Integrating this joint pdf first with respect to y
1
between 0 and y
2
and then with
respect to y
2
between 0 and y
3
(try it!) gives
g
3
ðy
3
Þ¼
l
3
2
y
2
3
e
ly
3
y
3
> 0
This is a gamma pdf. The result is easily extended to n components. It can also be
obtained (more easily) by using a moment generating function argument.
■
Exercises Section 5.4 (58–64)
58. Consider two components whose lifetimes X
1
and
X
2
are independent and exponentially distributed
with parameters l
1
and l
2
, respectively. Obtain
the joint pdf of total lifetime X
1
+ X
2
and the
proportion of total lifetime X
1
/(X
1
+ X
2
) during
which the first component operates.
59. Let X
1
denote the time (hr) it takes to perform a
first task and X
2
denote the time it takes to perform
a second one. The second task always takes at
least as long to perform as the first task. The
joint pdf of these variables is
f ðx
1
; x
2
Þ¼
2ðx
1
þ x
2
Þ 0 x
1
x
2
1
0 otherwise
a. Obtain the pdf of the total completion time for
the two tasks.
b. Obtain the pdf of the difference X
2
X
1
between the longer completion time and the
shorter time.
60. An exam consists of a problem section and a short-
answer section. Let X
1
denote the amount of time
(hr) that a student spends on the problem section
and X
2
represent the amount of time the same
student spends on the short-answer section.
Suppose the joint pdf of these two times is
f ðx
1
; x
2
Þ¼
cx
1
x
2
x
1
3
< x
2
<
x
1
2
; 0 < x
1
< 1
0 otherwise
8
<
:
a. What is the value of c ?
b. If the student spends exactly .25 h on the short-
answer section, what is the probability that at
most .60 h was spent on the problem section?
[Hint: First obtain the relevant conditional dis-
tribution.]
c. What is the probability that the amount of time
spent on the problem part of the exam exceeds
the amount of time spent on the short-answer
part by at least .5 hr?
270
CHAPTER 5 Joint Probability Distributions

d. Obtain the joint distribution of Y
1
¼ X
2
/X
1
, the
ratio of the two times, and Y
2
¼ X
2
. Then
obtain the marginal distribution of the ratio.
61. Consider randomly selecting a point (X
1
, X
2
, X
3
)in
the unit cube {(x
1
, x
2
, x
3
): 0 < x
1
< 1, 0 < x
2
< 1,
0 < x
3
< 1}according to the joint pdf
f ðx
1
; x
2
; x
3
Þ
¼
8x
1
x
2
x
3
0 < x
1
< 1; 0 < x
2
< 1; 0 < x
3
< 1
0 otherwise
(
(so the three variables are independent). Then
form a rectangular solid whose vertices are (0, 0, 0),
(X
1
,0,0),(0,X
2
,0),(X
1
, X
2
,0),(0,0,X
3
), (X
1
,0,X
3
),
(0, X
2
, X
3
), and (X
1
, X
2
, X
3
). The volume of this cube
is Y
3
¼X
1
X
2
X
3
. Obtain the pdf of this volume. [Hint:
Let Y
1
¼ X
1
and Y
2
¼ X
1
X
2
.]
62. Let X
1
and X
2
be independent, each having a
standard normal distribution. The pair (X
1
, X
2
)
corresponds to a point in a two-dimensional coor-
dinate system. Consider now changing to polar
coordinates via the transformation,
Y
1
¼ X
2
1
þ X
2
2
Y
2
¼
arctan
X
2
X
1
X
1
> 0; X
2
0
arctan
X
2
X
1
þ 2p X
1
> 0; X
2
< 0
arctan
X
2
X
1
þ p X
1
< 0
0 X
1
¼ 0
8
>
>
>
>
>
>
>
>
>
>
>
<
>
>
>
>
>
>
>
>
>
>
>
:
from which X
1
¼
ffiffiffiffiffi
Y
1
p
cosðY
2
Þ; X
2
¼
ffiffiffiffiffi
Y
1
p
sinðY
2
Þ.
Obtain the joint pdf of the new variables and then
the marginal distribution of each one. [Note:It
would be nice if we could simply let Y
2
¼ arctan
(X
2
/X
1
), but in order to insure invertibility of the
arctan function, it is defined to take on values
onl y between p/2 and p/2. Our specification
of Y
2
allows it to assume any value between
0and2p .]
63. The result of the previous exercise suggests how
observed values of two independent standard nor-
mal variables can be generated by first generating
their polar coordinates with an exponential rv with
l ¼
1
2
and an independent uniform(0, 2p) rv: Let
U
1
and U
2
be independent uniform(0, 1) rv’s, and
then let
Y
1
¼2ln U
1
ðÞY
2
¼ 2pU
2
Z
1
¼
ffiffiffiffiffi
Y
1
p
cosðY
2
Þ Z
2
¼
ffiffiffiffiffi
Y
1
p
sinðY
2
Þ
Show that the Z
i
’s are independent standard nor-
mal. [Note: This is called the Box-Muller transfor-
mation after the two individuals who discovered
it. Now that statistical software packages will
generate almost instantaneously observations
from a normal distribution with any mean and
variance, it is thankfully no longer necessary for
people like you and us to carry out the transforma-
tions just described – let the software do it!]
64. Let X
1
and X
2
be independent random variables,
each having a standard normal distribution. Show
that the pdf of the ratio Y ¼ X
1
/X
2
is given by f(y)
¼ 1/[p(1 + y
2
)] for 1< y < 1 (this is called
the standard Cauchy distribution).
5.5
Order Statistics
Many statistical procedures involve ordering the sample observations from smallest
to largest and then manipulating these ordered values in various ways. For example,
the sample median is either the middle value in the ordered list or the average
of the two middle values depending on whe ther the sample size n is odd or even.
The sample range is the difference between the largest and smallest values. And a
trimmed mean results from deleting the same number of observations from each
end of the ordered list and averaging the remaining values.
Suppose that X
1
, X
2
, ..., X
n
is a random sample from a continuous distribu-
tion with cumulative distributio n function F(x) and density function f(x ). Because
of continuity, for any i, j with i 6¼ j, P(X
i
¼ X
j
) ¼ 0. This implies that with
probability 1, the n sample observations will all be different (of course, in practice
all measuring instruments have accuracy limitations, so tied values may in fact
result).
5.5 Order Statistics 271

DEFINITION
The order statistics from a random sample are the rando m variables Y
1
, ...
Y
n
given by
Y
1
¼ the smallest among X
1
, X
2
, ..., X
n
Y
2
¼ the second smallest among X
1
, X
2
, ..., X
n
...
Y
n
¼ the largest among X
1
, X
2
, ..., X
n
so that with probability 1, Y
1
< Y
2
< ... < Y
n 1
< Y
n
.
The sample median is then Y
(n + 1)/2
when n is odd, the sample range is Y
n
Y
1
, and
for n ¼ 10 the 20% trimmed mean is
P
8
i¼3
Y
i
=6. The order statistics are defined as
random variables (hence the use of uppercase letters); observed values are denoted
by y
1
, ..., y
n
.
The Distributions of Y
n
and Y
1
The key idea in obtaining the distribution of the largest order statistic is that Y
n
is at
most y if and only if every one of the X
i
’s is at most y. Similarly, the distribution of
Y
1
is based on the fact that it will be at least y if and only if all X
i
’s are at least y.
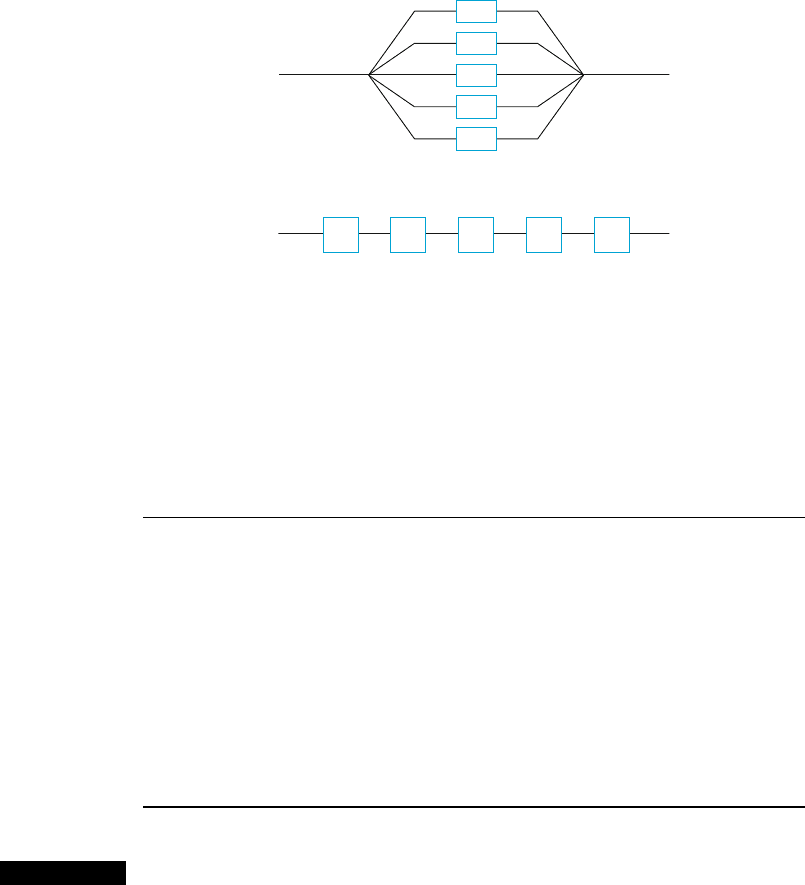
Example 5.28 Consider 5 identical components connected in parallel, as illustrated in Figure 5.8(a).
Let X
i
denote the lifetime (hr) of the ith component (i ¼ 1, 2, 3, 4, 5). Suppose that
the X
i
’s are independent and that each has an exponential distribution with l ¼ .01,
so the expected lifetime of any particular component is 1/l ¼ 100 h. Because of the
parallel configuration, the system will continue to function as long as at lea st one
component is still working, and will fail as soon as the last component functioning
ceases to do so. That is, the system lifetime is just Y
5
, the largest order statistic in a
sample of size 5 from the specifi ed exponential distribution. Now Y
5
will be at most
y if and only if every one of the five X
i
’s is at most y. With G
5
(y) denoting the
cumulative distribution function of Y
5
,
G
5
ðyÞ¼PY
5
yðÞ¼PX
1
y; X
2
y; :::; X
5
yðÞ
¼ PX
1
yðÞPX
2
yð Þ PX
5
yðÞ¼FðyÞ½
5
¼ 1 e
:01y
5
The pdf of Y
5
can now be obtained by differentiating the cdf with respect to y.
Suppose instead that the five components are connected in series rather than
in parallel (Figure 5.8(b)). In this case the system lifetime will be Y
1
, the smallest of
the five order statistics, since the system will crash as soon as a sing le one of the
individual components fails. Note that system lifetime will exceed y hr if and only
if the lifetime of every component exceeds y hr. Thus
G
1
ðyÞ¼PY
1
yðÞ¼1 PY
1
> yðÞ¼1 PX
1
> y; X
2
> y; :::; X
5
> yðÞ
¼ 1 PX
1
> yðÞPX
2
> yð Þ PX
5
> yðÞ¼1 e
:01y
5
¼ 1 e
:05y
This is the form of an exponential cdf with parameter .05. More generally, if the
n components in a series connection have lifetimes that are independent, each
exponentially distributed with the same parameter l, then system lifetime will be
272 CHAPTER 5 Joint Probability Distributions
exponentially distributed with parameter nl. The expected system lifetime will then
be 1/nl, much smaller than the expected lifetime of an individual component.
■
An argument para llel to that of the previous example for a general sample
size n and an arbitrary pdf f(x) gives the following general results.
PROPOSITION
Let Y
1
and Y
n
denote the smallest and largest order statistics, respectively,
based on a random sample from a continuo us distribution with cdf F(x) and
pdf f(x). Then the cdf and pdf of Y
n
are
G
n
ðyÞ¼ FðyÞ½
n
g
n
ðyÞ¼nFðyÞ½
n
1
f ðyÞ
The cdf and pdf of Y
1
are
G
1
ðyÞ¼1 1 FðyÞ
n
g
1
ðyÞ¼n
½
1 FðyÞ
½
n
1
f ðyÞ
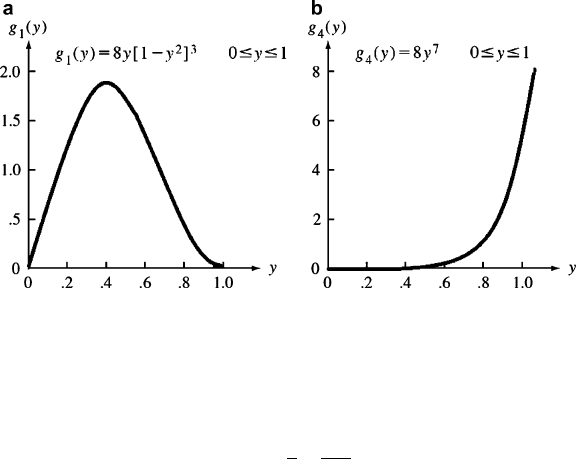
Example 5.29 Let X denote the contents of a one-gallon container, and suppose that its pdf is f(x)
¼ 2x for 0 x 1 (and 0 otherwise) with corresponding cdf F(x) ¼ x
2
in the
interval of positive density. Con sider a random sample of four such containers.
Let’s determine the expected value of Y
4
Y
1
, the difference between the contents
of the most-filled container and the least-filled contain er; Y
4
Y
1
is just the sample
range. The pdf’s of Y
4
and Y
1
are
g
4
ðyÞ¼4 y
2
ðÞ
3
2y 0 y 1
g
1
ðyÞ¼41 y
2
ðÞ
3
2y 0 y 1
The correspo nding density curves appear in Figure 5.9
a
b
Figure 5.8 Systems of components for Example 5.28: (a) parallel connection;
(b) series connection
5.5 Order Statistics 273
EðY
4
Y
1
Þ¼EðY
4
ÞEðY
1
Þ¼
ð
1
0
y 8y
7
dy
ð
1
0
y 8yð1 y
2
Þ
3
dy
¼
8
9
384
945
¼ :889 :406 ¼ :483
If random samples of four containers were repeatedly selected and the sample
range of contents determined for each one, the long run average value of the range
would be .483.
■
The Joint Distribution of the n Order Statistics
We now develop the joint pdf of Y
1
, Y
2
, ..., Y
n
. Consider first a random sample
X
1
, X
2
, X
3
of fuel efficiency measurements (mpg). The joint pdf of this random
sample is
fx
1
; x
2
; x
3
ðÞ¼fx
1
ðÞfx
2
ðÞfx
3
ðÞ
The joint pdf of Y
1
, Y
2
, Y
3
will be positive only for values of y
1
, y
2
, y
3
satisfying
y
1
< y
2
< y
3
. What is this joint pdf at the values y
1
¼ 28.4, y
2
¼ 29.0, y
3
¼ 30.5?
There are six different ways to obtain these ordered values:
X
1
¼ 28.4 X
2
¼ 29.0 X
3
¼ 30.5
X
1
¼ 28.4 X
2
¼ 30.5 X
3
¼ 29.0
X
1
¼ 29.0 X
2
¼ 28.4 X
3
¼ 30.5
X
1
¼ 29.0 X
2
¼ 30.5 X
3
¼ 28.4
X
1
¼ 30.5 X
2
¼ 28.4 X
3
¼ 29.0
X
1
¼ 30.5 X
2
¼ 29.0 X
3
¼ 28.4
These six possibilities come from the 3! ways to order the three numerical observa-
tions once their values are fixed. Thus
g 28:4;29:0;30:5ðÞ¼f 28: 4ðÞf 29:0ðÞf 30:5ðÞþþf 30: 5ðÞf 29:0ðÞf 28:4ðÞ
¼3!f 28: 4ðÞf 29:0ðÞf 30:5ðÞ
Figure 5.9 Density curves for the order statistics (a) Y
1
and (b) Y
4
in Example 5.29
274
CHAPTER 5 Joint Probability Distributions

Analogous reasoning with a sample of size n yields the following result:
PROPOSITION
Let g(y
1
, y
2
, ..., y
n
) denote the joint pdf of the order statistics Y
1
, Y
2
, ..., Y
n
resulting from a random sample of X
i
’s from a pdf f(x). Then
gðy
1
; y
2
; ...; y
n
Þ¼
n!f ðy
1
Þf ðy
2
Þf ðy
n
Þ y
1
< y
2
< < y
n
0 otherwise
For example, if we have a random sample of component lifetimes and the lifetime
distribution is exponential with parameter l, then the joint pdf of the order statistics is
gðy
1
; ...; y
n
Þ¼n!l
n
e
lðy
1
þþy
n
Þ
0 < y
1
< y
2
< < y
n
Example 5.30 Suppose X
1
, X
2
, X
3
, and X
4
are independent random variables, each uniformly
distributed on the interval from 0 to 1. The joint pdf of the four corresponding order
statistics Y
1
, Y
2
, Y
3
, and Y
4
is f(y
1
, y
2
, y
3
, y
4
) ¼ 4!∙1 for 0 < y
1
< y
2
< y
3
< y
4
< 1.
The probability that every pair of X
i
s is separated by more than .2 is the same as the
probability that Y
2
Y
1
> .2, Y
3
Y
2
> .2, and Y
4
Y
3
> .2. This latter
probability results from integrating the joint pdf of the Y
i
s over the region .6 < y
4
< 1, .4 < y
3
< y
4
.2, .2 < y
2
< y
3
.2, 0 < y
1
< y
2
.2:
PðY
2
Y
1
>:2; Y
3
Y
2
>:2; Y
4
Y
3
>:2Þ¼
ð
1
:6
ð
y
4
:2
:4
ð
y
3
:2
:2
ð
y
2
:2
0
4!dy
1
dy
2
dy
3
dy
4
The inner integration gives 4!(y
2
.2), and this must then be integrated between .2
and y
3
.2. Making the change of variable z
2
¼y
2
.2, the integration of z
2
is from
0toy
3
.4. The result of this integration is 4!∙(y
3
.4)
2
/2. Continuing with the 3rd
and 4th integration, each time making an appropriate change of variable so that the
lower limit of each integration becomes 0, the result is
PðY
2
Y
1
>:2; Y
3
Y
2
>:2 ; Y
4
Y
3
>:2Þ¼:4
4
¼ :0256
A more gener al multiple integration argument for n independe nt uniform (0, B)
rvs shows that the probability that at all values are separated by at least d is 0 if d
B/(n 1) and
Pðall values are separated by more than dÞ
¼
½1 ðn 1Þd=B
n
0 d B=ðn 1Þ
0 d > B= ðn 1Þ
As an application, consider a year that has 365 days, and suppose that the birth time
of someone born in that year is uniformly distributed throughout the 365-day
period. Then in a group of 10 independently selected people born in that year, the
probability that all of their birth times are separated by more than 24 h (d ¼1 day)
is (1 9/365)
10
¼ .779. Thus the probability that at least two of the 10 birth times
are separated by at most 24 h is .221. As the group size n increases, it becomes more
likely that at least two people have birth times that are within 24 h of each other
5.5 Order Statistics 275

(but not necessarily on the same day). For n ¼ 16, this probability is .467, and for
n ¼ 17 it is .533. So with as few as 17 people in the group, it is more likely than not
that at least two of the people were born within 24 h of each other. Coincidences
such as this are not as surprising as one might think. The probability that at least
two people are born on the same day (assuming equally likely birthdays) is much
easier to calculate than what we have shown here; see Exercise 2.98.
■
The Distribution of a Single Order Statistic
We have already obtained the (marginal) distribution of the largest order statistic Y
n
and also that of the smallest order statistic Y
1
. Let’s now focus on an intermediate
order statistic Y
i
where 1 < i < n. For concreteness, consider a random sample X
1
,
X
2
, ..., X
6
of n ¼ 6 component lifetimes, and suppos e we wish the distribution of
the 3
rd
smallest lifetime Y
3
. Now the joint pdf of all six order statistics is
gðy
1
; y
2
; ::: ; y
6
Þ¼6! fy
1
ðÞfy
6
ðÞ y
1
< y
2
< y
3
< y
4
< y
5
< y
6
To obtain the pdf of Y
3
alone, we must hold y
3
fixed in the joint pdf and integr ate
out all the other y
i
’s. One way to do this is to
1. Int egrate y
1
from 1 to y
2
, and then integrate y
2
from 1to y
3
.
2. Int egrate y
6
from y
5
to 1, then integrate y
5
from y
4
to 1, and finally integrate y
4
from y
3
to 1.
That is,
gðy
3
Þ¼
ð
1
y
3
ð
1
y
4
ð
1
y
5
ð
y
3
1
ð
y
2
1
6!f ðy
1
Þf ðy
2
Þf ðy
6
Þdy
1
dy
2
dy
6
dy
5
dy
4
¼6!
ð
y
3
1
ð
y
2
1
f ðy
1
Þf ðy
2
Þdy
1
dy
2
ð
1
y
3
ð
1
y
4
ð
1
y
5
f ðy
4
Þf ðy
5
Þf ðy
6
Þdy
6
dy
5
dy
4
f ðy
3
Þ
In these integrations we use the following general results:
ð
½FðxÞ
k
f ð xÞdx ¼
1
k þ 1
½FðxÞ
kþ1
þ c ½let u ¼ Fð xÞ
ð
½1 FðxÞ
k
f ð xÞdx ¼
1
k þ 1
½1 FðxÞ
kþ1
þ c ½let u ¼ 1 FðxÞ
Therefore
ð
y
3
1
ð
y
2
1
f ð y
1
Þf ðy
2
Þ dy
1
dy
2
¼
ð
y
3
1
Fðy
2
Þf ðy
2
Þ dy
2
¼
1
2
½Fðy
3
Þ
2
276 CHAPTER 5 Joint Probability Distributions

and
ð
1
y
3
ð
1
y
4
ð
1
y
5
f ð y
6
Þf ðy
5
Þf ðy
4
Þ dy
6
dy
5
dy
4
¼
ð
1
y
3
ð
1
y
4
½1 Fðy
5
Þf ð y
5
Þf ðy
4
Þ dy
5
dy
4
¼
ð
1
y
3
1
2
½1 Fðy
4
Þ
2
f ð y
4
Þ dy
4
¼
1
3 2
½1 Fðy
3
Þ
3
Thus
gðy
3
Þ¼
6!
2!3!
½Fðy
3
Þ
2
½1 Fðy
3
Þ
3
f ð y
3
Þ1< y
3
< 1
A generalization of the foregoing argument gives the following expre ssion
for the pdf of any single order statistic.
PROPOSITION
The pdf of the ith smallest order statistic Y
i
is
gðy
i
Þ¼
n!
ði 1Þ! ðn iÞ!
½Fðy
i
Þ
i1
½1 Fðy
i
Þ
ni
f ð y
i
Þ1< y
i
< 1
Example 5.31 Suppose that component lifetime is exponentially distributed with parameter l. For
a random sample of n ¼ 5 components, the expected value of the sample median
lifetime is
EðY
3
Þ¼
ð
1
0
y
5!
2! 2!
ð1 e
ly
Þ
2
ðe
ly
Þ
2
le
ly
dy
Expanding out the integrand and integrating term by term, the expected
value is .783/l. The median of the exponential distribution is, from solving
Fð
~
mÞ¼:5;
~
m ¼ :693=l . Thus if sample after sample of five components is
selected, the long run average value of the sample median will be somewhat larger
than the value of the lifetime population distribution median. This is because the
exponential distribution has a positive skew.
■
The Joint Distribution of Two Order Statistics
We now focus on the joint distribution of two order statistics Y
i
and Y
j
with i < j.
Consider first n ¼ 6 and the two order statistics Y
3
and Y
5.
We must then take the
joint pdf of all six order statistics, hold y
3
and y
5
fixed, and integrate out y
1
, y
2
, y
4
,
and y
6
.Thatis,
gðy
3
; y
5
Þ¼
ð
1
y
5
ð
y
5
y
3
ð
y
3
1
ð
y
3
y
1
6! f ðy
1
Þf ðy
6
Þdy
2
dy
1
dy
4
dy
6
5.5 Order Statistics 277