Devore J.L., Berk K.N. Modern Mathematical Statistics with Applications
Подождите немного. Документ загружается.


Using a Comparison to Identify Causality
Investigators are often interested in comparing either the effects of two different treat-
ments on a response or the response after treatment with the response after no treatment
(treatment vs. control). If the individuals or objects to be used in the comparison are
not assigned by the investigators to the two different conditions, the study is said to be
observational. The difficulty with drawing conclusions based on an observational
study is that although statistical analysis may indicate a significant difference in
response between the two groups, the difference may be due to some underlying factors
that had not been controlled rather than to any difference in treatments.
Example 10.2 A letter in the Journal of the American Medical Association (May 19, 1978) reports
that of 215 male physicians who were Harvard graduates and died between
November 1974 and October 1977, the 125 in full-time practice lived an average
of 48.9 years beyond graduation, whereas the 90 with academic affiliations lived
an average of 43.2 years beyond graduation. Does the data suggest that the mean
lifetime after graduation for doctors in full-time practice exceeds the mean lifetime
for those who have an academic affiliation (if so, those medical students who say
that they are “dying to obtain an academic affiliation” may be closer to the truth than
they realize; in other words, is “publish or perish” really “publish and perish”)?
Let m
1
denote the true average number of years lived beyond gradu ation for
physicians in full-time practice, and let m
2
denote the same quantity for physicians
with academic affiliations. Assume the 125 and 90 physicians to be random
samples from populations 1 and 2, respectively (which may not be reasonable if
there is reason to believe that Harvard graduates have special char acteristics that
differentiate them from all other physicians—in this case inferences would be
restricted just to the “Harvard populations ”). The letter from which the data was
taken gave no information about varianc es, so for illustration assume that
s
1
¼ 14.6 and s
2
¼ 14.4. The relevant hypotheses are
H
0
: m
1
m
2
¼ 0 versus
H
a
: m
1
m
2
> 0, so D
0
is zero. The computed value of z is
z ¼
48:9 43:2
ffiffiffiffiffiffiffiffiffiffiffiffiffiffiffiffiffiffiffiffiffiffiffiffiffiffiffiffiffiffiffiffiffiffiffi
ð14:6Þ
2
125
þ
ð14:4Þ
2
90
s
¼
5:70
ffiffiffiffiffiffiffiffiffiffiffiffiffiffiffiffiffiffiffiffiffiffiffi
1:70 þ 2:30
p
¼ 2:85
The P-value for an upper-tailed test is 1 F(2.85) ¼ .0022. At significance level .01,
H
0
is rejected (because a P-value) in favor of the conclusion that m
1
m
2
> 0
(m
1
> m
2
). This is consistent with the information reported in the letter.
This data resulted from a retrospective observational study; the investigator
did not start out by selecting a sample of doctors and assigning some to the
“academic affiliation” treatment and the others to the “full-time practice” treat-
ment, but instead identified members of the two groups by looking backward
in time (through obituaries!) to past records. Can the statistically significant result
here really be attributed to a difference in the type of medical practice after
graduation, or is there some other under lying factor (e.g., age at graduation,
exercise regimens, etc.) that might also furnish a plausible explanation for the
difference?
Once upon a time, it could be argued that the studies linking smoking and
lung cancer were all observational, and therefore that nothing had been proved.
488 CHAPTER 10 Inferences Based on Two Samples

This was the view of the great (perhaps the greatest) statistician R. A. Fisher, who
maintained till his death in 1962 that the observat ional studies did not show
causation. He said that people who choose to smoke might be more susceptible to
lung cancer. This explanation for the relationship had plenty of opposition then, and
few would support it now. At that time few women got lung cancer because few
women had smoked, but when smoking increased among women, so did lung
cancer. Furthermore, the inciden ce of lung cancer was higher for those who smoked
more, and quitters had reduced incidence. Eventually, the physiological effects on
the body were better understood, and nonobservational animal studies made it clear
that smoking does cause lung cancer.
■
A randomized controlled experiment results when investigators assign
subjects to the two treatments in a random fashion. When statistical sign ificance
is observed in such an experiment, the investigator and other interested parties will
have more confidence in the conclusion that the difference in response has been
caused by a difference in treatments. A famous example of this type of experiment
and conclusion is the Salk polio vaccine experiment described in Section 10.4.
These issues are discussed at greater length in the (nonmathematical) books by
Moore and by Freedman et al., listed in the Chapter 1 bibliography.
b and the Choice of Sample Size
The probability of a type II error is easily calculat ed when both population
distributions are normal with known values of s
1
and s
2
. Consider the case in
which the alternative hypothesis is
H
a
: m
1
m
2
> D
0
. Let D
0
denote a value of m
1
m
2
that exceeds D
0
(a value for which
H
0
is false). The upper-tailed rejection region
z z
a
can be re-expressed in the form x y D
0
þ z
a
s
XY
. Thus the probability
of a type II error when m
1
m
2
¼ D
0
is
bðD
0
Þ¼Pðnot rejecting H
0
when m
1
m
2
¼ D
0
Þ
¼ Pð
X Y < D
0
þ z
a
s
XY
when m
1
m
2
¼ D
0
Þ
When m
1
m
2
¼ D
0
, X Y is normally distributed with mean value D
0
and standard
deviation s
XY
(the same standard deviation as when
H
0
is true); using these values
to standardize the inequality in parentheses gives b.
Alternative Hypothesis b(D
0
) ¼ P(type II error when m
1
m
2
¼ D
0
)
H
a
: m
1
m
2
> D
0
F z
a
D
0
D
0
s
H
a
: m
1
m
2
< D
0
1 F z
a
D
0
D
0
s
H
a
: m
1
m
2
6¼ D
0
F z
a=2
D
0
D
0
s
F z
a=2
D
0
D
0
s
where s ¼ s
XY
¼
ffiffiffiffiffiffiffiffiffiffiffiffiffiffiffiffiffiffiffiffiffiffiffiffiffiffiffiffiffiffiffiffiffiffi
ðs
2
1
=mÞþðs
2
2
=nÞ
p
10.1 z Tests and Confidence Intervals for a Difference Between Two Population Means 489

Example 10.3
(Example 10.1
continued)
If m
1
and m
2
(the true average GPAs for the two levels of effort) differ by as much as
.5, what is the probability of detecting such a departure from
H
0
based on a level .05
test with sample sizes m ¼ 10 and n ¼ 11? The value of s for these sample sizes
(the denominator of z) was previously calculated as .262. The probability of a type
II error for the two-tailed level .05 test when
m
1
m
2
¼ D
0
¼ :5
is
bð:5Þ¼F 1:96
:5 0
:262
F 1:96
:5 0
:262
¼ F : 0516ðÞF 3:868ðÞ¼:521
By symmetry we also have b(.5) ¼ .521. Thus the probability of detecting such a
departure is 1 b(.5) ¼ .479. Clearly, we do not have a very good chance of
detecting a difference of .5 with these sample sizes. We should not conclude from
Example 10.1 that there is no relationship between study time and GPA, because
the sample sizes were insufficient.
■
As in Chapter 9, sample sizes m and n can be determined that will satisfy both
P(type I error) ¼ a specified a and P(type II error when m
1
m
2
¼ D
0
) ¼
a specified b. For an upper-tailed test, equating the previous expression for b(D
0
)
to the specified value of b gives
s
2
1
m
þ
s
2
2
n
¼
ðD
0
D
0
Þ
2
ðz
a
þ z
b
Þ
2
When the two sample sizes are equal, this equation yields
m ¼ n ¼
ðs
2
1
þ s
2
2
Þðz
a
þ z
b
Þ
2
ðD
0
D
0
Þ
2
These expressions are also correct for a lower-tailed test, whereas a is replaced by
a/2 for a two-tailed test.
Large-Sample Tests
The assumptions of normal population distributions and known values of s
1
and
s
2
are unnecessa ry when both sample sizes are large. In this case, the Central Limit
Theorem guarantees that
X Y has approximately a normal distri bution regardless
of the underlying population distributions. Furtherm ore, using S
2
1
and S
2
2
in place of
s
2
1
and s
2
2
in Expression (10.1) gives a variable whose distribution is approximately
standard norm al:
Z ¼
X Y ðm
1
m
2
Þ
ffiffiffiffiffiffiffiffiffiffiffiffiffiffiffi
S
2
1
m
þ
S
2
2
n
r
A large-sample test statistic results from replacing m
1
m
2
by D
0
, the expected
value of
X Y when
H
0
is true. This statistic Z then has approximately a standard
490 CHAPTER 10 Inferences Based on Two Samples
normal distribution when
H
0
is true, so level a tests are obtained by using z critical
values exactly as before.
Use of the test statistic value
z ¼
x y D
0
ffiffiffiffiffiffiffiffiffiffiffiffiffiffi
s
2
1
m
þ
s
2
2
n
r
along with the previously stated upper-, lower-, and two-tailed rejection
regions based on z critical values gives large-sample tests whose significance
levels are approximately a. These tests are usually appropriate if both m > 40
and n > 40. A P-value is computed exactly as it was for our earlier z tests.
Example 10.4 A study was carried out in an attempt to improve student performance in a low-
level university mathematics course. Experience had shown that many students had
fallen by the wayside, meaning that they had dropped out or completed the course
with minimal effort and low grades. The study involved assigning the students
to sections based on odd or even Social Security number. It is important that the
assignment to sectio ns not be on the basis of student choice, because then
the differences in performance might be attributable to differences in student
attitude or ability. Half of the sections were taught tradition ally, whereas the
other half were taught in a way that hopefully would keep the students involved .
They were given frequent assignments that were collected and graded, they had
frequent quizzes, and they were allowed retakes on exams. Lotus Hershberger
conducted the experiment and he supplied the data. Here are the final exam scores
for the 79 students taught traditionally (the control group) and for the 85 students
taught with more involvement (the experimental group):
Control
37 22 29 29 33 22 32 36 29 06 04 37 00 36 00 32
27 07 19 35 26 22 28 28 32 35 28 33 35 24 21 00
32 28 27 08 30 37 09 33 30 36 28 03 08 31 29 09
00 00 35 25 29 03 33 33 28 32 39 20 32 22 24 20
32 07 08 33 29 09 00 30 26 25 32 38 22 29 29
Experimental
34 27 26 33 23 37 24 34 22 23 32 05 30 35 28 25
37 28 26 29 22 33 31 23 37 29 00 30 34 26 28 27
32 29 31 33 28 21 34 29 33 06 08 29 36 07 21 30
28 34 28 35 30 34 09 38 09 27 25 33 09 23 32 25
37 28 23 26 34 32 34 00 24 30 36 28 38 35 16 37
25 34 38 34 31
Table 10.1 summarizes the data. Does this information suggest that true mean for
the experimental condition exceeds that for the control condition? Let’s use a test
with a ¼ .05.
10.1 z Tests and Confidence Intervals for a Difference Between Two Population Means 491
Let m
1
and m
2
denote the true mean scores for the control condition and the
experimental condi tion, respectively. The two hypotheses are
H
0
: m
1
m
2
¼ 0
versus
H
a
: m
1
m
2
< 0.
H
0
will be rejected if z z
.05
¼1.645. Then
z ¼
23:87 27:34
ffiffiffiffiffiffiffiffiffiffiffiffiffiffiffiffiffiffiffiffiffiffiffiffiffiffiffiffiffiffi
11:60
2
79
þ
8:85
2
85
r
¼
3:47
1:620
¼2:14
Since 2.14 1.645,
H
0
is rejected at significance level .05. Alternatively, the
P-value for a lower-tailed z test is
P-value ¼ F ðzÞ¼F 2:14ðÞ¼: 016
which implies rejection at significance level .05. Also, if the test had been two-
tailed, then the P-value would be 2(.016) ¼ .032, so the two-tailed test would reject
H
0
at the .05 level.
We have shown fairly conclusively that the experimental method of instruc-
tion is an improvement. Nevertheless, there is more to be said. It is important to
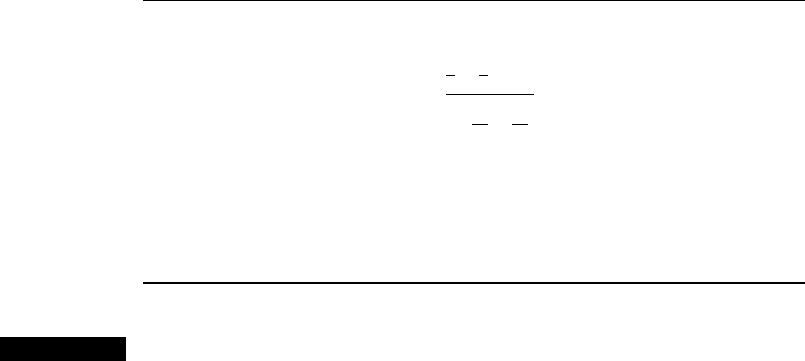
view the data graphically to see if there is anything strange. Figure 10.1 shows a
plot from Systat combini ng a boxplot and dotplot.
The plot shows that both groups have outlying observations at the low end;
some students showed up for the final but performed very poorly. What happens
if we compare the groups while ignoring the low performers whose scores are
below 10? The resulting summary information is in Table 10.2.
Table 10.1 Summary results for Example 10.4
Group Sample Size Sample Mean Sample SD
Control 79 23.87 11.60
Experimental 85 27.34 8.85
Control
Exper
40
30
20
10
0
Final
*
*
*
*
Figure 10.1 Boxplot/dotplot for the teaching experiment
492
CHAPTER 10 Inferences Based on Two Samples

Notice that the means and standard deviations for the two groups are now
very similar. Indeed, based on Table 10.2 the z-statistic value is .34, giving no
reason to reject the null hypothesi s. For the majority of the students, there appears
to be not much effect from the experimental treatment. It is the low performers who
make a big difference in the results. There were 18 low performers in the control
group but only 9 in the experimental group. The effect of the experimental
instruction is to decrease the number of students who perform at the bottom of
the scale. This is in accord with the goals of the experimental treatment, which was
designed to keep students on track.
■
Confidence Intervals for m
1
m
2
When both population distributions are normal, standardizing X Y gives a random
variable Z with a standard normal distribution. Since the area under the z curve
between z
a/2
and z
a/2
is 1 a, it follows that
P z
a=2
<
X Y ðm
1
m
2
Þ
ffiffiffiffiffiffiffiffiffiffiffiffiffiffiffi
s
2
1
m
þ
s
2
2
n
r
< z
a=2
0
B
B
@
1
C
C
A
¼ 1 a
Manipulation of the inequalities inside the parenthe ses to isolate m
1
m
2
yields the
equivalent probability statemen t
P
X Y z
a=2
ffiffiffiffiffiffiffiffiffiffiffiffiffiffiffi
s
2
1
m
þ
s
2
2
n
r
< m
1
m
2
< X Y þ z
a=2
ffiffiffiffiffiffiffiffiffiffiffiffiffiffiffi
s
2
1
m
þ
s
2
2
n
r
!
¼ 1 a
This implies that a 100(1 a)% CI for m
1
m
2
has lower limit x y z
a=2
s
XY
and upper limit x y þ z
a=2
s
XY
, where s
XY
is the square-root expression. This
interval is a special case of the general formula
^
y z
a=2
s
^
y
.
If both m and n are large, the CLT implies that this interval is valid even without
the assumption of normal populations; in this case, the confidence level is approxi-
mately 100(1 a)%. Furthermore, use of the sample variances S
2
1
and S
2
2
in the
standardized variable Z yields a valid interval in which s
2
1
and s
2
2
replace s
2
1
and s
2
2
.
Provided that m and n are both large, a CI for m
1
m
2
with a confidence level
of approximately 100(1 a)% is
x y z
a=2
ffiffiffiffiffiffiffiffiffiffiffiffiffiffi
s
2
1
m
þ
s
2
2
n
r
Table 10.2 Summary results without poor performers
Group Sample Size Sample Mean Sample SD
Control 61 29.59 5.005
Experimental 76 29.88 4.950
10.1 z Tests and Confidence Intervals for a Difference Between Two Population Means 493
where – gives the lower limit and + the upper limit of the interv al. An upper
or lower confidence bound can also be calculated by retaining the appropriate
sign (+ or ) and replacing z
a/2
by z
a
.
Our standard rule of thumb for characterizing sample sizes as large is m > 40 and
n > 40.
Example 10.5 For many cal culus instructors it seems that students taking Calculus I in the fall
semester are better prepared than are the students taking it in the spring. If so, it
would be nice to have some measure of the difference. We use data from a study of
the influence of various predictors on calculus performance, “Factors Affecting
Achievement in the First Course in Calculus” (J. Exper. Educ. ,1984: 136–140).
Here are the ACT mathematics scores for the fall and spring students:
Fall
27 29 30 34 29 30 29 28 28 31 25 34 27
28 31 26 24 30 25 25 27 27 28 27 27 27
26 33 27 26 35 27 32 30 27 30 30 28 28
30 26 31 28 26 23 28 31 28 33 24 32 20
28 34 33 30 29 16 30 30 26 29 26 27 26
25 31 18 29 29 30 29 29 30 33 29 29 27
28 28
Spring
29 26 25 24 14 31 25 33 27 30 27 29 26
27 29 31 25 28 26 23 28 27 27 19 28 25
23 20 34 25 33 30 26 19 18 25 17 26 24
29 20 27 26 26 27 20 28 26 27 24 28 28
30 27 27 27 14 25 27 32 35 13 28 25 29
25 19 27 30 15 28 27 28 32
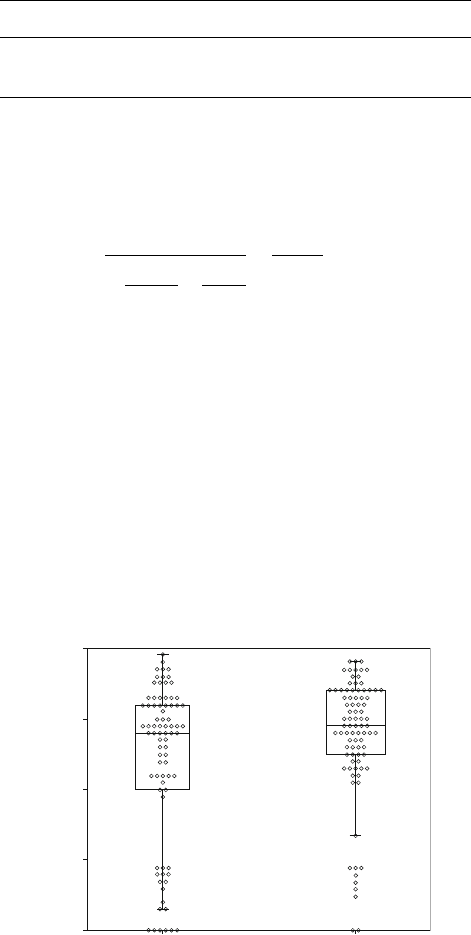
Figure 10.2 shows a graph from Systat combining a boxpl ot and dotplot.
Fall Sprin
g
ACTM
40
30
20
10
0
*
*
*
*
*
*
*
*
*
Figure 10.2 Boxplot/dotplot for fall and spring ACT mathematics scores
494
CHAPTER 10 Inferences Based on Two Samples

It is evident that there are more high scorers in the fall and more low scorers
in the spring. Table 10.3 summarizes the data.
Let’s now calculate a confidence interval for the difference between true
average fall ACT score and true average spring ACT score, using a confidence
level of 95%:
28:25 25:88 ð1:96Þ
ffiffiffiffiffiffiffiffiffiffiffiffiffiffiffiffiffiffiffiffiffiffiffiffiffiffiffi
3:25
2
80
þ
4:59
2
74
s
¼ 2:37 ð1: 96Þð:6456Þ
¼ 2:37 1:265 ¼ð1:10; 3:64Þ
That is, with 95% confidence, 1.10 < m
1
m
2
< 3.64. We can therefore be highly
confident that the true fall average exceeds the true spring average by between 1.10
and 3.64. It makes sense that the fall average should be higher, because students
who were less prepared in the fall (as judged by an algebra placement test) were
required to take a fall semester college algebra course before taking Calculus I in
the spring.
■
If the variances s
2
1
and s
2
2
are at least approximately known and the investi-
gator uses equal sample sizes, then the sample size n for each sample that yields a
100(1 a)% interval of width w is
n ¼
4z
2
a=2
ðs
2
1
þ s
2
2
Þ
w
2
which will generally have to be rounded up to an integer.
Exercises Section 10.1 (1–19)
1. An article in the November 1983 Consumer
Reports compared various types of batteries. The
average lifetimes of Duracell Alkaline AA batteries
and Eveready Energizer Alkaline AA batteries
were given as 4.1 h and 4.5 h, respectively. Sup-
pose these are the population average lifetimes.
a. Let
X be the sample average lifetime of 100 Dur-
acell batteries and
Y be the sample average life-
time of 100 Eveready batteries. What is the mean
value of
X Y (i.e., where is the distribution of
X Y centered)? How does your answer depend
on the specified sample sizes?
b. Suppose the population standard deviations of
lifetime are 1.8 h for Duracell batteries and
2.0 h for Eveready batteries. With the sample
sizes given in part (a), what is the variance of
the statistic
X Y, and what is its standard
deviation?
c. For the sample sizes given in part (a), draw a
picture of the approximate distribution curve of
X Y (include a measurement scale on the
Table 10.3 Summary results for Example 10.5
Group Sample Size Sample Mean Sample SD
Fall 80 28.25 3.25
Spring 74 25.88 4.59
10.1 z Tests and Confidence Intervals for a Difference Between Two Population Means 495

horizontal axis). Would the shape of the curve
necessarily be the same for sample sizes of
10 batteries of each type? Explain.
2. Let m
1
and m
2
denote true average tread lives for
two competing brands of size P205/65R15 radial
tires. Test
H
0
: m
1
m
2
¼ 0 versus
H
a
: m
1
m
2
6¼ 0 at level .05 using the following data:
m ¼ 45,
x ¼ 42; 500, s
1
¼ 2200, n ¼ 45,
y ¼ 40; 400, and s
2
¼ 1900.
3. Let m
1
denote true average tread life for a premium
brand of P205/65R15 radial tire and let m
2
denote
the true average tread life for an economy brand of
the same size. Test
H
0
: m
1
m
2
¼ 5000 versus
H
a
:
m
1
m
2
> 5000 at level .01 using the following
data: m ¼ 45,
x ¼ 42; 500, s
1
¼ 2200, n ¼ 45,
y ¼ 36; 800, and s
2
¼ 1500.
4. a. Use the data of Exercise 2 to compute a 95% CI
for m
1
m
2
. Does the resulting interval suggest
that m
1
m
2
has been precisely estimated?
b. Use the data of Exercise 3 to compute a 95%
upper confidence bound for m
1
m
2
.
5. Persons having Raynaud’s syndrome are apt to
suffer a sudden impairment of blood circulation
in fingers and toes. In an experiment to study the
extent of this impairment, each subject immersed
a forefinger in water and the resulting heat output
(cal/cm
2
/min) was measured. For m ¼ 10 subjects
with the syndrome, the average heat output was
x ¼ :64, and for n ¼ 10 nonsufferers, the average
output was 2.05. Let m
1
and m
2
denote the true
average heat outputs for the two types of subjects.
Assume that the two distributions of heat output
are normal with s
1
¼ .2 and s
2
¼ .4.
a. Consider testing
H
0
: m
1
m
2
¼1.0 versus
H
a
: m
1
m
2
< 1.0 at level .01. Describe in
words what
H
a
says, and then carry out the test.
b. Compute the P-value for the value of Z
obtained in part (a).
c. What is the probability of a type II error when
the actual difference between m
1
and m
2
is m
1
m
2
¼1.2?
d. Assuming that m ¼ n, what sample sizes are
required to ensure that b ¼ .1 when m
1
m
2
¼1.2?
6. An experiment to compare the tension bond
strength of polymer latex modified mortar (Portland
cement mortar to which polymer latex emulsions
have been added during mixing) to that of unmodi-
fied mortar resulted in
x ¼ 18:12 kgf=cm
2
for the
modified mortar (m ¼ 40) and
y ¼ 16:87 kgf=cm
2
for the unmodified mortar (n ¼ 32). Let m
1
and
m
2
be the true average tension bond strengths for
the modified and unmodified mortars, respectively.
Assume that the bond strength distributions are both
normal.
a. Assuming that s
1
¼ 1.6 and s
2
¼ 1.4, test
H
0
:
m
1
m
2
¼ 0 versus
H
a
: m
1
m
2
> 0 at level .01.
b. Compute the probability of a type II error for
the test of part (a) when m
1
m
2
¼ 1.
c. Suppose the investigator decided to use a level
.05 test and wished b ¼ .10 when m
1
m
2
¼ 1.
If m ¼ 40, what value of n is necessary?
d. How would the analysis and conclusion of part
(a) change if s
1
and s
2
were unknown but
s
1
¼ 1.6 and s
2
¼ 1.4?
7. Are male college students more easily bored than
their female counterparts? This question was exam-
ined in the article “Boredom in Young Adults—
Gender and Cultural Comparisons” (J. Cross-Cult.
Psych., 1991: 209–223). The authors administered
a scale called the Boredom Proneness Scale to 97
male and 148 female U.S. college students. Does
the accompanying data support the research hypoth-
esis that the mean Boredom Proneness Rating is
higher for men than for women? Test the appropri-
ate hypotheses using a .05 significance level.
Gender
Sample
Size
Sample
Mean
Sample
SD
Male 97 10.40 4.83
Female 148 9.26 4.68
8. Is touching by a coworker sexual harassment? This
question was included on a survey given to federal
employees, who responded on a scale of 1–5, with
1 meaning a strong negative and 5 indicating a
strong yes. The table summarizes the results.
Gender
Sample
Size
Sample
Mean
Sample
SD
Female 4343 4.6056 .8659
Male 3903 4.1709 1.2157
Of course, with 1–5 being the only possible
values, the normal distribution does not apply
here, but the sample sizes are sufficient that it
does not matter. Obtain a two-sided confidence
interval for the difference in population means.
Does your interval suggest that females are more
likely than males to regard touching as harassment?
Explain your reasoning.
496
CHAPTER 10 Inferences Based on Two Samples

9. The article “Evaluation of a Ventilation Strategy
to Prevent Barotrauma in Patients at High Risk for
Acute Respiratory Distress Syndrome” (New
Engl. J. Med., 1998: 355–358) reported on an
experiment in which 120 patients with similar
clinical features were randomly divided into a
control group and a treatment group, each consist-
ing of 60 patients. The sample mean ICU stay
(days) and sample standard deviation for the treat-
ment group were 19.9 and 39.1, respectively,
whereas these values for the control group were
13.7 and 15.8.
a. Calculate a point estimate for the difference
between true average ICU stay for the treat-
ment and control groups. Does this estimate
suggest that there is a significant difference
between true average stays under the two
conditions?
b. Answer the question posed in part (a) by
carrying out a formal test of hypotheses. Is
the result different from what you conjectured
in part (a)?
c. Does it appear that ICU stay for patients given
the ventilation treatment is normally distri-
buted? Explain your reasoning.
d. Estimate true average length of stay for
patients given the ventilation treatment in a
way that conveys information about precision
and reliability.
10. An experiment was performed to compare the
fracture toughness of high-purity 18 Ni maraging
steel with commercial-purity steel of the same
type (Corrosion Sci., 1971: 723–736). The sample
average toughness was
x ¼ 65:6 for m ¼ 32 spe-
cimens of the high-purity steel, whereas for
n ¼ 38 specimens of commercial steel
y ¼ 59:8.
Because the high-purity steel is more expensive,
its use for a certain application can be justified
only if its fracture toughness exceeds that of com-
mercial-purity steel by more than 5. Suppose that
both toughness distributions are normal.
a. Assuming that s
1
¼ 1.2 and s
2
¼ 1.1, test the
relevant hypotheses using a ¼ .001.
b. Compute b for the test conducted in part (a)
when m
1
m
2
¼ 6.
11. What impact does fast-food consumption have on
various dietary and health characteristics? The
article “Effects of Fast-Food Consumption on
Energy Intake and Diet Quality among Children
in a National Household Study” (Pediatrics, 2004:
112–118) reported the accompanying summary
data on daily calorie intake both for a sample of
teens who said they did not typically eat fast food
and another sample of teens who said they did
usually eat fast food.
Eat Fast Food
Sample
Size
Sample
Mean
Sample
SD
No 663 2258 1519
Yes 413 2637 1138
a. Estimate the difference between true average
calorie intake for teens who typically don’t eat
fast foods and true average intake for those who
do eat fast foods, and do so in a way that conveys
information about reliability and precision.
b. Does this data provide strong evidence for
concluding that true average calorie intake for
teens who typically eat fast food exceeds true
average intake for those who don’t typically
eat fast food by more than 200 cal/day? Carry
out a test at significance level .05 based on
determining the P-value.
12. A 3-year study was carried out to see if fluoride
toothpaste helps to prevent cavities (“Clinical
Testing of Fluoride and non-Fluoride Containing
Dentifrices in Hounslow School Children,” British
Dental J., Feb., 1971: 154–158). The dependent
variable was the DMFS increment, the number of
new Decayed, Missing, and Filled Surfaces. The
table gives summary data.
Group
Sample
Size
Sample
Mean
Sample
SD
Control 289 12.83 8.31
Fluoride 260 9.78 7.51
Calculate and interpret a 99% confidence interval
for the difference between true means. Is fluoride
toothpaste beneficial?
13. A study seeks to compare hospitals based on the
performance of their intensive care units. The
dependent variable is the mortality ratio, the ratio
of the number of deaths over the predicted number
of deaths based on the condition of the patients. The
comparison will be between hospitals with nurse
staffing problems and hospitals without such pro-
blems. Assume, based on past experience, that the
standard deviation of the mortality ratio will be
around .2 in both types of hospital. How many of
each type of hospital should be included in the study
in order to have both the type I and type II error
probabilities be .05, if the true difference of mean
mortality ratio for the two types of hospital is .2?
If we conclude that hospitals with nurse staffing
problems have a higher mortality ratio, does this
imply a causal relationship? Explain.
10.1 z Tests and Confidence Intervals for a Difference Between Two Population Means 497