Devore J.L., Berk K.N. Modern Mathematical Statistics with Applications
Подождите немного. Документ загружается.


1 Kenyon 38140
1 Oberlin 36282
1 Franklin and
Marshall
36480
2 Goucher 31082
2 Randolph-Macon 26830
2 Thomas Aquinas 20400
2 Beloit 30138
2 Austin 21586
2 Ursinus 35160
2 Siena 22685
2 Juniata 28920
a. Construct a comparative boxplot of expenses,
and comment on any interesting features.
b. Obtain a 95% confidence interval for the dif-
ference of population means. Interpret your
result in terms of the additional cost of attend-
ing a more prestigious college. Moving up
from tier 2 to tier 1 raises the cost by roughly
what percentage?
31. The article “Characterization of Bearing Strength
Factors in Pegged Timber Connections” (J. Struct.
Engrg., 1997: 326–332) gave the following sum-
mary data on proportional stress limits for speci-
mens constructed using two different types of wood:
Type
of Wood
Sample
Size
Sample
Mean
Sample
SD
Red oak 14 8.48 .79
Douglas fir 10 6.65 1.28
Assuming that both samples were selected from
normal distributions, carry out a test of hypotheses
to decide whether the true average proportional
stress limit for red oak joints exceeds that for
Douglas fir joints by more than 1 MPa.
32. According to the article “Fatigue Testing of
Condoms” (Polym. Test., 2009: 567–571), “tests
currently used for condoms are surrogates for the
challenges they face in use,” including a test for
holes, an inflation test, a package seal test, and
tests of dimensions and lubricant quality (all fer-
tile territory for the use of statistical methodo-
logy!). The investigators developed a new test
that adds cyclic strain to a level well below break-
age and determines the number of cycles to break.
The cited article reported that for a sample of 20
natural latex condoms of a certain type, the sample
mean and sample standard deviation of the num-
ber of cycles to break were 4358 and 2218, respec-
tively, whereas a sample of 20 polyisoprene
condoms gave a sample mean and sample standard
deviation of 5805 and 3990, respectively. Is there
strong evidence for concluding that the true aver-
age number of cycles to break for the polyisoprene
condom exceeds that for the natural latex condom
by more than 1000 cycles? [Note: The article pre-
sented the results of hypothesis tests based on the t
distribution; the validity of these depends on
assuming normal population distributions.]
33. Consider the pooled t variable
T ¼
ðX YÞðm
1
m
2
Þ
S
p
ffiffiffiffiffiffiffiffiffiffiffiffi
1
m
þ
1
n
r
which has a t distribution with m + n 2 df when
both population distributions are normal with
s
1
¼ s
2
(see the Pooled t Procedures subsection
for a description of S
p
).
a. Use this t variable to obtain a pooled t confi-
dence interval formula for m
1
m
2
.
b. A sample of ultrasonic humidifiers of one par-
ticular brand was selected for which the obser-
vations on maximum output of moisture (oz)
in a controlled chamber were 14.0, 14.3, 12.2,
and 15.1. A sample of the second brand gave
output values 12.1, 13.6, 11.9, and 11.2
(“Multiple Comparisons of Means Using
Simultaneous Confidence Intervals,” J. Qual.
Techn., 1989: 232–41). Use the pooled t for-
mula from part (a) to estimate the difference
between true average outputs for the two
brands with a 95% confidence interval.
c. Estimate the difference between the two m’s
using the two-sample t interval discussed in this
section, and compare it to the interval of part (b).
34. Refer to Exercise 33. Describe the pooled t test for
testing
H
0
: m
1
m
2
¼ 0 when both population
distributions are normal with s
1
¼ s
2
. Then use
this test procedure to test the hypotheses suggested
in Exercise 32.
35. Exercise 35 from Chapter 9 gave the following
data on amount (oz) of alcohol poured into a short,
wide tumbler glass by a sample of experienced
bartenders: 2.00, 1.78, 2.16, 1.91, 1.70, 1.67,
1.83, 1.48. The cited article also gave summary
data on the amount poured by a different sample
of experienced bartenders into a tall, slender
(highball) glass; the following observations are
consistent with the reported summary data: 1.67,
1.57, 1.64, 1.69, 1.74, 1.75, 1.70, 1.60.
508
CHAPTER 10 Inferences Based on Two Samples

a. What does a comparative boxplot suggest
about similarities and differences in the data?
b. Carry out a test of hypotheses to decide whether
the true average amount poured is different for
the two types of glasses; be sure to check the
validity of any assumptions necessary to your
analysis, and report a P-value.
36. Is the incidence of head or neck pain among video
display terminal users related to the monitor angle
(degrees from horizontal)? The paper, “An Anal-
ysis of VDT Monitor Placement and Daily Hours
of Use for Female Bifocal Users” (Work, 2003:
77–80), reported the accompanying data. Carry
out an appropriate test of hypotheses (be sure to
include a P-value in your analysis).
Pain
Sample
Size
Sample
Mean
Sample
SD
Yes 32 2.20 3.42
No 40 3.20 2.52
37. The article “Gender Differences in Individuals
with Comorbid Alcohol Dependence and Post-
Traumatic Stress Disorder” (Amer. J. Addiction,
2003: 412–423) reported the accompanying data
on total score on the Obsessive-Compulsive
Drinking Scale (OCSD).
Gender
Sample
Size
Sample
Mean
Sample
SD
Male 44 19.93 7.74
Female 40 16.26 7.58
Formulate hypotheses and carry out an appro-
priate analysis. Does your conclusion depend on
whether a significance level of .05 or .01 was
employed? (The cited paper reported P-value
<. 05; presumably .05 would have been replaced
by .01 if the P-value were really that small).
38. Which factors are relevant to the time a consumer
spends looking at a product on the shelf prior to
selection? The article “Effects of Base Price upon
Search Behavior of Consumers in a Supermarket”
(J. Econ. Psychol., 2003: 637–652) reported the
following data on elapsed time (sec) for fabric
softener purchasers and washing-up liquid purcha-
sers; the former product is significantly more
expensive than the latter. These products were
chosen because they are similar with respect to
allocated shelf space and number of alternative
brands.
Product
Sample
Size
Sample
Mean
Sample
SD
Fabric softener 15 30.47 19.15
Washing-up liquid 19 26.53 15.37
a. What if any assumptions are needed before an
inferential procedure can be used to compare
true average elapsed times?
b. If just the two sample means had been
reported, would they provide persuasive evi-
dence for a significant difference between true
average elapsed times for the two products?
c. Carry out an appropriate test of significance
and state your conclusion.
10.3
Analysis of Paired Data
In Sections 10.1 and 10.2, we considered estimat ing or testing for a difference
between two means m
1
and m
2
. This was done by utilizing the results of a random
sample X
1
, X
2
,...,X
m
from the distribution with mean m
1
and a completely
independent (of the X’s) sample Y
1
, ..., Y
n
from the distribution with mean m
2
.
That is, either m individuals were selected from population 1 and n different
individuals from population 2, or m individuals (or experimental objects) were
given one treatment and another n indi viduals were given the other treat ment.
In contrast, there are a number of experimental situations in which there is only
one set of n individuals or experimental objects, and two observations are made on
each individual or object, resulting in a natural pairing of values.
10.3 Analysis of Paired Data 509
Example 10.8 Trace metals in drinking water affect the flavor, and unusually high concentrations
can pose a health hazard. The article “Trace Metals of South Indian River” (Envir.
Studies, 1982: 62–66) reports on a study in which six river locations were selected
(six experimental objects) and the zinc concentration (mg/L) determined for both
surface water and bottom water at each location. The six pairs of observations are
displayed in the accompanying table. Does the data suggest that true average
concentration in bottom water exceeds that of surface water?
Location
123456
Zinc concentration in bottom water (x) .430 .266 .567 .531 .707 .716
Zinc concentration in surface water (y) .415 .238 .390 .410 .605 .609
Difference .015 .028 .177 .121 .102 .107
Figure 10.5a displays a plot of this data. At first glance, there appears to be
little difference between the x and y samples. From location to location, there is a
great deal of variability in each sample, and it looks as though any differences
between the samples can be attributed to this variability. However, when the
observations are identified by location, as in Figure 10.5b, a different view
emerges. At each location, bottom concentration exceeds surface concentration.
This is confirmed by the fact that all x y differences (bottom water concentration
– surface water concentration) displayed in the bottom row of the data table are
positive. As we will see, a correct analysis of this data focuses on these differences.
ASSUMPTIONS
The data consists of n independently selected pairs (X
1
, Y
1
), (X
2
, Y
2
), ... ,
(X
n
, Y
n
), with E(X
i
) ¼ m
1
and E(Y
i
) ¼ m
2
. Let D
1
¼ X
1
Y
1
, D
2
¼ X
2
Y
2
,
..., D
n
¼ X
n
Y
n
, so the D
i
’s are the differences within pairs. Then the D
i
’s
are assumed to be normally distri buted with mean value m
D
and variance s
2
D
.
We are again interested in hypothesis testing or estimation for the difference
m
1
m
2
. The denominator of the two-sample t statistic was obtained by first
applying the rule Vð
X YÞ¼VðXÞþVðYÞ However, with paired data, the X and
Y observations within each pair are often not independent, so
X and Y are not
independent of each other, and the rule is not valid. We must therefore abandon the
two-sample t procedures and look for an alternative method of analysis.
.2 .3 .4 .5 .6 .7 .8
x
y
Location x
Location y
a
b
2 3 41 56
562143
Figure 10.5 Plot of paired data from Example 10.8: (a) observations not identified
by location; (b) observations identified by location ■
510
CHAPTER 10 Inferences Based on Two Samples

The Paired t Test
Because different pairs are independent, the D
i
’s are independent of each other. If
we let D ¼ X Y, where X and Y are the first and second o bservations, respec-
tively, within an arbitrary pair, then the expected difference is
m
D
¼ EX YðÞ¼EðXÞEðYÞ¼m
1
m
2
(the rule of expected values used here is valid even when X and Y are dependent).
Thus any hypothesis about m
1
m
2
can be phrased as a hypothesis about the mean
difference m
D
. But since the D
i
’s constitute a normal random sample (of differ-
ences) with mean m
D
, hypotheses about m
D
can be tested using a one-sample t test.
That is, to test hypotheses about m
1
m
2
when data is paired, form the differences
D
1
,D
2
, ... ,D
n
and carry out a one-sample t test (based on n 1 df) on the
differences.
THE PAIRED
t TEST
Null hypothesis:
H
0
: m
D
¼ D
0
(where D ¼ X Y is the difference between
the first and second observations within a
pair, and m
D
¼ m
1
m
2
)
Test statistic value: t ¼
d D
0
s
D
=
ffiffiffi
n
p
(where
d and s
D
are the sample mean and
standard deviation, respectively, of the d
i
’s)
Alternative Hypothesis Rejection Region for Level a Test
H
a
: m
D
> D
0
t t
a,n1
H
a
: m
D
< D
0
t t
a,n1
H
a
: m
D
6¼ D
0
either t t
a/2,n1
or t t
a/2,n1
A P-value can be calculated as was done for earlier t tests.
Example 10.9 Musculoskeletal neck-and-shoulder disorders are all too common among office
staff who perform repetitive tasks using visual display units. The article “Upper-
Arm Eleva tion During Office Work” (Ergonomics, 1996: 1221–1230) reported on a
study to determine whether more varied work conditions would have any impact on
arm movement. The accompanying data was obtained from a sample of n ¼ 16
subjects. Each observation is the amount of time, expressed as a proportion of total
time observed, during which arm elevation was below 30
. The two measurements
from each subject were obtained 18 months apart. During this period, work condi-
tions were changed, and subjects were allowed to engage in a wider variety of work
tasks. Does the data suggest that true average time during which elevation is below
30
differs after the change from what it was before the change? This particular
angle is important because in Sweden, where the research was conducted, worker s’
compensation regulations assert that arm elevation less than 30
is not harmful.
Subject 1 2 3 4 5 6 7 8
Before 81 87 86 82 90 86 96 73
After 78 91 78 78 84 67 92 70
Difference 3 484619 43
10.3 Analysis of Paired Data 511
Subject 9 10 11 12 13 14 15 16
Before 74 75 72 80 66 72 56 82
After 58 62 70 58 66 60 65 73
Difference 16 13 2 22 0 12 99
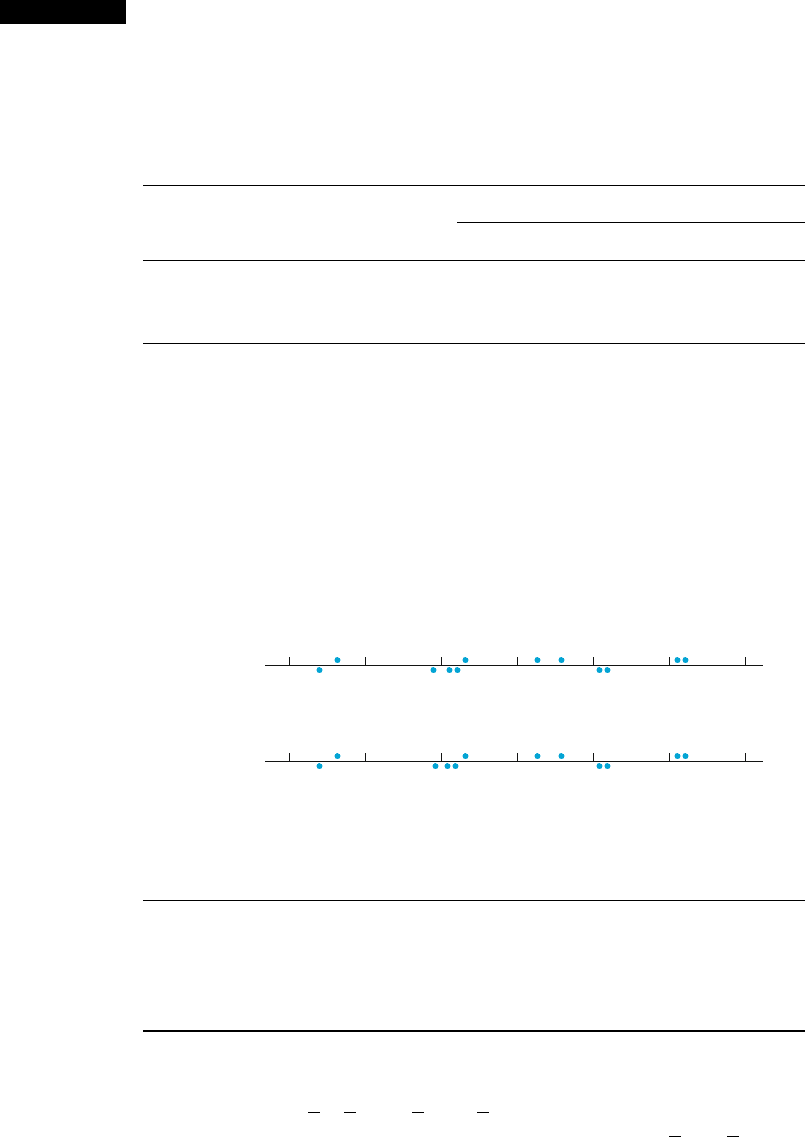
Figure 10.6 shows a normal probability plot of the 16 differences; the pattern
in the plot is quite straight, supporting the normality assumption. A boxplot of these
differences appears in Figure 10.7; the box is located considerably to the right of
zero, suggesting that perhaps m
D
> 0 (note also that 13 of the 16 differences are
positive and only two are negative).
Let’s now use the recommended sequence of steps to test the appropriate
hypotheses.
1. Let m
D
denote the true average difference between elevation time before the
change in work conditions and time after the change.
2.
H
0
: m
D
¼ 0 (there is no difference between true average time before the change
and true average time after the change)
3.
H
a
: m
D
6¼ 0
2010−10 0
Difference
Figure 10.7 A boxplot of the differences in Example 10.9
Figure 10.6 A normal probability plot from MINITAB of the differences in Example 10.9
512
CHAPTER 10 Inferences Based on Two Samples

4. t ¼
d 0
s
D
=
ffiffiffi
n
p
¼
d
s
D
=
ffiffiffi
n
p
5. n ¼ 16, Sd
i
¼ 108,
P
d
2
i
¼ 1746, from which d ¼ 6:75, s
D
¼ 8.234, and
t ¼
6:75
8:234=
ffiffiffiffiffi
16
p
¼ 3:28 3:3
6. Appendix Table A.7 shows that the area to the right of 3.3 under the t curve with
15 df is .002. The inequality in
H
a
implies that a two-tailed test is appropriate, so
the P-value is approximately 2(.002) ¼ .004 (MINITAB gives .0051).
7. Since .004 .01, the null hypothesis can be rejected at either significance leve l
.05 or .01. It does appear that the true average difference between times is
something other than zero; that is, true average time after the change is different
from that before the change. Recalling that arm elevation should be kept under
30
, we can conclude that the situation became worse because the amount of
time below 30
decreased. ■
When the number of pairs is large, the assumption of a normal difference
distribution is not neces sary. The CLT validates the resulting z test.
A Confidence Interval for m
D
In the same way that the t CI for a single population mean m is based on the
t variable T ¼ð
X mÞ=ðS=
ffiffiffi
n
p
Þ,at confidence interval for m
D
(¼ m
1
m
2
) is based
on the fact that
T ¼
D m
D
S
D
=
ffiffiffi
n
p
has a t distribution with n 1 df. Manipulation of this t variable, as in previous
derivations of CIs, yields the following 100(1 a)% CI:
The paired t CI for m
D
is
d t
a=2;n1
s
D
=
ffiffiffi
n
p
A one-sided confidence bound results from retaining the relevant sign and
replacing t
a/2
by t
a
.
When n is small, the validity of this interval requires that the distribution of
differences be at least approximately normal. For large n, the CLT ensures that the
resulting z interval is valid without any restrictions on the distribution of differences.
Example 10.10 Adding computerized medical images to a database promises to provide great
resources for physicians. However, there are other methods of obtaining such
information, so the issue of efficiency of access needs to be investigated. The article
10.3 Analysis of Paired Data 513
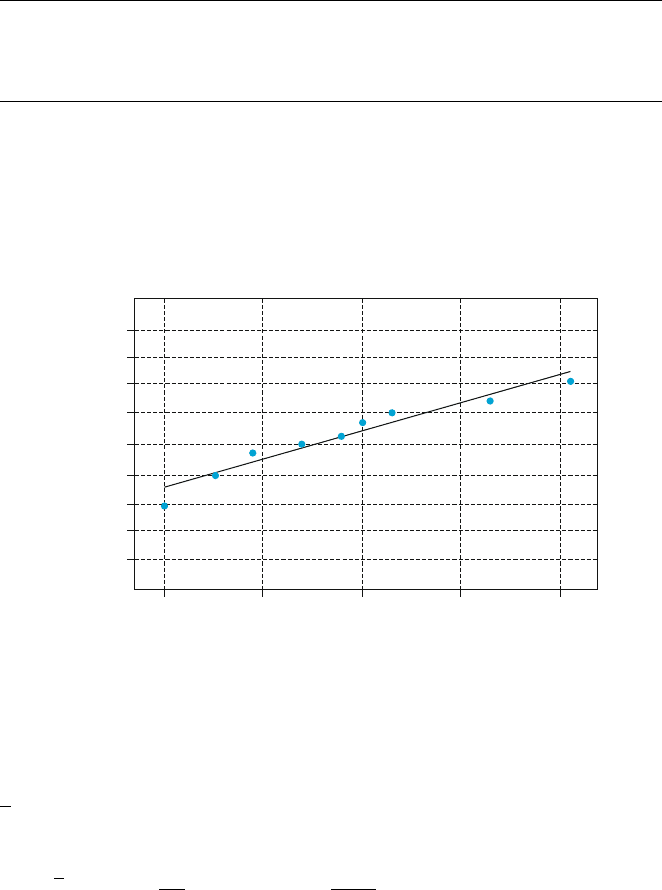
“The Comparative Effectiveness of Conventional and Digital Image Libraries”
(J. Audiov. Media Med., 2001: 8–15) reported on an experiment in which 13
computer-proficient medical professionals were timed both while retrieving an
image from a library of slides and while retrieving the same image from a computer
database with a web front end.
Subject 12345678910111213
Slide 30 35 40 25 20 30 35 62 40 51 25 42 33
Digital 25 16 15 15 10 20 7 16 15 13 11 19 19
Difference 5192510101028462538142314
Let m
D
denote the true mean difference between slide retrieval time (sec) and digital
retrieval time. Using the paired t confidence interval to estimate m
D
requires that the
difference distribution be at least approximately normal. The linear pattern of
points in the normal probability plot from MINITAB (Figure 10.8) validates the
normality assumption. (Only 9 points appear because of ties in the differences.)
Relevant summary quantities are Sd
i
¼ 267,
P
d
2
i
¼ 7201, from which
d ¼ 20: 5, s
D
¼ 11.96. The t critical value required for a 95% confidence level is
t
.025,12
¼ 2.179, and the 95% CI is
d t
a=2;n1
s
D
ffiffiffi
n
p
¼ 20:5 2:179
11:96
ffiffiffiffiffi
13
p
¼ 20:5 7:2 ¼ð13:3; 27:7Þ
Thus we can be highly confident (at the 95% confidence level) that 13.3 < m
D
< 27.7. This interval of plausible values is rather wide, a consequence of the sample
standard deviation being large relative to the sample mean. A sample size much larger
than 13 would be required to estimate with substantially more precision. Notice,
however, that 0 lies well outside the interval, suggesting that m
D
> 0; this is confirmed
.999
.99
.95
.80
.50
Probability
.20
.05
.01
515253545
Diff
W-test for Normality
R: 0.9724
P-Value (approx): > 0.1000
Average: 20.5385
StDev: 11.9625
N: 13
.001
Figure 10.8 Normal probability plot of the differences in Example 10.10
514
CHAPTER 10 Inferences Based on Two Samples

by a formal hypothesis test. It is not hard to show that 0 is outside the 95% CI if and
only if the two-tailed test rejects
H
0
: m
D
¼ 0 at the .05 level. We can conclude from
the experiment that computer retrieval appears to be faster on average.
■
Paired Data and Two-Sample t Procedures
Consider using the two-sample t test on paired data. The numerators of the
paired t and two-sample t test statistics are identical, since d ¼
P
d
i
=n ¼
½
P
ðx
i
y
i
Þ=n ¼
P
x
i
ðÞ=n
P
y
i
ðÞ=n ¼ x y. The difference between the two
statistics is due entirely to the denominators. Each test statistic is obtained by
standardizing
X Y ð¼ DÞ, but in the presence of dependence the two-sample
t standardization is incorrect. To see this, recall from Section 6.3 that
VðX YÞ¼VðXÞþVðYÞ2 CovðX; YÞ
Since the correlation between X and Y is
r ¼ CorrðX; YÞ¼CovðX; YÞ=½
ffiffiffiffiffiffiffiffiffiffi
VðXÞ
p
ffiffiffiffiffiffiffiffiffiffi
VðYÞ
p
It follows that
VðX YÞ¼s
2
1
þ s
2
2
2rs
1
s
2
Applying this to X Y yields
Vð
X YÞ¼V
1
n
X
D
i
¼
VðD
i
Þ
n
¼
s
2
1
þ s
2
2
2rs
1
s
2
n
The two-sample t test is based on the assumption of independence, in which
case r ¼ 0. But in many paired experiments, there will be a strong positive depen-
dence between X and Y (large X associated with large Y), so that r will be positive and
the variance of
X Y will be smaller than s
2
1
=n þ s
2
2
=n.Thuswhenever there is
positive dependence within pairs, the denominator for the paired t statistic should be
smaller than for t of the independent-samples test. Often two-sample t will be much
closer to zero than paired t, considerably understating the significance of the data.
Similarly, when data is paired, the paired t CI will usually be narrower than
the (incorrect) two-sample t CI. This is because there is typically much less
variability in the differences than in the x and y values.
Paired Versus Unpaired Experiments
In our examples, paired data resulted from two observations on the same subject
(Example 10.9) or experimental object (location in Example 10.8). Even when this
cannot be done, paired data with dependence within pairs can be obtained by
matching individuals or objects on one or more characteristics thought to influence
responses. For example, in a medical experiment to compare the efficacy of two
drugs for lowering blood pressure, the experimenter’s budget might allow for the
treatment of 20 patients. If 10 patients are randomly selected for treatment with the
10.3 Analysis of Paired Data 515

first drug and another 10 independently selected for treatment with the second drug,
an independent-samples experiment results.
However, the experimenter, knowing that blood pressure is influenced by age
and weight, might decide to pair off patients so that within each of the resulting 10
pairs, age and weight were approximately equal (although there might be sizable
differences between pairs). Then each drug would be given to a different patient
within each pair for a total of 10 observations on each drug.
Without this matching (or “blocking”), one drug might appear to outperform
the other just because patients in one sample were lighter and younger and thus
more susceptible to a decrease in blood pressure than the heavier and older patients
in the second sample. However, there is a price to be paid for pairing—a smaller
number of degrees of freedom for the paired analysis—so we must ask when one
type of experiment should be preferred to the other.
There is no straightforward and precise answer to this question, but there are
some useful guidelines. If we have a choice between two t tests that are both valid
(and carried out at the same level of significance a), we should prefer the test that
has the larger number of degrees of freedom. The reason for this is that a larger
number of degrees of freedom means a smaller b for any fixed alternative value of
the parameter or parameters. That is, for a fixed type I error probability, the
probability of a type II error is decreased by increasing degrees of freedom.
However, if the experimental units are quite heterogeneous in their responses, it
will be difficult to detect small but significant differences between two treatments.
This is essentially what happened in the data set in Example 10.8; for both “treat-
ments” (bottom water and surface water), there is great between-location variability,
which tends to mask differences in treatments within locations. If there is a high
positive correlation within experimental units or subjects, the variance of
D ¼ X Y
will be much smaller than the unpaired variance. Because of this reduced variance, it
will be easier to detect a difference with paired samples than with independent
samples. The pros and cons of pairing can now be summarized as follows.
1. If there is great heterogeneity between experimental units and a large
correlation within experimental units (large positive r), then the loss in
degrees of freedom will be compensated for by the increased precision
associated with pairing, so a paired experiment is preferable to an inde-
pendent-samples experiment.
2. If the experimental units are relatively homogeneous and the correlation
within pairs is not large, the gain in precision due to pairing will be
outweighed by the decrease in degrees of freedom, so an independent-
samples experiment should be used.
Of course, values of s
2
1
; s
2
2
, and r will not usually be known very precisely, so
an investigator will be required to make a seat-of-the-pants judgment as to whether
Situation 1 or 2 obtains. In general, if the number of observations that can be
obtained is large, then a loss in degrees of freedom (e.g., from 40 to 20) will not be
serious; but if the number is small, then the loss (say, from 16 to 8) because of
pairing may be serious if not compensated for by increased precision. Similar
considerations apply when choosing between the two types of experiments to
estimate m
1
m
2
with a confidence interval.
516 CHAPTER 10 Inferences Based on Two Samples

Exercises Section 10.3 (39–47)
39. The Weaver–Dunn procedure with a fiber mesh
tape augmentation is commonly used to treat AC
joint (a joint in the shoulder) separations requiring
surgery. The article “TightRope Versus Fiber
Mesh Tape Augmentation of Acromioclavicular
Joint Reconstruction” (Am. J. Sport Med., 2010:
1204–1208) described the investigation of a new
method which was hypothesized to provide supe-
rior stability (less movement) compared to the
W–D procedure. The authors of the cited article
kindly provided the accompanying data on ante-
posterior (forward-backward) movement (mm) for
six matched pairs of shoulders:
Subject: 123456
Fiber mesh: 20 30 20 32 35 33
TightRope: 15 18 16 19 10 12
Carry out a test of hypotheses at significance level
.01 to see if true average movement for the Tight-
Rope treatment is indeed less than that for the
Fiber Mesh treatment. Be sure to check any
assumptions underlying your analysis.
40. Hexavalent chromium has been identified as an
inhalation carcinogen and an air toxin of concern
in a number of different locales. The article “Air-
borne Hexavalent Chromium in Southwestern
Ontario” (J. Air Waste Manage., 1997: 905–910)
gave the accompanying data on both indoor and
outdoor concentration (nanograms/m
3
) for a sam-
ple of houses selected from a certain region.
House 123456789
Indoor .07 .08 .09 .12 .12 .12 .13 .14 .15
Outdoor .29 .68 .47 .54 .97 .35 .49 .84 .86
House 10 11 12 13 14 15 16 17
Indoor .15 .17 .17 .18 .18 .18 .18 .19
Outdoor .28 .32 .32 1.55 .66 .29 .21 1.02
House 18 19 20 21 22 23 24 25
Indoor .20 .22 .22 .23 .23 .25 .26 .28
Outdoor 1.59 .90 .52 .12 .54 .88 .49 1.24
House 26 27 28 29 30 31 32 33
Indoor .28 .29 .34 .39 .40 .45 .54 .62
Outdoor .48 .27 .37 1.26 .70 .76 .99 .36
a. Calculate a confidence interval for the popu-
lation mean difference between indoor and
outdoor concentrations using a confidence
level of 95%, and interpret the resulting interval.
b. If a 34th house were to be randomly selected
from the population, between what values
would you predict the difference in concentra-
tions to lie?
41. Shoveling is not exactly a high-tech activity, but
will continue to be a required task even in our
information age. The article “A Shovel with a
Perforated Blade Reduces Energy Expenditure
Required for Digging Wet Clay” (Hum. Factors,
2010: 492–502) reported on an experiment in
which each of 13 workers was provided with both
a conventional shovel and a shovel whose blade
was perforated with small holes. The authors of the
cited article provided the following data on stable
energy expenditure [kcal/kg(subject)/lb(clay)]:
Worker: 1234567
Conventional: .0011 .0014 .0018 .0022 .0010 .0016 .0028
Perforated: .0011 .0010 .0019 .0013 .0011 .0017 .0024
Worker: 8 9 10 11 12 13
Conventional: .0020 .0015 .0014 .0023 .0017 .0020
Perforated: .0020 .0013 .0013 .0017 .0015 .0013
a. Calculate a confidence interval at the 95%
confidence level for the true average difference
between energy expenditure for the conven-
tional shovel and the perforated shovel (a nor-
mal probability plot of the sample differences
shows a reasonably linear pattern). Based on
this interval, does it appear that the shovels
differ with respect to true average energy
expenditure? Explain.
b. Carry out a test of hypotheses at significance
level .05 to see if true average energy expendi-
ture using the conventional shovel exceeds that
using the perforated shovel; include a P-value
in your analysis.
42. Scientists and engineers frequently wish to com-
pare two different techniques for measuring
or determining the value of a variable. In such
situations, it is useful to test whether the mean
difference in measurements is zero. The article
“Evaluation of the Deuterium Dilution Technique
Against the Test Weighing Procedure for the
Determination of Breast Milk Intake” (Amer. J.
Clin. Nutrit., 1983: 996–1003) reports the accom-
panying data on measuring the amount of milk
ingested by each of 14 randomly selected infants.
a. Is it plausible that the population distribution of
differences is normal?
b. Does it appear that the true average difference
between intake values measured by the two
methods is something other than zero? Deter-
mine the P-value of the test, and use it to reach
a conclusion at significance level .05.
c. What happens if the two-sample t test is (incor-
rectly) used? [Hint: s
1
¼ 352.970, s
2
¼ 234.042.]
10.3 Analysis of Paired Data 517