Devore J.L., Berk K.N. Modern Mathematical Statistics with Applications
Подождите немного. Документ загружается.


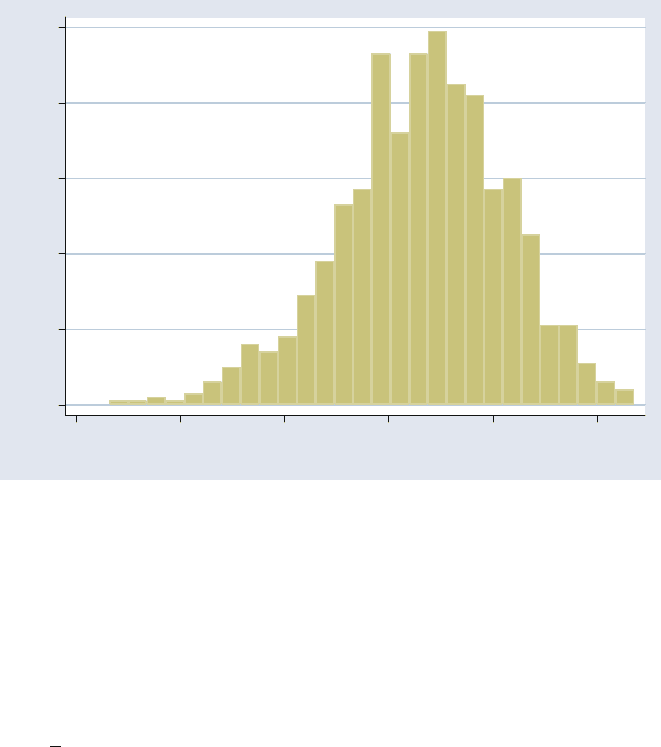
Let’s apply the b ootstrap to this problem. Begin with a sample from the boys,
standard deviation 5.264, and a sample from the girls, standard deviation 1.505,
with ratio 5.264/1.505 ¼ 3.498. We do this 999 times using the boot package in R,
and the resulting distribution of ratios is shown in Figure 10.13.
The bootstrap distribution is strongly skewed to the right. For a 95% confi-
dence interval, the percentile method uses the middle 95% of the bootstrap distri-
bution. The 2.5 percentile is 1.013 and the 97.5 percentile is 7.888, so the 95%
confidence interval for the population ratio of standard deviations is (1.013, 7.888).
The bias corrected and accelerated (BCa) refinement gives the interval (0.885,
7.382). These two intervals differ in an important respect, that the percentile
interval excludes 1 but the BCa refinement includes 1. In other words, the BCa
interval allows the possibility that the two standard deviations are the same, but the
percentile interval does not. We expect the BCa method to be an improvement, and
this is verified in the next example, where we see that the BCa result is consistent
with the results of a permutation test.
■
Consider using a permutation test for
H
0
: s
1
¼ s
2
.
Example 10.20 From Example 10.19 we know that the ratio of sample standard deviations for off-
task private speech, males versus females, is 8.72/2.85 ¼ 3.064. The idea of the
permutation tes t is to find out how unusual this value is if we blur the distinction
between males and females. That is, we remove the labels from the 18 males and
15 females and then consider all possible choices of 18 from the 33 children.
For each of these possible choices we find the ratio of the standard deviation of
the first 18 to the standard deviation of the last 15. The one-tailed P-value is the
fraction that are at least as big as the original value, 3.064. Because there are more
than a billion possible choices of 18 from 33, we instead selected 4999 random
choices. This gives a total of 5000 when the original select ion of males and females
is included. Of these, 432 are at least as big as 3.064, so the one-tailed P-value is
432/5000 ¼ .0864. For a two-tailed P-value we double this and get .1728. The
permutation test does not reject at the 5% level (or the 10% level) the null
hypothesis that the two population standard deviations are the same.
How does the permutation test result compare with the other results? Recall
that the F interval and the percentile interval ruled out the possibility that the two
standard deviations are the same, but the BCa refinement disagreed, because 1 is
included in the BCa interval. Taking it for granted that the permutation test is a valid
approach and the permutation test does not reject the equality of standard deviations,
the BCa interv al is the only one of the three CIs consistent with this result.
■
The Analysis of Paired Data
The bootstrap can be used for paired data if we work with the paired differences, as
in the paired t methods of Section 10.3.
Example 10.21 The private speech study was introduced in Examples 1.2 and 10.16. The study
included the percentage of intervals with on-task private speech for 33 children in
the first, second, and third grades. Here we will consider just the 15 girls in the first
and second grades. Is there a change in on-task private speech when the girls go
from the first to the second grade? Here are the percentages of intervals in which on
task private speech occurred, and also the differences.
538 CHAPTER 10 Inferences Based on Two Samples

Grade 1 Grade 2 Difference
25.7 18.6 7.1
36.0 17.4 18.6
27.6 2.6 25.0
29.7 0.9 28.8
36.0 1.5 34.5
35.1 14.1 21.0
42.0 3.3 38.7
7.6 1.6 6.0
14.1 0.0 14.1
25.0 1.5 23.5
20.2 0.0 20.2
24.4 2.1 22.3
10.4 18.4 8.0
21.1 2.6 18.5
5.6 26.0 20.4
Our null hypothesis is that the population mean difference between first- and
second-grade percentages is zero. Figure 10.14 shows a histogram for the differ-
ences, and it shows a negatively skewed distribution.
The paired t method of Section 10.3 requires normality, so the skewness
might invalidate this, but we will show the results here anyway for comparison
purposes. The mean of the differences is
d ¼ 16:66 with standard deviation
s
D
¼ 15.43, so the 95% confidence interval for the population mean difference is
d t
:025;151
s
D
ffiffiffiffiffi
15
p
¼ 16:66 2:145
15:43
ffiffiffiffiffi
15
p
¼ 16:66 8:54 ¼ð8:12; 25:20Þ
What about the bootstrap for paired data? The bootstrap focuses on the 15
differences and uses the method of Section 8.5. Using Stata, we draw 999 samples
of size 15 with replacement from the 15 differences, and these 999 samples
constitute the bootstrap distribution. Figure 10.15 shows the histogr am.
6
4
2
0
Frequency
−20 −10 10 20 300
girls ontask1 - ontask2
Figure 10.14 Histogram of differences for girls from Stata
10.6 Comparisons Using the Bootstrap and Permutation Methods 539
The histogram shows negative skewness, which is expected becau se of the
negative skewness shown in Figure 10.14 for the original sample. The skewness
implies that a symmetric confidence interval will not be entirely appropriate, but
we show it for comparison with the other intervals. The standard deviation of the
bootstrap distribution is s
boot
¼ 3.994, compared to the estimated standard error
s
D
=
ffiffiffiffiffi
15
p
¼ 15:43=
ffiffiffiffiffi
15
p
¼ 3:984. The 95% boots trap confidence interval is nar-
rower because of using z
.025
instead of t
.025,151
.
d z
:025
s
boot
¼ 16:66 1:96ð3:994Þ¼16:66 7:83 ¼ð8:83; 24:49Þ
This is slightly different from what Stata produces, because it uses t
.025,B1
¼
t
.025,9991
.where B is the siz e of the bootstrap sample.
The 95% percentile interval uses the 2.5 percentile ¼ 7.91 and the 97.5
percentile ¼ 23.97 of the bootstrap distribution, so the confidence interval is
(7.91, 23.97). This interval is to the left of the t intervals because of the negative
skewness of the bootstrap distribution. The bias corrected and accelerated refine-
ment from Stata yields the interval (6.43, 23.12), which is even farther to the left.
All of the intervals agree that there is a substantial population difference
between first grade and second grade. There is a strong reduction in the on-task
private speech of girls between first and second grades.
■
A permutation test for paired data involves permutations within the pairs.
Under the null hypothesis, the two observations in a pair have the same population
mean, so the population mean difference is zero, even if the order is reversed.
Therefore, we consider all possible orderings of the n pairs. Because there are two
possible orderings within each pair, there are 2
n
arrangements of n pairs. The one-
tailed P-value is the fraction of the 2
n
differences that are at least as extreme as the
observed value, and the two-tailed P-value is double this.
100
80
60
40
20
0
Frequency
0
5 10 15 20 25
bootstrap mean girls ontask1 - ontask2
Figure 10.15 Histogram of bootstrap differences for girls from Stata
540
CHAPTER 10 Inferences Based on Two Samples

Example 10.22 To see how the permutation test works for paired data, consider a scaled-down version
of the data from Example 10.21 with only the first three pairs. These are (25.7, 18.6),
(36.0, 17.4), (27.6, 2.6). They give a mean difference of (7.1 + 18.6 + 25.0)/3 ¼16.9.
Here are all 8 ¼ 2
3
permutations with the corresponding means.
Arrangements Mean difference
(25.7, 18.6) (36.0, 17.4) (27.6, 2.6) 16.90
(25.7, 18.6) (36.0, 17.4) (2.6, 27.6) .23
(25.7, 18.6) (17.4, 36.0) (27.6, 2.6) 4.50
(25.7, 18.6) (17.4, 36.0) (2.6, 27.6) 12.17
(18.6, 25.7) (36.0, 17.4) (27.6, 2.6) 12.17
(18.6, 25.7) (36.0, 17.4) (2.6, 27.6) 4.50
(18.6, 25.7) (17.4, 36.0) (27.6, 2.6) .23
(18.6, 25.7) (17.4, 36.0) (2.6, 27.6) 16.90
Because the mean difference for the original sample is the highest value of eight,
the one-taile d P-value is
1
8
¼ :125, and the two-tailed P-value is 2
1
8
¼ :25.
■
Example 10.23 Let’s now apply the permutation test to the paired data for the 15 girls of Example
10.21. In principle it is no harder to deal with the 2
n
¼ 2
15
¼ 32,768 arrangements
when all 15 pairs are included, but this exact approach is generally approximated
using a random sample. We used Stata to draw an additional 4999 samples. Of the
4999, none yielded a mean difference as large as the value of 16.66 obtained for the
original sample of 15 differences. Therefore, the one-tailed P-value is
1
5000
¼ :0002, and the two-tailed P -value is 2(.0002) ¼ .0004. Rejection of the
null hypothesis at the 5% level was to be expected, given that none of the
confidence intervals in Example 10.21 included 0.
It is interesting to compare the permutation test result with the t test of
Section 10.3. For testing the null hypothesis of 0 population mean difference, the
value of t is
d 0
s
D
=
ffiffiffiffiffi
15
p
¼
16:66
15:425=
ffiffiffiffiffi
15
p
¼ 4:183
The two-tailed P-value for this is .0009, not very different from the result of the
permutation test.
■
Exercises Section 10.6 (69–84)
69. A student project by Heather Kral studied
students on “lifestyle floors” of a dormitory in
comparison to students on other floors. On a life-
style floor the students share a common major,
and there are a faculty coordinator and resident
assistant from that department. Here are the grade
point averages of 30 students on lifestyle floors
(L) and 30 students on other floors (N):
L: 2.00, 2.25, 2.60, 2.90, 3.00, 3.00, 3.00, 3.00,
3.00, 3.20, 3.20, 3.25, 3.30, 3.30, 3.32, 3.50,
3.50, 3.60, 3.60, 3.70, 3.75, 3.75, 3.79, 3.80,
3.80, 3.90, 4.00, 4.00, 4.00, 4.00.
N: 1.20, 2.00, 2.29, 2.45, 2.50, 2.50, 2.50, 2.50,
2.65, 2.70, 2.75, 2.75, 2.79, 2.80, 2.80, 2.80,
2.86, 2.90, 3.00, 3.07, 3.10, 3.25, 3.50, 3.54,
3.56, 3.60, 3.70, 3.75, 3.80, 4.00.
10.6 Comparisons Using the Bootstrap and Permutation Methods 541
Notice that the lifestyle grade point averages
have a large number of repeats and the distribu-
tion is skewed, so there is some question about
normality.
a. Obtain a 95% confidence interval for the dif-
ference of population means using the method
based on the theorem of Section 10.2.
b. Obtain a bootstrap sample of 999 differences
of means. Check the bootstrap distribution for
normality using a normal probability plot.
c. Use the standard deviation of the bootstrap
distribution along with the mean and t critical
value from (a) to get a 95% confidence inter-
val for the difference of means.
d. Use the bootstrap sample and the percentile
method to obtain a 95% confidence interval
for the difference of means.
e. Compare your three confidence intervals. If
they are very similar, why do you think this is
the case?
f. Interpret your results. Is there a substantial dif-
ference between lifestyle and other floors? Why
do you think the difference is as big as it is?
70. In this application from major league baseball,
the populations represent an abstraction of what
the players can do, so the populations will vary
from year to year. The Colorado Rockies and the
Arizona Diamondbacks played nine games in
Phoenix and ten games in Denver in 2001. The
thinner air in Denver causes curve balls to curve
less and it allows fly balls to travel farther. Does
this mean that more runs are scored in Denver?
The numbers of runs scored by the two teams in
the nine Phoenix games (P) and ten Denver
games (D) are
P: 5.09 15.88 3 8.47 11.65 6.48 11.65 7.41 9.53
D: 10 18 15.56 19 8.1 14 13.76 10 20.12
10.59
The fractions occur because the numbers have
been adjusted for nine innings (54 outs). For
example, in the third Denver game the Rockies
won 10 to 7 on a home run with two out in the
bottom of the tenth inning, so there were 59 outs
instead of 54, and the number of runs is adjusted
to (54/59)(17) ¼ 15.56. We want to compare the
average runs in Denver with the average runs in
Phoenix.
a. Find a 95% confidence interval for the differ-
ence of population means using the method
given in the theorem of Section 10.2.
b. Obtain a bootstrap sample of 999 differences
of means. Check the bootstrap distribution for
normality using a normal probability plot.
c. Use the standard deviation of the bootstrap
distribution along with the mean and t critical
value from (a) to get a 95% confidence inter-
val for the difference of means.
d. Use the bootstrap sample and the percentile
method to obtain a 95% confidence interval
for the difference of means.
e. Compare your three confidence intervals. If
you used a standard normal critical value in
place of the t critical value in (c), why would
that make this interval more like the one in
(d)? Why should the three intervals be fairly
similar for this data set?
f. Interpret your results. Is there a substantial
difference between the two locations? Com-
pare the difference with what you thought it
would be. If you were a major league pitcher,
would you want to be traded to the Rockies?
71. For the data of Exercise 70 we want to compare
population medians for the runs in Denver versus
the runs in Phoenix.
a. Obtain a bootstrap sample of 999 differences
of medians. Check the bootstrap distribution
for normality using a normal probability
plot.
b. Use the standard deviation of the bootstrap
distribution along with the difference of the
medians in the original sample and the t criti-
cal value from Exercise 70(a) to get a 95%
confidence interval for the difference of
population medians.
c. Use the bootstrap sample and the percentile
method to obtain a 95% confidence interval
for the difference of population medians.
d. Compare the two confidence intervals.
e. How do the results for the median compare
with the results for the mean? In terms of
precision (measured by the width of the con-
fidence interval) which gives the best results?
72. For the data of Exercise 69 now consider testing
the hypothesis of equal population variances.
a. Carry out a 2-tailed test using the method of
Section 10.5. Recall that this method requires
the data to be normal, and the method is sensi-
tive to departures from normality. Check the
data for normality to see if the F test is justi-
fied.
b. Carry out a 2-tailed permutation test for the
hypothesis of equal population variances (or
standard deviations). Why does it not matter
whether you use variances or standard devia-
tions?
c. Compare the two results and summarize your
conclusions.
542
CHAPTER 10 Inferences Based on Two Samples
73. For the data of Exercise 69 we want a 95%
confidence interval for the ratio of population
standard deviations.
a. Use the method of Section 10.5. Recall that
this method requires the data to be normal,
and the method is sensitive to departures from
normality. Check the data for normality to see
if the F distribution can be used for the ratio
of sample variances.
b. With a bootstrap sample of size 999 use the
percentile method to obtain a 95% confidence
interval for the ratio of standard deviations.
c. Compare the two results and discuss the rela-
tionship of the results to those of Exercise 72.
74. Can the right diet help us cope with diseases asso-
ciated with aging such as Alzheimer’s disease?
A study (“Reversals of Age-Related Declines
in Neuronal Signal Transduction, Cognitive, and
Motor Behavioral Deficits with Blueberry,
Spinach, or Strawberry Dietary Supplement,” J.
Neurosci., 1999; 8114–8121) investigated the
effects of fruit and vegetable supplements in the
diet of rats. The rats were 19 months old, which is
aged by rat standards. The 40 rats were randomly
assigned to four diets, of which we will consider
just the blueberry diet and the control diet here.
After 8 weeks on their diets, the rats were given a
number of tests. We give the data for just one of the
tests, which measured how many seconds they
could walk on a rod. Here are the times for the
ten control rats (C) and ten blueberry rats (B):
C: 15.00 7.00 2.44 5.60 3.63 6.24 4.12 8.21
3.90 0.95
B: 5.12 9.38 18.77 15.03 6.67 7.91 7.38
15.09 11.57 8.98
The objective is to obtain a 95% confidence
interval for the difference of population means.
a. Determine a 95% confidence interval for the
difference of population means using the
method based on the Theorem of Section 10.2.
b. Obtain a bootstrap sample of 999 differences
of means. Check the bootstrap distribution for
normality using a normal probability plot.
c. Use the standard deviation of the bootstrap
distribution along with the mean and t critical
value from (a) to get a 95% confidence inter-
val for the difference of means.
d. Use the bootstrap sample and the percentile
method to obtain a 95% confidence interval
for the difference of means.
e. Compare your three confidence intervals.
If they are very similar, why do you think
this is the case? If you had used a critical
value from the normal table rather than the
t table, would the result of (c) agree better
with the result of (d)? Why?
f. Interpret your results. Do the blueberries make
a substantial difference?
75. For the data of Exercise 74, we now want to test
the hypothesis of equal population means.
a. Carry out a 2-tailed test using the method
based on the theorem of Section 10.2.
Although this test requires normal data, it will
still work pretty well for moderately nonnor-
mal data. Nevertheless, you should check the
data for normality to see if the test is justified.
b. Carry out a 2-tailed permutation test for the
hypothesis of equal population means.
c. Compare the results of (a) and (b). Would you
expect them to be similar for the data of this
problem? Discuss their relationship to the
results of Exercise 74. Summarize your con-
clusions about the effectiveness of blueberries.
76. Researchers at the University of Alaska have
been trying to find inexpensive feed sources for
Alaska reindeer growers (“Effects of Two Barley-
Based Diets on Body Mass and Intake Rates of
Captive Reindeer During Winter,” Poster Presen-
tation: School of Agriculture and Land Resources
Management, University of Alaska Fairbanks,
2002). They are focusing on Alaska-grown barley
because commercially available feed supplies are
too expensive for farmers. Typically, reindeer lose
weight in the fall and winter, and the researchers
are trying to find a feed to minimize this loss.
Thirteen pregnant reindeer were randomly divided
into two groups to be fed on two different varieties
of barley, thual and finaska. Here are the weight
gains between October 1 and December 15 for the
seven that were fed thual barley (T) and the six that
were fed finaska barley (F).
T: 5.83 11.5 5.5 1.33 3.83 3.33
7.17
F: 0.17 0.67 4 3 1.33 0.5.
The weight gains are all negative, indicating that
all of the animals lost weight. The thual barley is
less fibrous and more digestible, and the intake
rates for the two varieties of barley were very
nearly the same, so the experimenters expected
less weight loss for the thual variety.
a. Determine a 95% confidence interval for the
difference of population means using the
method given in the theorem of Section 10.2.
10.6 Comparisons Using the Bootstrap and Permutation Methods 543

b. Obtain a bootstrap sample of 999 differences of
means. Check the bootstrap distribution for
normality using a normal probability plot.
c. Use the standard deviation of the bootstrap
distribution along with the mean and t critical
value from (a) to get a 95% confidence interval
for the difference of means.
d. Use the bootstrap sample and the percentile
method to obtain a 95% confidence interval
for the difference of means.
e. Compare your three confidence intervals. If
they are very similar, why do you think this is
the case?
f. Interpret your results. Is there a substantial dif-
ference? Is it in the direction anticipated by the
experimenters?
77. For the data of Exercise 76 we want to test the
hypothesis of equal population variances.
a. Carry out a 2-tailed test using the method of
Section 10.5. Recall that this method requires
the data to be normal, and the method is sensi-
tive to departures from normality. Check the
data for normality to see if the F test is justified.
b. Carry out a 2-tailed permutation test for the
hypothesis of equal population variances (or
standard deviations).
c. Compare the two results and summarize your
conclusions.
78. Recall the data from Example 10.4 about the exper-
iment in the low-level college mathematics course.
Here again are the 85 final exam scores for those in
the experimental group (E) and the 79 final exam
scores for those in the control group (C):
E: 34 27 26 33 23 37 24 34 22 23 32 5
30 35 28 25 37 28 26 29 22 33 31 23
3729 0303426282732293133
28 21 34 29 33 6 8 29 36 7 21 30
28 34 28 35 30 34 9 38 9 27 25 33
923322537282326343234 0
24 30 36 28 38 35 16 37 25 34 38 34
31
C: 37 22 29 29 33 22 32 36 29 6 4 37
036 03227 7193526222828
32 35 28 33 35 24 21 0 32 28 27 8
30 37 9 33 30 36 28 3 8 31 29 9
0 0 35 25 29 3 33 33 28 32 39 20
32 22 24 20 32 7 8 33 29 9 0 30
26 25 32 38 22 29 29
a. Determine a 95% confidence interval for the
difference of population means using the z
method given in Section 10.1.
b. Obtain a bootstrap sample of 999 differences
of means. Check the bootstrap distribution for
normality using a normal probability plot.
c. Use the standard deviation of the bootstrap
distribution along with the mean and t critical
value from (a) to get a 95% confidence interval
for the difference of means.
d. Use the bootstrap sample and the percentile
method to obtain a 95% confidence interval
for the difference of means.
e. Compare your three confidence intervals. If
they are very similar, why do you think this is
the case? In the light of your results for (c) and
(d), does the z method of (a) seem to work,
regardless of normality? Explain.
f. Are your results consistent with the results of
Example 10.4? Explain.
79. For the data of Example 10.4 we want to try a
permutation test.
a. Carry out a 2-tailed permutation test for the
hypothesis of equal population means.
b. Compare the results for (a) and Example 10.4.
Why should you have expected (a) and Exam-
ple 10.4 to give similar results?
80. For the data of Example 10.4 it might be more
appropriate to compare medians.
a. Find the medians for the two groups. With the
help of a stem-and-leaf display for each group,
explain why the medians are much closer than
the means.
b. Do a two-tailed permutation test to compare
the medians. Given what you found in (a),
explain why the result of the permutation test
was to be expected.
81. Two students, Miguel Melo and Cody Watson, did
a study of textbook pricing. They compared prices
at the campus bookstore and Amazon.com. To be
fair, they included the sales tax for the local store
and added shipping for Amazon. Here are the
prices for a sample of 27 books.
Campus Amazon
100.41 106.94
99.34 113.94
51.53 61.44
20.45 31.59
28.69 29.89
70.66 83.94
98.81 107.74
111.56 115.99
97.22 108.29
(continued)
544
CHAPTER 10 Inferences Based on Two Samples

(continued)
61.89 78.44
70.39 82.94
58.17 65.74
108.38 122.09
61.63 63.49
59.50 69.24
87.66 73.84
26.56 33.98
44.63 40.39
96.69 117.99
18.06 27.94
103.06 115.74
14.61 24.69
77.03 88.04
99.34 113.94
81.81 90.74
48.88 58.94
76.50 91.94
a. Determine a 95% confidence interval for the
difference of population means using the
t method of Section 10.3. Check the data for
normality. Even if the normality assumption is
not valid here, explain why the t method (or the
z method of Section 10.1) might still be appro-
priate.
b. Based on the 27 differences, obtain a bootstrap
sample of 999 differences of means. Check the
bootstrap distribution for normality.
c. Use the standard deviation of the bootstrap
distribution along with the mean and t critical
value from (a) to get a 95% confidence interval
for the difference of means.
d. Use the bootstrap sample and the percentile
method to obtain a 95% confidence interval
for the difference of means.
e. Compare your three confidence intervals. In the
light of your results for (d), does nonnormality
invalidate the results of (a) and (c)? Explain.
f. Interpret your results. Is there a substantial
difference between the two ways to buy
books? Assuming that the populations remain
unchanged and you have just these two sources,
where would you buy?
82. Consider testing the hypothesis of equal popula-
tion means based on the data in Exercise 81.
a. Carry out a 2-tailed test using the method of
Section 10.3. Is the normality assumption satis-
fied here? If not, why might the test be valid
anyway?
b. Carry out a 2-tailed permutation test for the
hypothesis of equal population means.
c. Compare the results for (a) and (b). If the two
results are similar, does it tend to validate (a),
regardless of normality?
83. Compare bootstrapping with approximate permu-
tation tests in which random permutations are
used. Discuss the similarities and differences.
84. Assume that X is uniformly distributed on (1, 1)
and Y is split evenly between a uniform distribu-
tion on (101, 100) and a uniform distribution
on (100, 101). Thus the means are both 0, but the
variances differ strongly. We take random sam-
ples of size three from each distribution and
apply a permutation test for the null hypothesis
H
0
: m
1
¼ m
2
against the alternative
H
a
: m
1
< m
2
.
a. Show that the probability is
1
8
that all three of
the Y values come from (100, 101).
b. Show that, if all three Y values come from
(100, 101), then the P-value for the permuta-
tion test is .05.
c. Explain why (a) and (b) are in conflict. What is
the true probability that the permutation test
rejects the null hypothesis at the .05 level?
Supplementary Exercises (85–113)
85. A group of 115 University of Iowa students was
randomly divided into a build-up condition group
(m ¼ 56) and a scale-down condition group
(n ¼ 59). The task for each subject was to build
his or her own pizza from a menu of 12 ingredients.
The build-up group was told that a basic cheese
pizza costs $5 and that each extra ingredient would
cost 50 cents. The scale-down group was told that a
pizza with all 12 ingredients (ugh!!!) would cost
$11 and that deleting an ingredient would save 50
cents. The article “A Tale of Two Pizzas: Building
Up from a Basic Product Versus Scaling Down
from a Fully Loaded Product” (Market. Lett.,
2002: 335–344) reported that the mean number
of ingredients selected by the scale-down group
was significantly greater than the mean number for
the build-up group: 5.29 versus 2.71. The calcu-
lated value of the appropriate t statistic was 6.07.
Would you reject the null hypothesis of equality in
favor of inequality at a significance level of .05?
.01? .001? Can you think of other products aside
from pizza where one could build up or scale
Supplementary Exercises 545

down? [Note: A separate experiment involved stu-
dents from the University of Rome, but details
were a bit different because there are typically
not so many ingredient choices in Italy.]
86. Is the number of export markets in which a firm
sells its products related to the firm’s return on
sales? The article “Technology Industry Success:
Strategic Options for Small and Medium Firms”
(Gongming Qian, Lee Li, Bus. Horizons, Sept.–
Oct. 2003: 41–46) gave the accompanying informa-
tion on the number of export markets for one group
of firms whose return on sales was less than 10% and
another group whose return was at least 10%.
Return
Sample
Size
Sample
Mean
Sample
SD
Less than 10% 36 5.12 .57
At least 10% 47 8.26 1.20
The investigators reported that an appropriate test
of hypotheses resulted in a P-value between .01
and .05. What hypotheses do you think were
tested, and do you agree with the stated P-value
information? What assumptions if any are needed
in order to carry out the test? Can the plausibility of
these assumptions be investigated based just on the
foregoing summary data? Explain.
87. Suppose when using a two-sample t CI or test that
m < n, and show that df > m 1. This is why some
authors suggest using min(m 1, n 1) as df in
place of the formula given in the text. What impact
does this have on the CI and test procedure?
88. The accompanying summary data on compression
strength (lb) for 12 10 8 in. boxes appeared
in the article “Compression of Single-Wall
Corrugated Shipping Containers Using Fixed and
Floating Test Platens” (J. Testing Eval., 1992:
318–320). The authors stated that “the difference
between the compression strength using fixed and
floating platen method was found to be small
compared to normal variation in compression
strength between identical boxes.” Do you agree?
Method
Sample
Size
Sample
Mean
Sample
SD
Fixed 10 807 27
Floating 10 757 41
89. The authors of the article “Dynamics of Canopy
Structure and Light Interception in Pinus elliotti,
North Florida” (Ecol. Monogr., 1991: 33–51)
planned an experiment to determine the effect of
fertilizer on a measure of leaf area. A number of
plots were available for the study, and half were
selected at random to be fertilized. To ensure that
the plots to receive the fertilizer and the control
plots were similar, before beginning the experi-
ment tree density (the number of trees per hectare)
was recorded for eight plots to be fertilized and
eight control plots, resulting in the given data.
MINITAB output follows.
Fertilizer plots 1024 1216 1312 1280
1216 1312 992 1120
Control plots 1104 1072 1088 1328
1376 1280 1120 1200
Two sample T for fertilize vs. control
N Mean StDev SE Mean
fertilize 8 1184 126 44
control 8 1196 118 42
95% CI for mu fertilize-mu control:
(144, 120)
a. Construct a comparative boxplot and comment
on any interesting features.
b. Would you conclude that there is a significant
difference in the mean tree density for fertilizer
and control plots? Use a ¼ .05.
c. Interpret the given confidence interval.
90. Is the response rate for questionnaires affected
by including some sort of incentive to respond
along with the questionnaire? In one experiment,
110 questionnaires with no incentive resulted in
75 being returned, whereas 98 questionnaires that
included a chance to win a lottery yielded 66
responses (“Charities, No; Lotteries, No; Cash,
Yes,” Public Opinion Q., 1996: 542–562). Does
this data suggest that including an incentive
increases the likelihood of a response? State and
test the relevant hypotheses at significance level
.10 by using the P-value method.
91. The article “Quantitative MRI and Electrophysiol-
ogy of Preoperative Carpal Tunnel Syndrome in a
Female Population” (Ergonomics, 1997: 642–649)
reported that (473.3, 1691.9) was a large-sam-
ple 95% confidence interval for the difference
between true average thenar muscle volume
(mm
3
) for sufferers of carpal tunnel syndrome
and true average volume for nonsufferers. Calcu-
late and interpret a 90% confidence interval for
this difference.
546
CHAPTER 10 Inferences Based on Two Samples

92. The following summary data on bending strength
(lb-in/in) of joints is taken from the article
“Bending Strength of Corner Joints Constructed
with Injection Molded Splines” (Forest Products
J., April 1997: 89–92). Assume normal distribu-
tions.
Type
Sample
Size
Sample
Mean
Sample
SD
Without side coating 10 80.95 9.59
With side coating 10 63.23 5.96
a. Calculate a 95% lower confidence bound for
true average strength of joints with a side
coating.
b. Calculate a 95% lower prediction bound for the
strength of a single joint with a side coating.
c. Calculate a 95% confidence interval for the
difference between true average strengths for
the two types of joints.
93. An experiment was carried out to compare
various properties of cotton/polyester spun yarn
finished with softener only and yarn finished
with softener plus 5% DP-resin (“Properties
of a Fabric Made with Tandem Spun Yarns,”
Textile Res. J., 1996: 607–611). One particularly
important characteristic of fabric is its durability,
that is, its ability to resist wear. For a sample of
40 softener-only specimens, the sample mean
stoll-flex abrasion resistance (cycles) in the fill-
ing direction of the yarn was 3975.0, with a
sample standard deviation of 245.1. Another
sample of 40 softener-plus specimens gave a
sample mean and sample standard deviation of
2795.0 and 293.7, respectively. Calculate a con-
fidence interval with confidence level 99% for
the difference between true average abrasion
resistances for the two types of fabrics. Does
your interval provide convincing evidence that
true average resistances differ for the two types
of fabrics? Why or why not?
94. The derailment of a freight train due to the cata-
strophic failure of a traction motor armature bear-
ing provided the impetus for a study reported in
the article “Locomotive Traction Motor Armature
Bearing Life Study” (Lubricat. Engrg., Aug.
1997: 12–19). A sample of 17 high-mileage trac-
tion motors was selected, and the amount of cone
penetration (mm/10) was determined both for the
pinion bearing and for the commutator armature
bearing, resulting in the following data:
Motor 123456
Commutator 211 273 305 258 270 209
Pinion 226 278 259 244 273 236
Motor 789101112
Commutator 223 288 296 233 262 291
Pinion 290 287 315 242 288 242
Motor 13 14 15 16 17
Commutator 278 275 210 272 264
Pinion 278 208 281 274 268
Calculate an estimate of the population mean dif-
ference between penetration for the commutator
armature bearing and penetration for the pinion
bearing, and do so in a way that conveys informa-
tion about the reliability and precision of the esti-
mate. [Note: A normal probability plot validates
the necessary normality assumption.] Would you
say that the population mean difference has been
precisely estimated? Does it look as though popu-
lation mean penetration differs for the two types of
bearings? Explain.
95. The article “Two Parameters Limiting the Sensi-
tivity of Laboratory Tests of Condoms as Viral
Barriers” (J. Test. Eval., 1996: 279–286) reported
that, in brand A condoms, among 16 tears pro-
duced by a puncturing needle, the sample mean
tear length was 74.0 mm, whereas for the 14 brand
B tears, the sample mean length was 61.0 mm
(determined using light microscopy and scanning
electron micrographs). Suppose the sample stan-
dard deviations are 14.8 and 12.5, respectively
(consistent with the sample ranges given in the
article). The authors commented that the thicker
brand B condom displayed a smaller mean tear
length than the thinner brand A condom. Is this
difference in fact statistically significant? State
the appropriate hypotheses and test at a
¼ .05.
96. Information about hand posture and forces gener-
ated by the fingers during manipulation of various
daily objects is needed for designing high-
tech hand prosthetic devices. The article “Grip
Posture and Forces During Holding Cylindrical
Objects with Circular Grips” (Ergonomics, 1996:
1163–1176) reported that for a sample of 11
females, the sample mean four-finger pinch
strength (N) was 98.1 and the sample standard
deviation was 14.2. For a sample of 15 males,
the sample mean and sample standard deviation
were 129.2 and 39.1, respectively.
a. A test carried out to see whether true average
strengths for the two genders were different
Supplementary Exercises 547