Devore J.L., Berk K.N. Modern Mathematical Statistics with Applications
Подождите немного. Документ загружается.


b. Obtain the diagonal elements of the hat
matrix (leverages). Identify the point with
the highest leverage. What is unusual about
the point? Given the instructor’s assertion that
there were no students in the class less than
five feet tall, would you say that there was an
error? Give another reason that this student’s
measurements seem wrong.
c. For the other points with high leverages, what
distinguishes them from the points with ordi-
nary leverage values?
d. Examining the residuals, find another student
whose data might be wrong.
e. Discuss the elimination of questionable points
in order to obtain valid regression results.
104. Here is a method for obtaining the variance of the
residuals in simple (one predictor) linear regres-
sion, as given by Equation (12.13).
a. We have shown in Equations (12.26) and
(12.27) that Covð
^
YÞ¼s
2
H and
CovðY
^
YÞ¼ s
2
ðI HÞ. Show therefore
that VðY
i
^
Y
i
Þ¼s
2
Vð
^
Y
i
Þ.
b. Use part (a) and Vð
^
Y
i
Þ from Section 12.4 to
show that for simple linear regression,
VðY
i
^
Y
i
Þ¼s
2
1
1
n
ðx
i
xÞ
2
S
xx
"#
Supplementary Exercises (105–121)
105. The presence of hard alloy carbides in high
chromium white iron alloys results in excellent
abrasion resistance, making them suitable for
materials handling in the mining and materials
processing industries. The accompanying data
on x ¼ retained austenite content (%) and y ¼
abrasive wear loss (mm
3
) in pin wear tests with
garnet as the abrasive was read from a plot in
the article “Microstructure-Property Relation-
ships in High Chromium White Iron Alloys”
(Internat. Mater. Rev., 1996: 59–82).
x 4.6 17.0 17.4 18.0 18.5 22.4 26.5 30.0 34.0
y .66 .92 1.45 1.03 .70 .73 1.20 .80 .91
x 38.8 48.2 63.5 65.8 73.9 77.2 79.8 84.0
y 1.19 1.15 1.12 1.37 1.45 1.50 1.36 1.29
SAS output for Exercise 105
Analysis of Variance
Source DF Sum of Squares Mean Square F Value Prob > F
Model 1 0.63690 0.63690 15.444 0.0013
Error 15 0.61860 0.04124
C Total 16 1.25551
Root MSE 0.20308 R-square 0.5073
Dep Mean 1.10765 Adj R-sq 0.4744
C.V. 18.33410
Parameter Estimates
Variable DF
Parameter
Estimate
Standard
Error
T for H0:
Parameter ¼ 0
Prob
> |T|
INTERCEP 1 0.787218 0.09525879 8.264 0.0001
AUSTCONT 1 0.007570 0.00192626 3.930 0.0013
718 CHAPTER 12 Regression and Correlation

a. What proportion of observed variation in
wear loss can be attributed to the simple lin-
ear regression model relationship?
b. What is the value of the sample correlation
coefficient?
c. Test the utility of the simple linear regression
model using a ¼ .01.
d. Estimate the true average wear loss when
content is 50% and do so in a way that con-
veys information about reliability and preci-
sion.
e. What value of wear loss would you predict
when content is 30%, and what is the value of
the corresponding residual?
106. An investigation was carried out to study the
relationship between speed (ft/s) and stride rate
(number of steps taken/s) among female mara-
thon runners. Resulting summary quantities
included n ¼ 11, S(speed) ¼ 205.4, S(speed)
2
¼ 3880.08, S(rate) ¼ 35.16, S(rate)
2
¼ 112.681, and S(speed)(rate) ¼ 660.130.
a. Calculate the equation of the least squares
line that you would use to predict stride rate
from speed.
b. Calculate the equation of the least squares
line that you would use to predict speed from
stride rate.
c. Calculate the coefficient of determination
for the regression of stride rate on speed of
part (a) and for the regression of speed on
stride rate of part (b). How are these related?
d. How is the product of the two slope esti-
mates related to the value calculated in (c)?
107. In Section 12.4, we presented a formula for
the variance Vð
^
b
0
þ
^
b
1
x
Þ and a CI for
b
0
þ b
1
x
. Taking x
*
¼ 0 gives s
2
^
b
0
and a CI
for b
0
. Use the data of Example 12.12 to cal-
culate the estimated standard deviation of
^
b
0
and a 95% CI for the y-intercept of the true
regression line.
108. Show that SSE ¼ S
yy
^
b
1
S
xy
, which gives an
alternative computational formula for SSE.
109. Suppose that x and y are positive variables and
that a sample of n pairs results in r 1. If the
sample correlation coefficient is computed for
the (x, y
2
) pairs, will the resulting value also be
approximately 1? Explain.
110. Let s
x
and s
y
denote the sample standard devia-
tions of the observed x’s and y’s, respectively [so
s
2
x
¼
P
ðx
i
xÞ
2
=ðn 1Þ and similarly for s
2
y
].
a. Show that an alternative expression for the
estimated regression line
^
b
0
þ
^
b
1
x is
y ¼
y þ r
s
y
s
x
ðx x Þ
b. This expression for the regression line can
be interpreted as follows. Suppose r ¼ .5.
What then is the predicted y for an x that
lies 1 SD (s
x
units) above the mean of the
x
i
’s? If r were 1, the prediction would be for
y to lie 1 SD above its mean
y, but since
r ¼ .5, we predict a y that is only .5 SD (.5s
y
unit) above y. Using the data in Exercise 62
for a patient whose age is 1 SD below the
average age in the sample, by how many
standard deviations is the patient’s predicted
DCBG above or below the average DCBG
for the sample?
111. In biofiltration of wastewater, air discharged
from a treatment facility is passed through a
damp porous membrane that causes contami-
nants to dissolve in water and be transformed
into harmless products. The accompanying data
on x ¼ inlet temperature (
C) and y ¼ removal
efficiency (%) was the basis for a scatter plot
that appeared in the article “Treatment of
Mixed Hydrogen Sulfide and Organic Vapors
in a Rock Medium Biofilter”(Water Environ.
Res., 2001: 426–435).
Obs Temp Removal
%
Obs Temp Removal
%
1 7.68 98.09 17 8.55 98.27
2 6.51 98.25 18 7.57 98.00
3 6.43 97.82 19 6.94 98.09
4 5.48 97.82 20 8.32 98.25
5 6.57 97.82 21 10.50 98.41
6 10.22 97.93 22 16.02 98.51
7 15.69 98.38 23 17.83 98.71
8 16.77 98.89 24 17.03 98.79
9 17.13 98.96 25 16.18 98.87
10 17.63 98.90 26 16.26 98.76
11 16.72 98.68 27 14.44 98.58
12 15.45 98.69 28 12.78 98.73
13 12.06 98.51 29 12.25 98.45
14 11.44 98.09 30 11.69 98.37
15 10.17 98.25 31 11.34 98.36
16 9.64 98.36 32 10.97 98.45
Calculated summary quantities are
Sx
i
¼ 384:26, Sy
i
¼ 3149:04,
P
x
2
i
¼
5099:2412, Sx
i
y
i
¼ 37; 850:7762, and
P
y
2
i
¼
309;892:6548.
Supplementary Exercises 719

a. Does a scatter plot of the data suggest appro-
priateness of the simple linear regression
model?
b. Fit the simple linear regression model, obtain
a point prediction of removal efficiency when
temperature ¼ 10.50, and calculate the value
of the corresponding residual.
c. Roughly what is the size of a typical deviation
of points in the scatter plot from the least
squares line?
d. What proportion of observed variation in
removal efficiency can be attributed to the
model relationship?
e. Estimate the slope coefficient in a way that
conveys information about reliability and pre-
cision, and interpret your estimate.
f. Personal communication with the authors of
the article revealed that one additional observa-
tion was not included in their scatter plot: (6.53,
96.55). What impact does this additional obser-
vation have on the equation of the least squares
line and the values of s and r
2
?
112. Normal hatchery processes in aquaculture inev-
itably produce stress in fish, which may nega-
tively impact growth, reproduction, flesh
quality, and susceptibility to disease. Such
stress manifests itself in elevated and sustained
corticosteroid levels. The article “Evaluation of
Simple Instruments for the Measurement of
Blood Glucose and Lactate, and Plasma Protein
as Stress Indicators in Fish”(J. World Aquacult.
Soc., 1999: 276–284) described an experiment
in which fish were subjected to a stress protocol
and then removed and tested at various times
after the protocol had been applied. The accom-
panying data on x ¼ time (min) and y ¼ blood
glucose level (mmol/L) was read from a plot.
x 2 2 5 7 12 13 17 18 23 24 26 28
y 4.0 3.6 3.7 4.0 3.8 4.0 5.1 3.9 4.4 4.3 4.3 4.4
x 29 30 34 36 40 41 44 56 56 57 60 60
y 5.8 4.3 5.5 5.6 5.1 5.7 6.1 5.1 5.9 6.8 4.9 5.7
Use the methods developed in this chapter to
analyze the data, and write a brief report sum-
marizing your conclusions (assume that the
investigators are particularly interested in glu-
cose level 30 min after stress).
113. The article “Evaluating the BOD POD for
Assessing Body Fat in Collegiate Football
Players” (Med. Sci. Sports Exercise, 1999:
1350–1356) reports on a new air displacement
device for measuring body fat. The customary
procedure utilizes the hydrostatic weighing
device, which measures the percentage of
body fat by means of water displacement.
Here is representative data read from a graph
in the paper.
BOD 2.5 4.0 4.1 6.2 7.1 7.0 8.3 9.2 9.3 12.0 12.2
HW 8.0 6.2 9.2 6.4 8.6 12.2 7.2 12.0 14.9 12.1 15.3
BOD 12.6 14.2 14.4 15.1 15.2 16.3 17.1 17.9 17.9
HW 14.8 14.3 16.3 17.9 19.5 17.5 14.3 18.3 16.2
a. Use various methods to decide whether it is
plausible that the two techniques measure on
average the same amount of fat.
b. Use the data to develop a way of predicting
an HW measurement from a BOD POD
measurement, and investigate the effective-
ness of such predictions.
114. Reconsider the situation of Exercise 105, in
which x ¼ retained austenite content using a
garnet abrasive and y ¼ abrasive wear loss
were related via the simple linear regression
model Y ¼ b
0
+ b
1
x + e. Suppose that for a sec-
ond type of abrasive, these variables are also
related via the simple linear regression model
Y ¼ g
0
+ g
1
x + e and that V(e) ¼ s
2
for both
types of abrasive. If the data set consists of n
1
observations on the first abrasive and n
2
on the
second and if SSE
1
and SSE
2
denote the two
error sums of squares, then a pooled estimate of
s
2
is
^
s
2
¼ SSE
1
þ SSE
2
ðÞ= n
1
þ n
2
4ðÞ. Let
SS
x1
and SS
x2
denote
P
ðx
i
xÞ
2
for the data
on the first and second abrasives, respectively.
A test of H
0
: b
1
g
1
¼ 0 (equal slopes) is based
on the statistic
T ¼
^
b
1
^
g
1
^
s
ffiffiffiffiffiffiffiffiffiffiffiffiffiffiffiffiffiffiffiffiffiffi
1
ss
x1
þ
1
ss
x2
r
When H
0
is true, T has a t distribution with
n
1
+ n
2
4 df. Suppose the 15 observations
using the alternative abrasive give SS
x2
¼ 7152.5578,
^
g
1
¼ :006845, and SSE
2
¼ .51350. Using this along with the data of
Exercise 105, carry out a test at level .05 to see
whether expected change in wear loss associated
with a 1% increase in austenite content is identi-
cal for the two types of abrasive.
720 CHAPTER 12 Regression and Correlation

115. Show that the ANOVA version of the model
utility test discussed in Section 12.3 (with test
statistic F ¼ MSR/MSE) is in fact a likelihood
ratio test for H
0
: b
1
¼ 0 versus H
a
: b
1
6¼ 0. [Hint:
We have already pointed out that the least
squares estimates of b
0
and b
1
are the mle’s.
What is the mle of b
0
when H
0
is true? Now
determine the mle of s
2
both in O (when b
1
is
not necessarily 0) and in O
0
(when H
0
is true).]
116. Show that the t ratio version of the model utility
test is equivalent to the ANOVA F statistic ver-
sion of the test. Equivalent here means that
rejecting H
0
: b
1
¼ 0 when either t t
a/2,n2
or
t t
a/2, n2
is the same as rejecting H
0
when f
F
a,1,n2
.
117. When a scatter plot of bivariate data shows a
pattern resembling an exponentially increasing
or decreasing curve, the following multiplicative
exponential model is often used: Y ¼ ae
bx
e.
a. What does this multiplicative model imply
about the relationship between Y
0
¼ ln(Y) and
x?[Hint: take logs on both sides of the model
equation and let b
0
¼ ln(a), b
1
¼ b, e
0
¼ ln
(e), and suppose that e has a lognormal distri-
bution.]
b. The accompanying data resulted from an
investigation of how ethylene content of let-
tuce seeds (y, in nL/g dry wt) varied with
exposure time (x , in min) to an ethylene
absorbent (“Ethylene Synthesis in Lettuce
Seeds: Its Physiological Significance,” Plant
Physiol., 1972: 719–722).
x 2 20 20 30 405060708090100
y 408 274 196 137 90 78 51 40 30 22 15
Fit the simple linear regression model to this
data, and check model adequacy using the
residuals.
c. Is a scatter plot of the data consistent with the
exponential regression model? Fit this model
by first carrying out a simple linear regression
analysis using ln(y) as the dependent variable
and x as the independent variable. How good a
fit is the simple linear regression model to the
“transformed” data [the (x, ln(y)) pairs]? What
are point estimates of the parameters a and b?
d. Obtain a 95% prediction interval for ethylene
content when exposure time is 50 min. [Hint:
first obtain a PI for ln(y) based on the simple
linear regression carried out in (c).]
118. No tortilla chip afficionado likes soggy chips, so
it is important to identify characteristics of the
production process that produce chips with an
appealing texture. The following data on x ¼
frying time (sec) and y ¼ moisture content (%)
appeared in the article “Thermal and Physical
Properties of Tortilla Chips as a Function of
Frying Time” (J. Food Process. Preserv., 1995:
175–189).
x 5 10152025304560
y 16.3 9.7 8.1 4.2 3.4 2.9 1.9 1.3
a. Construct a scatter plot of the data and com-
ment.
b. Construct a scatter plot of the [ln(x), ln(y)]
pairs (i.e. transform both x and y by logs) and
comment.
c. Consider the multiplicative power model Y ¼
a
x
b
e. What does this model imply about the
relationship between y
0
¼ ln(y) and x
0
¼ ln
(x) (assuming that e has a lognormal distribu-
tion)?
d. Obtain a prediction interval for moisture con-
tent when frying time is 25 s. [Hint: first carry
out a simple linear regression of y
0
on x
0
and
calculate an appropriate prediction interval.]
119. The article “Determination of Biological Matu-
rity and Effect of Harvesting and Drying Condi-
tions on Milling Quality of Paddy” (J. Agric.
Engr. Res., 1975: 353–361) reported the follow-
ing data on date of harvesting (x, the number of
days after flowering) and yield of paddy, a grain
farmed in India (y, in kg/ha).
x 16 18 20 22 24 26 28 30
y 2508 2518 3304 3423 3057 3190 3500 3883
x 32 34 36 38 40 42 44 46
y 3823 3646 3708 3333 3517 3241 3103 2776
a. Construct a scatter plot of the data. What
model is suggested by the plot?
b. Use a statistical software package to fit the
model suggested in (a) and test its utility.
c. Use the software package to obtain a predic-
tion interval for yield when the crop is har-
vested 25 days after flowering, and also a
confidence interval for expected yield in
situations where the crop is harvested
Supplementary Exercises 721

25 days after flowering. How do these two
intervals compare to each other? Is this result
consistent with what you learned in simple
linear regression? Explain.
d. Use the software package to obtain a PI and
CI when x ¼ 40. How do these intervals com-
pare to the corresponding intervals obtained
in (c)? Is this result consistent with what you
learned in simple linear regression? Explain.
e. Carry out a test of hypotheses to decide
whether the quadratic predictor in the model
fit in (b) provides useful information about
yield (presuming that the linear predictor
remains in the model).
120. The article “Validation of the Rockport Fitness
Walking Test in College Males and Females”
(Res. Q. Exercise Sport, 1994: 152–158) recom-
mended the following estimated regression equa-
tion for relating y ¼ VO
2
max (L/min, a measure
of cardiorespiratory fitness) to the predictors x
1
¼ gender (female ¼ 0, male ¼ 1), x
2
¼ weight
(lb), x
3
¼ 1-mile walk time (min), and x
4
¼
heart rate at the end of the walk (beats/min):
y ¼ 3:5959 þ :6566x
1
þ :0096x
2
:0996x
3
:0080x
4
a. How would you interpret the estimated coef-
ficient .0996?
b. How would you interpret the estimated coef-
ficient .6566?
c. Suppose that an observation made on a male
whose weight was 170 lb, walk time was
11 min, and heart rate was 140 beats/min
resulted in VO
2
max ¼ 3.15. What would
you have predicted for VO
2
max in this situa-
tion, and what is the value of the
corresponding residual?
d. Using SSE ¼ 30.1033 and SST ¼ 102.3922,
what proportion of observed variation in
VO
2
max can be attributed to the model rela-
tionship?
e. Assuming a sample size of n ¼ 20, carry out a
test of hypotheses to decide whether the cho-
sen model specifies a useful relationship
between VO
2
max and at least one of the pre-
dictors.
121. A sample of n ¼ 20 companies was selected, and
the values of y ¼ stock price and k ¼ 15 predic-
tor variables (such as quarterly dividend, previ-
ous year’s earnings, and debt ratio) were
determined. When the multiple regression
model using these 15 predictors was fit to the
data, R
2
¼ .90 resulted.
a. Does the model appear to specify a useful
relationship between y and the predictor vari-
ables? Carry out a test using significance level
.05. [Hint: The F critical value for 15 numer-
ator and 4 denominator df is 5.86.]
b. Based on the result of part (a), does a high R
2
value by itself imply that a model is useful?
Under what circumstances might you be sus-
picious of a model with a high R
2
value?
c. With n and k as given previously, how large
would R
2
have to be for the model to be
judged useful at the .05 level of significance?
Bibliography
Chatterjee, Samprit, Ali Hadi, and Bertram Price,
Regression Analysis by Example (4th ed.), Wiley,
New York, 2006. A brief but informative discus-
sion of selected topics.
Daniel, Cuthbert, and Fred Wood, Fitting Equations to
Data (2nd ed.), Wiley, New York, 1980. Contains
many insights and methods that evolved from the
authors’ extensive consulting experience.
Draper, Norman, and Harry Smith, Applied Regression
Analysis (3rd ed.), Wiley, New York, 1998. A com-
prehensive and authoritative book on regression.
Hoaglin, David, and Roy Welsch, “The Hat Matrix
in Regression and ANOVA,” American Statisti-
cian, 1978: 17–23. Describes methods for
detecting influential observations in a regression
data set.
Kutner, Michael, Christopher Nachtsheim, John
Neter, and William Li, Applied Linear Statistical
Models (5th ed.), McGraw-Hill, New York, 2005.
The first 14 chapters constitute an extremely
readable and informative survey of regression
analysis.
722
CHAPTER 12 Regression and Correlation

CHAPTER THIRTEEN
Goodness-of-Fit
Tests and
Categorical Data
Analysis
Introduction
In the simplest type of situation considered in this chapter, each observation
in a sample is classified as belonging to one of a finite number of categories
(For example, blood type could be one of the four categories O, A, B, or AB).
With
p
i
denoting the probability that any particular observation belongs in
category
i
(or the proportion of the population belonging to category
i
), we wish
to test a null hypothesis that completely specifies the values of all the
p
i
’s (such
as
H
0
:
p
1
¼ .45,
p
2
¼ .35,
p
3
¼ .15,
p
4
¼ .05, when there are four categories).
The test statistic will be a measure of the discrepancy between the observed
numbers in the categories and the expected numbers when
H
0
is true. Because a
decision will be reached by comparing the computed value of the test statistic to
a critical value of the chi-squared distribution, the procedure is called a chi-squared
goodness-of-fit test.
Sometimes the null hypothesis specifies that the
p
i
’s depend on some
smaller number of parameters without specifying the values of these parameters.
For example, with three categories the null hypothesis might state that
p
1
¼ y
2
,
p
2
¼ 2y(1 – y), and
p
3
¼ (1 – y)
2
. For a chi-squared test to be performed, the
values of any unspecified parameters must be estimated from the sample data.
These problems are discussed in Section 13.2. The methods are then applied to test
a null hypothesis that states that the sample comes from a particular family of
distributions, such as the Poisson family (with
l
estimated from the sample) or the
normal family (with m and s estimated).
Chi-squared tests for two different situations are presented in Section 13.3.
In the first, the null hypothesis states that the
p
i
’s are the same for several different
populations. The second type of situation involves taking a sample from a single
population and classifying each individual with respect to two different categorical
J.L. Devore and K.N. Berk, Modern Mathematical Statistics with Applications, Springer Texts in Statistics,
DOI 10.1007/978-1-4614-0391-3_13,
#
Springer Science+Business Media, LLC 2012
723

factors (such as religious preference and political party registration). The null
hypothesis in this situation is that the two factors are independent within the
population.
13.1
Goodness-of-Fit Tests When Category
Probabilities Are Completely Specified
A binomial experiment consists of a sequence of independent trials in which each
trial can result in one of two possible outcomes, S (for success) and F (for failure).
The probability of success, denoted by p, is assumed to be constant from trial to
trial, and the number n of trials is fixed at the outset of the experiment. In Chapter 9,
we presented a large-sample z test for testing H
0
: p ¼ p
0
. Notice that this null
hypothesis specifies both P(S) and P(F ), since if P(S) ¼ p
0
, then P(F ) ¼ 1–p
0
.
Denoting P(F )byq and 1 – p
0
by q
0
, the null hypot hesis can alternatively be
written as H
0
: p ¼ p
0
, q ¼ q
0
. The z test is two-tailed when the alternative of
interest is p 6¼ p
0
.
A multinomial experiment generalizes a binomial experiment by allowing
each trial to result in one of k possible outcomes, where k 2. For example,
suppose a store accepts three different types of credit cards. A multinomial experi-
ment would result from observing the type of credit card used—type 1, type 2, or
type 3—by each of the next n customers who pay with a credit card. In general, we
will refer to the k possible outcomes on any given trial as categories, and p
i
will
denote the probability that a trial results in category i. If the experiment consists of
selecting n individuals or objects from a population and categorizing each one, then
p
i
is the proportion of the population falling in the ith category (such an experiment
will be approximately multinom ial provided that n is much smaller than the
population size).
The null hypothesis of interest will specify the value of each p
i
. For example,
in the case k ¼ 3, we might have H
0
: p
1
¼ .5, p
2
¼ .3, p
3
¼ .2. The alternative
hypothesis will state that H
0
is not true—that is, that at least one of the p
i
’s has a
value different from that asserted by H
0
(in which case at least two must be
different, since they sum to 1). The symbol p
i0
will represent the value of p
i
claimed
by the null hypothesis. In the example just given, p
10
¼ .5, p
20
¼ .3, and p
30
¼ .2.
Before the multinomial experiment is performed, the number of trials that
will result in category i (i ¼ 1, 2, ... ,ork) is a random variable—j ust as the
number of successes and the number of failures in a binomial experiment are
random variables. This random variable will be denoted by N
i
and its observed
value by n
i
. Since each trial results in exactly one of the k categories, SN
i
¼ n, and
the same is true of the n
i
’s. As an example, an experiment with n ¼ 100 and k ¼ 3
might yield N
1
¼ 46, N
2
¼ 35, and N
3
¼ 19.
The expected number of successes and expected number of failures in a
binomial experiment are np and nq, respective ly. When H
0
: p ¼ p
0
, q ¼ q
0
is
true, the expected numbers of successes and failures are np
0
and nq
0
, respectively.
Similarly, in a multinomial experiment the expected number of trials resulting in
category i is E(N
i
) ¼ np
i
(i ¼ l, ..., k). When H
0
: p
1
¼ p
10
, ... , p
k
¼ p
k0
is true,
these expected values become E(N
1
) ¼ np
10
, E(N
2
) ¼ np
20
, ... , E(N
k
) ¼ np
k0
.
For the case k ¼ 3, H
0
: p
1
¼ .5, p
2
¼ .3, p
3
¼ .2, and n ¼ 100, we have
E(N
1
) ¼ 100(.5) ¼ 50, E(N
2
) ¼ 30, and E(N
3
) ¼ 20 when H
0
is true. The n
i
’s
724 CHAPTER 13 Goodness-of-Fit Tests and Categorical Data Analysis
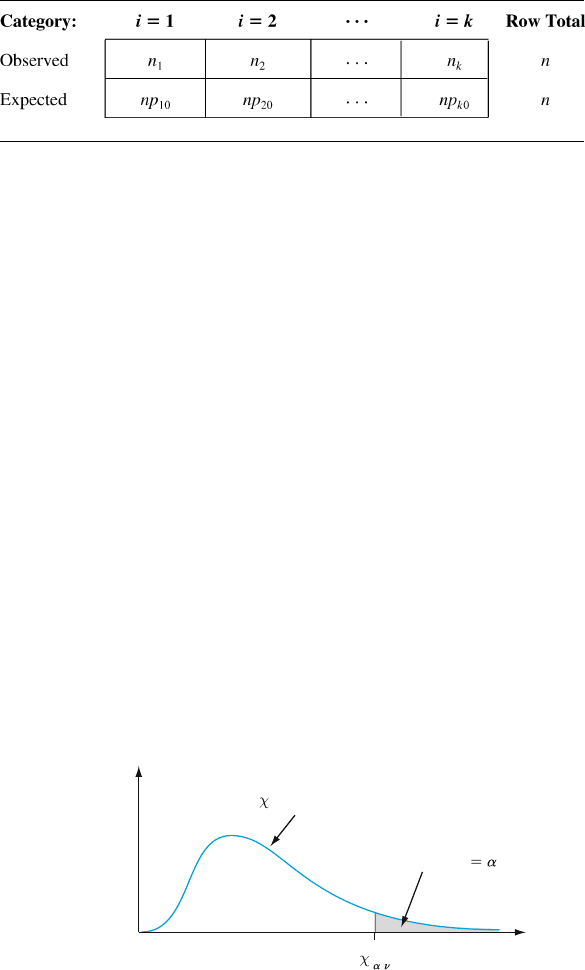
are often displayed in a tabular format consisting of a row of k cells, one for each
category, as illustrated in Table 13.1. The expected values when H
0
is true are
displayed just below the observed values. The N
i
’s and n
i
’s are usually referred to
as observed cell counts (or observed cell frequencies), and np
10
, np
20
, ..., np
k0
are
the corresponding expected cell counts under H
0
.
The n
i
’s should all be reasonably close to the corresponding np
i0
’s when
H
0
is true. On the other hand, several of the observed counts should differ
substantially from these expected counts when the actual values of the p
i
’s differ
markedly from what the null hypothesis asserts. The test proce dure involves
assessing the discrepancy between the n
i
’s and the np
i0
’s, with H
0
being rejected
when the discrepancy is sufficiently large. It is natural to base a measure of
discrepancy on the squared deviations (n
1
–np
10
)
2
,(n
2
–np
20
)
2
, ... ,(n
k
–np
k0
)
2
.
An obvious way to combine these into an overall measure is to add them together
to obtain S(n
i
–np
i0
)
2
. However, suppose np
10
¼ 100 and np
20
¼ 10. Then if
n
1
¼ 95 and n
2
¼ 5, the two categories contribute the same squared deviations
to the proposed measure. Yet n
1
is only 5% less than what would be expected when
H
0
is true, whereas n
2
is 50% less. To take relative magnitudes of the deviations
into account, we will divide each squared deviation by the corresponding expected
count and then combine.
Before giving a more detailed description, we mus t discuss the chi-squared
distribution. This distribution was introduced in Section 4.4, discussed in
Section 6.4, and used in Chapter 8 to obtain a confidence interval for the variance
s
2
of a normal population. The chi-squared distribution has a single parameter,
called the number of degrees of freedom (df) of the distribution, with possible
values 1, 2, 3, ... . Analogous to the critical value t
a,n
for the t distribution, w
2
a; n
is
the value such that a of the area under the w
2
curve with n df lies to the right of w
2
a;n
(see Figure 13.1). Selected values of w
2
a;n
are given in Appendix Table A.6.
Table 13.1 Observed and expected cell counts
0
Shaded area
2
,
v
curve
2
Figure 13.1 A critical value for a chi-squared distribution
13.1 Goodness-of-Fit Tests When Category Probabilities Are Completely Specified 725

THEOREM
Provided that np
i
5 for every i (i ¼ 1, 2, ..., k), the variable
w
2
¼
X
k
i¼1
ðN
i
np
i
Þ
2
np
i
¼
X
all cells
ðobserved expectedÞ
2
expected
has approximately a chi-squared distribution with k – 1 df.
The fact that df ¼ k – 1 is a consequence of the restriction SN
i
¼ n. Although there are k
observed cell counts, once any k – 1 are known, the remaining one is uniquely deter-
mined. That is, there are only k – 1 “freely determined” cell counts, and thus k –1df.
If np
i0
is substituted for np
i
in w
2
, the resulting test statistic has approximately
a chi-squared distribution when H
0
is true. Rejection of H
0
is appropriate when
w
2
c (because large discrepancies between observed and expected count s lead to
a large value of w
2
), and the choice c ¼ w
2
a;k1
yields a test with significance level a.
Null hypothesis: H
0
: p
1
¼ p
10
, p
2
¼ p
20
, ... , p
k
¼ p
k0
Alternative hypothesis: H
a
: at least one p
i
does not equal p
i0
Test statistic value: w
2
¼
P
all cells
(observedexpected)
2
expected
¼
P
k
i¼1
ðn
i
np
i 0
Þ
2
np
i 0
Rejection region: w
2
w
2
a; k1
Example 13.1 If we focus on two different characteristics of an organism, each controlled by a
single gene, and cross a pure strain having genotype AABB with a pure strain
having genotype aabb (capital letters denoting dominant alleles and small letters
recessive alleles), the resulting genotype will be AaBb. If these first-generation
organisms are then crossed among themselves (a dihybrid cross), there will be four
phenotypes depending on whether a dominan t allele of either type is present.
Mendel’s laws of inheritance imply that these four phenotypes should have prob-
abilities 9/16, 3/16, 3/16, and 1/16 of arising in any given dihybrid cross.
The article “Linkage Studies of the Tomato” ( Trans. Royal Canad. Institut.,
1931: 1–19) reports the following data on phenotypes from a dihybrid cross of tall
cut-leaf tomatoes with dwarf pota to-leaf tomatoes. There are k ¼ 4 categories
corresponding to the four possible phenotypes, with the null hypothesis being
H
0
: p
1
¼
9
16
; p
2
¼
3
16
; p
3
¼
3
16
; p
4
¼
1
16
The expected cell counts are 9n/16, 3n/16, 3n/16, and n/16, and the test is based on
k –1¼ 3 df. The total sample size was n ¼ 1611. Observed and expected counts
are given in Table 13.2.
Table 13.2 Observed and expected cell counts for Example 13.1
726 CHAPTER 13 Goodness-of-Fit Tests and Categorical Data Analysis

The contribution to w
2
from the first cell is
ðn
1
np
10
Þ
2
np
10
¼
ð926 906:2Þ
2
906:2
¼ :433
Cells 2, 3, and 4 contribute .658, .274, and .108, respectively, so
w
2
¼ .433 + .658 + .274 + .108 ¼ 1.473. A test with significance level .10
requires w
2
:10;3
, the number in the 3 df row and .10 column of Appendix Table
A.6. This critical value is 6.251. Since 1.473 is not at least 6.251, H
0
cannot be
rejected even at this rather large level of significance. The data is quite consistent
with Mendel’s laws.
■
Consider the special case of just two categor ies, k ¼ 2. The null hypothesis
in this case can be stated as H
0
: p
1
¼ p
10
, because the relations p
2
¼ 1–p
1
and
p
20
¼ 1–p
10
make the inclusion of p
2
¼ p
20
in H
0
redundant. The alternative
hypothesis is H
a
: p
1
6¼ p
10
. These hypotheses can also be tested using a two-tailed
z test with test statistic
Z ¼
ðN
1
=nÞp
10
ffiffiffiffiffiffiffiffiffiffiffiffiffiffiffiffiffiffiffiffiffiffiffiffi
p
10
ð1 p
10
Þ
n
r
¼
^
p
1
p
10
ffiffiffiffiffiffiffiffiffiffiffiffiffi
p
10
p
20
n
r
Surprisingly, the two test procedures are completely equivalent. This is
because it can be shown that Z
2
¼ w
2
and ðz
a
=2
Þ
2
¼ w
2
a;1
, so that w
2
w
2
a;1
if and
only if (iff) |Z| z
a/2
.
1
If the alternative hypothesis is either H
a
: p
1
> p
10
or H
a
:
p
1
< p
10
, the chi-squared test cannot be used. One must then revert to an upper- or
lower-tailed z test.
As is the case with all test procedures, one must be careful not to confuse
statistical significance with practical significance. A computed w
2
that exceeds
w
2
a;k1
may be a result of a very large sample size rather than any practical
differences between the hypothesized p
i0
’s and true p
i
’s. Thus if
p
10
¼ p
20
¼ p
30
¼
1
3
, but the true p
i
’s have values .330, .340, and .330, a large
value of w
2
is sure to arise with a sufficiently large n. Be fore rejecting H
0
, the
^
p
i
’s should be examined to see whether they suggest a model different from that
of H
0
from a practical point of view.
P-Values for Chi-Squared Tests
The chi-squared tests in this chapter are all upper-tailed, so we focus on this case.
Just as the P-value for an upper-tailed t test is the area under the t
n
curve to the right
of the calculated t, the P-value for an upper-tailed chi-squared test is the area under
the w
2
n
curve to the right of the calculated w
2
. Appendix Table A.6 provides limited
P-value information because only five upper-tail critical values are tabulated for
each different n. We have therefore included Appendix Table A.10, analogous to
Table A.7, that facilitates making more precise P-value statements.
1
The fact that (z
a/2
)
2
¼ w
2
a;1
is a consequence of the relationship between the standard normal distribution
and the chi-squared distribution with 1 df; if Z N(0, 1), then Z
2
has a chi-squared distribution with
n ¼ 1. See the first proposition in Section 6.4.
13.1 Goodness-of-Fit Tests When Category Probabilities Are Completely Specified
727