Gates A.E., Ritchie D. Encyclopedia of Earthquakes and Volcanoes
Подождите немного. Документ загружается.

Segara Anak caldera, Lombok, Indonesia Located on the
island of Lombok, this caldera includes Gunung Rinjani, a
stratovolcano on its east rim, and Gunung Baru, a cone
within the caldera. A strong earthquake in 1884 preceded an
eruption of Gunung Rinjani, which is said to have expelled
smoke and fire for several days. Another earthquake in
1898 was suspected of having originated at Gunung Rinjani.
Two strong earthquakes occurred under Gunung Rinjani in
November 1903, and the volcano was reported smoking in
November 1915. Several weeks after an earthquake early in
1966, a climber reported seeing a flow of lava from Gunung
Baru and detecting a strong smell of sulfur. The most recent
eruption was in 1994 when a lahar killed 30 people. The
eruption produced ash clouds but was relatively mild.
segmentation Many faults are not a single continental-
scale plane of weakness but a series of small fault pieces or
segments that are stuck together. The slip on a fault to pro-
duce an earthquake typically occurs along a single segment.
Segmentation may form from bends in fault planes, intersec-
tions with other faults, or lateral changes in rock units.
seiche A periodic oscillation in an enclosed, or nearly
enclosed, body of water. Basically, seiches are large waves
that slosh back and forth in an enclosed basin. These waves
can be large (up to 100+ feet [30.8 m]) and cause considerable
destruction. Earthquakes may contribute to producing seiches.
seismic gap This expression refers to a recently “quiet” por-
tion of an active earthquake-generating fault. This section
forms a gap on a map of recent earthquake epicenters along
the fault and may be a likely spot for strong earthquakes in
the future because the forces that generate earthquakes may
be building up along the gap and “waiting” to be released.
seismic moment The seismic moment of an earthquake is
the measure of its strength based upon the area of the fault
rupture, the amount of slip on the fault in the event, and the
force required to overcome the friction or strength of the
rock opposing the movement. Seismic moment is usually cal-
culated from the amplitude spectra of seismic waves on a
seismogram.
seismic sea wave See tsunami.
seismic velocity The speed at which earthquake waves
travel through Earth. The speed is a function of the rock
through which the waves travel. It depends upon the elastic
moduli of the rock. There are measures of incompressibility
and resistance to shear and torsion as well as density that
determine the speed. Basically, seismic waves travel faster in
hard, tight rock than in sediments or soft (ductile) rocks
or liquids.
seismogram A seismograph records the arrivals of incom-
ing seismic waves through time. It prints those records on a
seismogram. The piece of paper showing the wiggly lines of
an earthquake’s, P-waves, s-waves, or surface waves is a
seismogram.
seismograph A device for detecting and recording the
vibrations of earthquakes.
See also seismology.
seismologist A geophysicist who studies earthquakes and
earthquake phenomena. Richter scales, Mercalli inten-
sities, fault plane solutions, and focus and epicenter
locations as well as a full analysis of the seismic waves and
damage are conducted by seismologists.
See also seismology.
seismology The scientific study of earthquakes. Earth-
quakes generate several kinds of waves. These are sometimes
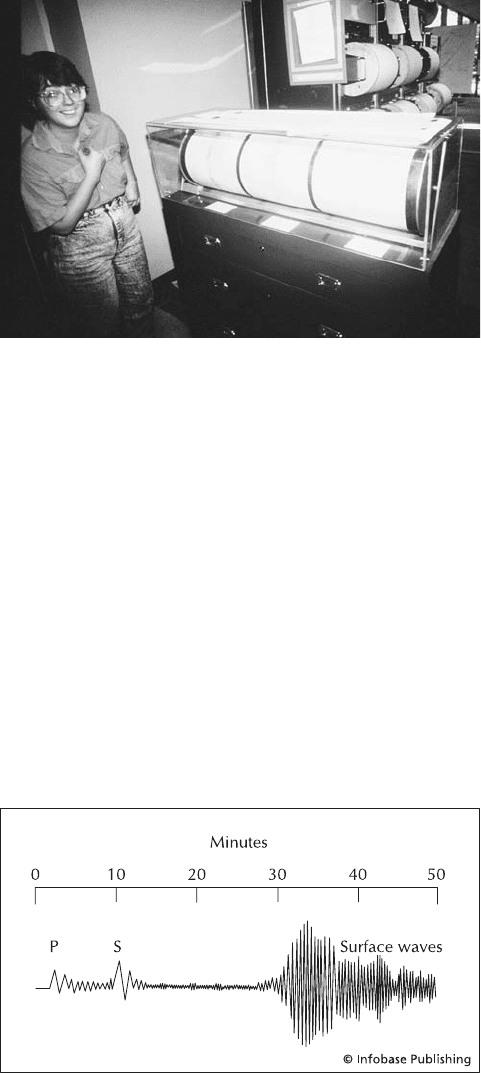
The USGS seismic station at Menlo Park, California. The three recorders
show vibrations in the three dimensions, records shown are those of the
1989 Loma Prieta earthquake. (Courtesy of the USGS)
Typical seismogram that is registered on a seismograph. The wiggly line
is what appears on a seismograph as an earthquake occurs. Each wiggle
represents a different kind of wave: P-wave, S-wave, or surface waves
(both Rayleigh and Love waves). The great delay between each arrival
means that the focus of the earthquake is very far away because each
wave travels at a different velocity. If the focus was closer, the arrivals
would be closer together. If the seismograph was at the focus, all waves
would be grouped together in one set of wiggles in which no specific
wave type could be discerned. Notice that the surface waves give higher
amplitudes and longer durations. They cause the most damage.
232 Segara Anak
classified in two categories: surface waves and body waves.
Surface waves, are confined to the surface and shallow sub-
surface of Earth like ocean waves are confined to the surface
and near surface of the water. They are very slow. There are
two kinds of surface waves, named Love waves and Ray-
leigh waves after their discoverers. Love waves move like a
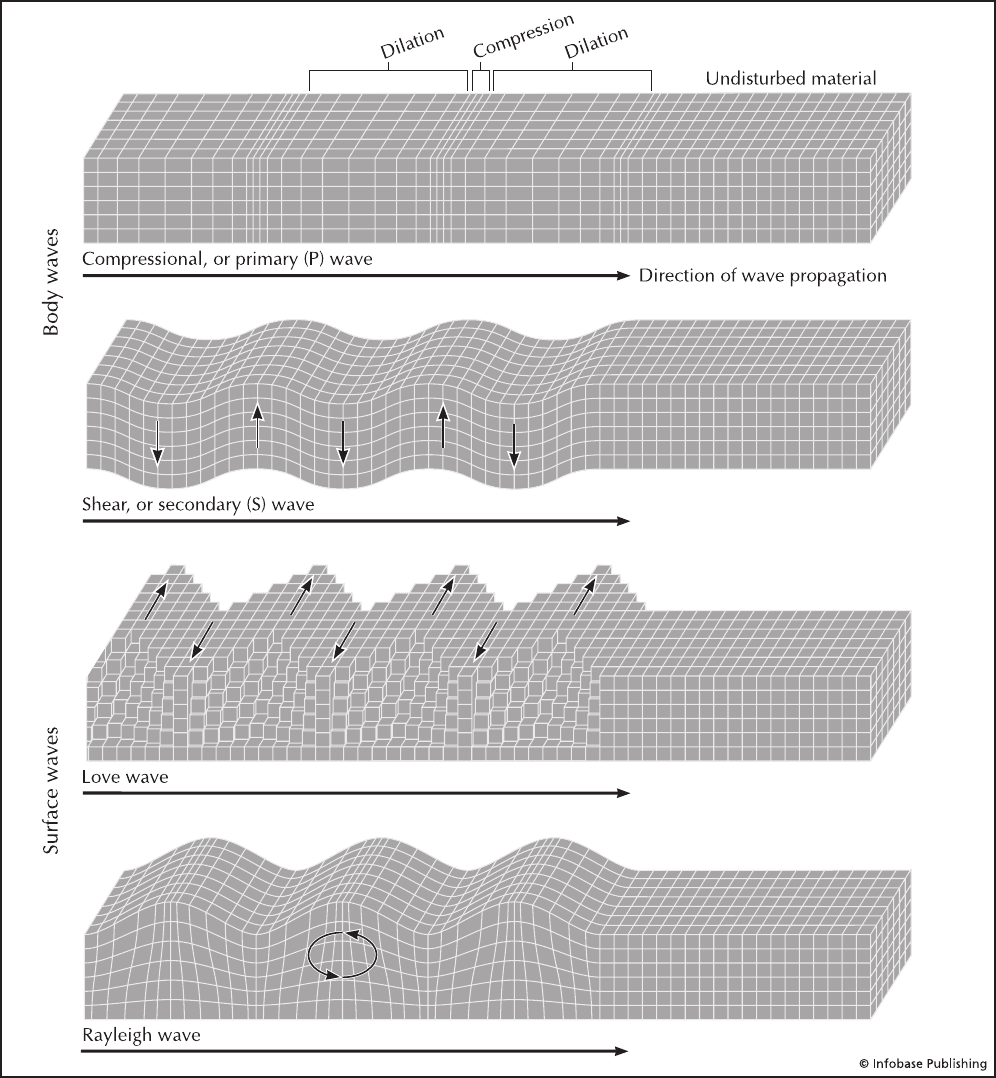
Diagram showing the response of rock as different types of seismic waves pass through. No permanent deformation of the rocks occurs from the passage
of these waves. Body waves include P- and S-waves. A P-wave is like a low speed accident, where the bumper is compressed at impact but expands
(dilation) and recovers after the impact. An S-wave is like whipping a jump rope. In surface waves, the ground surface moves like an ocean wave in a
Rayleigh wave. In Love waves, the surface moves from side to side as the wave passes through. It causes structures to fall over sideways.
seismology 233
snake. They exhibit horizontal shear, meaning a side-to-side
or transverse shaking motion as they go forward. They cause
buildings and other structures to fall over sideways. Rayleigh
waves make the surface of Earth move like an ocean wave.
They involve an elliptical motion of the ground that is actu-
ally retrograde, or opposite to the direction of travel. In other
words, for a wave moving to the right, the movement of the
rock will be counterclockwise. Body waves are also called P-
waves and s-waves, named for the arrival times: P is the pri-
mary or first arrival, and S is the secondary arrival. P-waves
are the fastest of the seismic waves. They move by compres-
sion and subsequent rarefaction of the rock media through
which they move, in much the same manner as sound waves
traveling through the air or vibrations from a hammer strike
on a rock. S-waves move in a transverse motion like the wave
generated by whipping a jump rope. They also have a similar
motion to a Love wave and are slower than P-waves.
FACTORS AFFECTING DESTRUCTION FROM EARTHQUAKES
The extent of destruction from an earthquake depends on
several factors:
Magnitude and Intensity
Earthquake magnitude refers to how much energy the earth-
quake released. Magnitude is not always proportional to
damage. Under some conditions, such as high population
density in the affected area, a relatively minor earthquake
may do far more damage than a more powerful quake in a
sparsely populated area.
There are two scales that are most commonly used to
measure earthquakes: the Richter scale and the Mercalli
scale. The Richter scale, named after Dr. Charles Richter
of the California Institute of Technology, is a logarithmic
scale (expressed in powers of 10—see also magnitude) that
reflects the amplitude of ground movement. Several steps
are involved in establishing an earthquakes magnitude on
the Richter scale. First, the location of the quake must be
determined. It is done by noting the time a wave passed two
widely separated locations and inserting the data into a set
of equations to determine how far each station was from the
origin of the quake. The next step is to estimate the intensity
of ground motion at the earthquake’s origin by using a correc-
tion factor that introduces some error into the calculation of
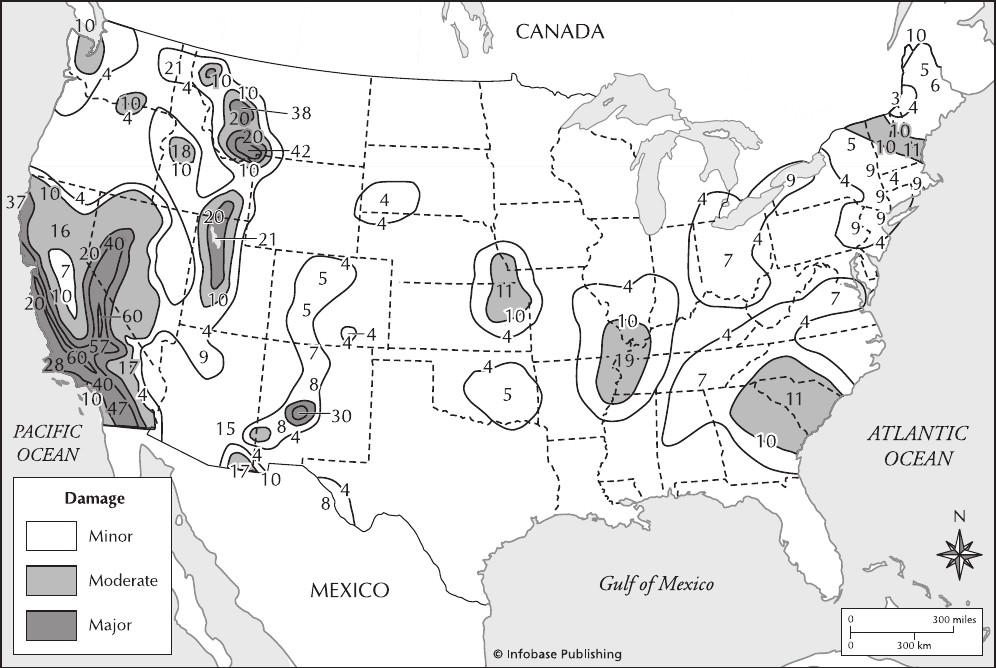
Seismic risk map for the United States. Based on historical records of earthquakes, both intensity and recurrence interval, the country is divided into
zones of earthquake risk. Certain areas will be relatively low-risk for earthquakes over a 50-year interval, whereas others are high.
234 seismology

magnitude. Measuring magnitude on the Richter scale does
not yield precise results, but within certain limitations, it does
provide a useful estimate of the strength of the earthquake.
The Richter scale starts at zero and is open ended. An earth-
quake of magnitude 1 on the Richter scale probably would go
unnoticed by anyone but an observer with a seismograph.
Magnitude 4 earthquakes are mild but still perceptible, and
earthquakes of magnitude 8 and above are devastating if
they strike densely populated areas. The San Francisco
earthquake of 1906 is estimated to have been about 8.2 on
the Richter scale, and two other earthquakes of the 20th cen-
tury—one beneath the Pacific Ocean near Japan in 1933
and the other off the coast of Ecuador in 1933—are thought
to have ranked around 8.6.
The second common scale for measuring earthquake
intensity is the Mercalli scale and modified Mercalli scale.
It uses Roman numerals to avoid confusion with the Rich-
ter scale and is based on easily observable effects, such as
destruction of buildings.
Seismic moment is another measure of the size of an
earthquake. Seismic moment is the product of the average
amount of slip, the area of the rupture and the shear mod-
ulus, or strength, of the rocks affected. An expression of
magnitude related to seismic moment is moment magnitude,
which is approximately the same as Richter magnitude in
range 3–7.
Duration
Some earthquakes last only a few seconds, but others have
been known to last for a minute or two. As a rule, damage
increases with duration.
Local Geology
The character of underlying material does much to determine
the extent of damage from an earthquake. The safest mate-
rial on which to build, generally speaking, is solid rock, which
transmits vibrations from an earthquake but maintains its
structural integrity. More dangerous is unconsolidated sedi-
ment, which may exhibit liquefaction and extensive conse-
quent damage where groundwater rises close to the surface.
Fractured rock, as found in many parts of the western United
Energy Released and Equivalent Energy of Richter Magnitudes
Magnitude Energy Released (ergs) Energy Equivalent
-2 6 X 10
8
100 Watt-light left on for one week
-1 2 X 10
10
0 6 X 10
11
Seismic waves from one pound of explosive
1 2 X 10
13
A 2-ton truck traveling at 75 mph
2 6 X 10
14
3 2 X 10
16
Typical lightning bolt
4 6 X 10
17
Seismic waves from 100 tons of explosives
5 2 X 10
19
Average tornado
6 6 X 10
20
Hiroshima 1945 atomic bomb
7 2 X 10
22
One-megaton nuclear explosion
8 6 X 10
23
Average kinetic energy of a hurricane
9 2 X 10
25
Average annual seismic energy released on Earth
10 6 X 10
26
U.S. annual energy consumption
11 2 X 10
28
Earth’s annual internal heat flow
12 6 X 10
29
Earth’s daily receipt of solar energy
Mercalli
Intensity Observed Effects
I Not felt at all
II Felt by only a few individuals
III Felt indoors by many persons, but not neces-
sarily identified as an earthquake
IV Felt both indoors and outdoors and compa-
rable to vibrations produced by a passing train
or heavy truck
V Strong enough to awaken a sleeping person;
small objects fall off shelves, and beverages
may splash out of cups or glasses
VI Perceptible to everyone; pictures fall off walls,
and plaster may fall from ceilings.
VII Difficult to stand upright; ornamental masonry
falls from buildings; waves may occur in ponds
and swimming pools.
VIII Mass panic may occur; chimneys and smoke-
stacks may fall; unsecured frame houses slide
off their foundations
IX Heavy damage to masonry structures and
underground pipes; large cracks open in
ground; panic is general
X Numerous buildings collapse; water splashes
over riverbanks
XI–XII Virtually complete destruction
seismology 235
States, may absorb energy from earthquake waves and thus
reduce the geographical extent of damage from a major earth-
quake. By contrast, in areas where geological formations
stretch unbroken for hundreds of miles, as in portions of the
eastern United States, vibrations may travel great distances
with much of their initial destructive potential intact. The 1906
San Francisco earthquake, for example, was barely felt at all
outside California, but the New Madrid, Missouri, earth-
quakes approximately a century earlier were perceived over
much of the United States east of the Mississippi River. The
irony here is that the same processes that predispose a given
part of Earth’s crust to major earthquakes may also con-
fine damage from earthquakes through extensive fracturing,
whereas comparatively earthquake-free regions may harbor
much greater potential for destruction because of the relatively
undisturbed, contiguous rock that underlies them.
Time of Day
This is an important factor in determining the number of
casualties from an earthquake. Deaths and injuries from
collapsing buildings in rural areas, for example, are likely
to be more numerous if an earthquake occurs at night or in
the early morning when the population is indoors sleeping
or having breakfast. In cities, on the other hand, deaths and
injuries may be more likely during the working day, when
large numbers of pedestrians are exposed to harm from fall-
ing walls and ornamental masonry.
Architecture
Wood-frame buildings have a reputation for standing up
well to earthquakes because wood can bend and sway under
earthquake vibrations, thus improving a building’s chance of
survival. Buildings of brick and stone construction, by con-
trast, are more likely to crumble and collapse because they
lack wood’s resiliency, although careful design and con-
struction may increase the survivability of a non-wooden
structure. Possibly the worst building material in regard to
earthquake resistance is adobe, which was responsible for
numerous fatalities during earthquakes in the early years of
Euro-American settlement of the western United States. See
also Fort Tejon earthquake for an illustration of the dan-
gers of adobe construction.
Predicting Earthquakes
Earthquake prediction has been a goal of scientists for cen-
turies, and efforts in this direction have often been color-
ful, even when unsuccessful. Charles Mackay, in his 1841
book Extraordinary Popular Delusions and the Madness of
Crowds, tells how one man named Bell apparently used a
primitive mathematical model to predict the date of an earth-
quake in England during the 18th century:
In the year 1761, the citizens of London were
alarmed by two shocks of an earthquake, and the
prophecy of a third which [supposedly] was to
destroy them altogether. The first shock was felt
on the eighth of February and threw down several
chimneys in the neighborhood of Limehouse and
Poplar; the second happened on the eighth of March
and was chiefly felt in the north of London. . . . It
soon became the subject of general remark, that
there was an interval of exactly a month between
the shocks; and a . . . fellow named Bell, a soldier in
the Life Guards, was so impressed with the idea that
there would be a third in another month that he lost
his senses altogether and ran about the streets pre-
dicting the destruction of London on the fifth of
April [that is, four weeks after the previous earth-
quake].
Mackay tells how Bell’s prediction affected the public:
There were not wanting thousands who confi-
dently believed the prediction and took measures
to transport themselves and their families from the
scene of the impending calamity. As the awful day
approached, the excitement became intense, and
great numbers of credulous people [migrated] to all
the villages within 20 miles (32 km), awaiting the
doom of London. Islington, Highgate, Hampstead,
Harrow, and Blackheath were crowded with panic-
stricken fugitives who paid exorbitant prices for
accommodation to the housekeepers of these secure
retreats. Such as could not afford to pay for lodg-
ings at any of these places remained in London until
two or three days before the time [of the prediction],
then encamped in the surrounding fields, awaiting
the tremendous shock which was to lay their high
city all level with the dust. . . .
[The] fear became contagious, and hundreds
who had laughed at the prediction a week before
packed up their goods when they saw others doing
so and hastened away. The [Thames] river was
thought to be a place of great security, and all the
merchant vessels in the port were filled with people
who passed the night between the fourth and fifth
on board, expecting every instant to see St. Paul’s
totter and the towers of Westminster Abbey rock
. . . and fall amid a cloud of dust.
Even when the predicted earthquake failed to occur on
April 5, the public’s fears took days to subside completely:
The greater part of the fugitives returned on the fol-
lowing day . . . but many judged it more prudent
to allow a week to elapse before they trusted their
dear limbs in London. . . . [Bell] lost all credit in a
short time and was looked upon by even the most
credulous as a mere madman. He tried some other
prophecies, but no one was deceived by them; and
. . . a few months afterwards, he was confined in a
lunatic asylum.
Such “earthquake prophets” have remained active from
Bell’s day to ours, but only in recent years has knowledge of
earthquakes and their origins advanced to the point where
accurate prediction of earthquakes, or some quakes at least,
has become a possibility.
236 seismology
Determining the potential for future rupture along a
fault can be difficult because faults differ in their behaviors.
One fault may show no activity for many centuries and then
suddenly move 30 feet (9 m) or more, whereas another fault
may exhibit virtually continuous, gradual movement and
many small earthquakes. This variability in behavior means
that geologists cannot make accurate predictions of a fault’s
future activity merely by establishing that the fault is active.
Two selected faults, though both active, may move at greatly
different intervals and exhibit equally great differences in
rates of slip. Also, the rate of slip along an individual fault
may change. The slip rate along California’s San Jacinto
Fault Zone, for example, is believed to have fluctuated by
more than 1,200%.
Another source of uncertainty in determining slip rate
and history of activity is difficulty in estimating the ages of
offset deposits or other features along a fault. In the Los
Angeles area, for example, such estimates are unreliable in
many or most locations where faults are active. Yet another
problem in determining the true slip rate for a fault is the
partial nature of information on components of slip. Data
may be restricted to either the vertical or horizontal compo-
nent. Such limited data may yield an unreliable estimate of
slip along a fault, although the horizontal or vertical compo-
nent alone may prove useful if the ratio of vertical to hori-
zontal motion along a fault is known already. (In situations
involving a strike-slip fault, where motion along a fault
is primarily horizontal, the horizontal component alone may
provide a reasonably accurate measure of the slip rate. This is
the case along the San Andreas Fault in California. Vertical
component data reportedly have provided an approximation
of true slip rates along the reverse-slip faults in California’s
Transverse Ranges.) The best information that can be sup-
plied, in many cases, is an average figure for slip rate over a
long period of time. As a rule, however, the higher the aver-
age slip rate, the more active the fault and the more closely it
bears watching as a potential source of future earthquakes.
Only in a few areas—namely, boundaries between major
plates of Earth’s crust, as along the San Andreas Fault—do
faults show very high average slip rates, perhaps a half-inch
or more per year. Active faults in other areas generally show
less slip.
The future behavior of a fault may be inferred, to some
extent at least, from evidence including the rate of slip, the
size of earthquakes and intervals between them and the
amount of slip in each incidence of movement. No one set
of criteria exists, however, for determining how active a fault
may be in the future.
Complicating such analysis further is the fact that some
active faults do not extend to the surface of Earth and, on the
surface, may display only faint evidence of recurring seismic
activity. A highly damaging earthquake that struck Coalinga,
California, in 1983 involved such a blind fault similar to
the North Ridge earthquake of 1994. Moreover, simply
establishing that a fault is active does not allow geologists
to make accurate predictions of its future activity. Ongoing
measurements of seismic activity are useful tools for estimat-
ing the likelihood of earthquakes along a given fault in the
future. Seismic data may be misleading, however, because
ongoing earthquake activity, or the absence of it, along a
fault does not necessarily reflect the potential of that fault for
generating destructive earthquakes. An active fault may have
very little potential to cause destructive earthquakes because
it gradually releases its energy through creep, without actu-
ally generating earthquakes. Also, data on seismic activity
along a particular fault may span too short a time to provide
a useful means of predicting the behavior of earthquake-
generating faults over a long period. Even when historical
records are more extensive, as in parts of Asia, great uncer-
tainties remain in reconstructing the seismic history of a given
locality or region.
Despite these limitations, certain methods exist for estimat-
ing the size and frequency of possible future earthquakes along
a fault. These methods involve, but are not limited to, analyz-
ing the earthquake history of a region to find the biggest seis-
mic event linked to a given fault and comparing a given fault’s
history of earthquake activity with that of other faults similar
in structure and tectonic characteristics. Another approach is
to use empirically established relations between earthquake
magnitude and length of faults. It is assumed that the greater
the dimensions of the fault surface involved in an earthquake,
the greater magnitude the earthquake will have. One widely
used method for estimating the most powerful earthquake
that is likely to occur on a given fault rests on the assumption
that half the total length of the fault may rupture in a particu-
lar earthquake. This approach is not fully reliable, however,
because experience has shown that a major earthquake may
involve rupture of anywhere from only a small percentage to
almost the whole extent of a fault surface that existed prior to
the earthquake. Another drawback to this method is difficulty
in measuring the length of a given fault accurately. Much of
a particular fault may lie hidden under sediment and water.
In greater Los Angeles, the 1857 Fort Tejon earthquake is
thought to represent about the most powerful earthquake that
might affect that area, although an earthquake of still greater
magnitude is possible in theory. It has been suggested that the
whole San Andreas Fault might rupture in southern California,
producing a single gigantic earthquake; but there are questions
about whether or not the geology of the region would allow
such a single catastrophic event.
Semeru volcano, Java, Indonesia One of the world’s
most active volcanoes, Semeru has erupted at least 55 times
since 1818. The typical eruption has a VEI = 2–3 and pro-
duce lava flows and
NUÉE ARDENTEs on several occa-
sions. Ten of the eruptions produced fatalities including
some 600 death from lahars during the 1909 and 1981
eruptions. The current eruptive period began in 1967 and
typically produces Vulcanian-type eruptions. To date
nearly 500 people have been killed by pyroclastic flows
and avalanches.
Semisopochnoi volcanic island, Alaska, United States Semi-
sopochnoi Island is located in the western Aleutian Island
arc and consists largely of a single volcano, Pochnoi. It is the
youngest volcanic island in the western Aleutians. It is com-
posed of an older shield volcano. The central portion col-
lapsed and formed a caldera following the eruption of a
Semisopochnoi 237
great volume of pumice, although the date of the eruption and
collapse is uncertain. After the caldera formed, several new
cones formed. Accounts of eruptive activity from the 18th and
early 19th centuries are spotty, but there is reason to think the
volcano was active in or around 1772, 1790, 1792, and 1830.
An eruption appears to have occurred in 1873. A plume arose
from the island in 1987. Several days after this event, a pilot
reported seeing snow darkened by ash. That eruption was
explosive with a VEI = 2.
Serravalle di Chienti earthquake, central Italy On Sep-
tember 26, 1997, an earthquake of magnitude 5.7 of
occurred. A total of 11 people were killed, 100 people were
injured, and 80,000 buildings were damaged or destroyed.
The earthquake received extensive press coverage because of
the damage it did to the Basilica of St. Francis at Assisi. Foot-
age of a collapsing roof in a church was on the evening news
throughout the world.
Sete Cidades caldera, Azores The Sete Cidades caldera
on San Miguel Island has undergone eruptions on at least
eight occasions within historical times. An eruption occurred
around the year 1444 from a vent on the southwestern floor
of the caldera. In 1638 very strong earthquakes in May and
early June were followed in July by an underwater eruption
from a vent to the west of the caldera. A submarine eruption
in 1682 followed strong earthquake activity, and an earth-
quake swarm in 1713 may have accompanied an underwater
eruption west of Sete Cidades. Strong earthquakes in 1810 and
early 1811, including one that caused widespread destruction
on June 24, 1810, were followed in 1811 by a submarine erup-
tion several hundred yards southeast of the site of the under-
water eruption of 1638. This 1811 eruption produced an islet
about a mile and a half (2.4 km) off the western shore of the
island. The eruption subsided in early February but resumed
in June, when powerful earthquakes shook the island and a
strong odor of sulfur was detected. An underwater eruption
began on June 14, 1811, near the site of the eruption in Febru-
ary. Further submarine eruptions were recorded in 1861 and
1880. The caldera contains two crater lakes.
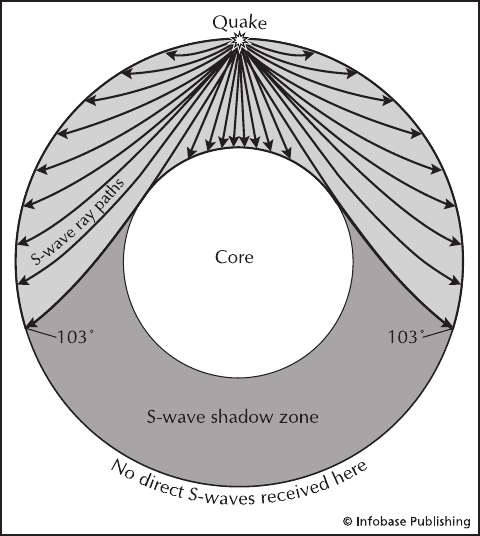
shadow zone On the opposite side of Earth from an
earthquake, there are no s-wave arrivals. S-waves move
with a shearing motion. This shearing motion cannot pass
through liquid. Therefore S-waves cannot pass through the
liquid core. Seismic waves that must pass through the liq-
uid core to reach the seismograph do not include S-waves.
Only P-waves arrive, and their path is so bent (refracted)
that there is even a small zone where they do not arrive. The
shadow zones are where there are no arrivals at all or no S-
wave arrivals. This phenomenon is the main way we can tell
that the outer core is liquid.
ShakeMap ShakeMap is a new tool developed for earth-
quake response in urban areas that is only available in Cali-
fornia at this point. When an earthquake strikes, emergency
management personnel must quickly decide where to con-
centrate their meager resources to best address the disas-
ter. An overwhelming amount of information on damage
is received and can only be processed in a cursory manner.
Because ground shaking causes the most damage to human-
made structures, knowing where the ground will shake the
most will determine the areas of highest damage. ShakeMap
is a map showing the distribution of relative shaking intensity
and thus the highest risk for damage. It is constructed using
geological bases as well as experience from previous earth-
quakes. As the seismic waves are still passing through, res-
cue teams can be mobilizing to the areas of highest damage
potential to shave precious minutes or to save the otherwise
victims of the disaster.
Shalla See Asawa.
shallow-focus earthquakes Earthquakes with foci of 44
miles (70 km) depth. By far and away, these are the most
common depth for earthquakes. Earthquakes are only pro-
duced during brittle deformation and brittle deformation
mainly occurs at depths of less than six to nine miles (10–15
km) in the crust. The most common deep-focus earth-
quakes occur in subduction zones.
Shasta, Mount Cascades, California, United States The
second tallest of the Cascade stratovolcanoes includes
a second cone, Shastina on its shoulder. Mount Shasta is an
Schematic diagram of the Earth showing travel of S-waves from
the earthquake focus to the surface, where they are detected by
seismographs. Because S-waves cannot pass through liquid, they are
absorbed by the liquid outer core. Seismographs on the opposite side of
the Earth from the earthquake do not receive any S-wave arrivals and
therefore a shadow zone is formed. A less extensive shadow zone for P-
waves is also formed based upon refraction of the waves.
238 Serravalle di Chienti
active volcano. It has erupted 11 times in the past 3,400 years
including three events in the past 750 years. The last eruption
was in 1786. There is a 300,000-year-old avalanche depos-
its that extend 27 miles (43.5 km) from the base. This event
deposited eight times the debris of the 1980 Mount Saint
Helens event. The explosion must have been huge. There is
pressure to build ever closer to Mount Shasta. Is it worth the
risk?
shear Shear is a type of stress in which force is transmitted
by sliding, like a hand sliding on a table, rather than simply
by pressing against the object. This motion cannot be trans-
ferred to liquid or gas. In seismology, it is defined as motion
at right angles to the direction in which an s-wave or sur-
face wave, from an earthquake is advancing (propagation
direction). Shear waves are also known as transverse waves.
shear wave (S-wave) An S-wave is named as such because
it arrives second after the primary wave. S stands for second-
ary, not shear. The S-wave, however, exhibits shear motion
as well. If you slide your hand across a table, you are exerting
shear on it. You can move a book on the table in this manner
or even the table if it is small enough. You are exerting shear
stress on it. This is the way shear waves travel. If you substi-
tute liquid or gas for the table, none of the shear stress will
be transferred. Your hand will just slide across the top. In the
same way, shear waves (S-waves) cannot pass through a liq-
uid or a gas.
Sheveluch volcano, Kamchatka, Russia A large strato-
volcano in north-central Kamchatka Peninsula. It has a
small internal cone with a large caldera where the recent
eruptions occur. After 150 years of dormancy, in 1854,
Sheveluch erupted violently. The explosion created a 1.25-
mile (2-km)-wide crater from which huge pyroclastic
flows were emitted. Some of the flows extend an unbeliev-
able 65 miles (105 km). This eruption was the largest in his-
toric times. It has erupted at least 28 times since then. The
two major eruptions were in 1944–50 and 1964. The 1964
eruption was the larger of the two and produced a huge
crater, an 11-mile (18-km) long and locally 160-foot (49-
m)-thick pyroclastic flow. It also produced a cloud with
impressive electrical output (thunder and lightning). Minor
eruptions occurred in 1879–83, 1897, 1905, 1928–29, 1980,
1984, 1985, 1986, 1988, 1989, 1990, 1991, 1993, and 1996.
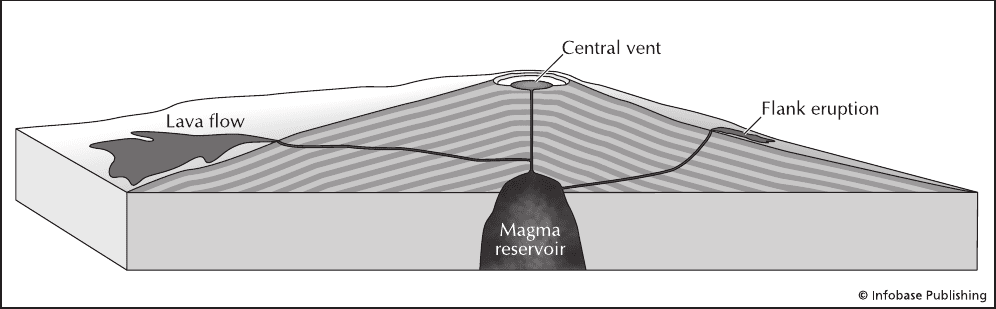
shield volcano A volcano that is shaped like an ancient
shield. It is a relatively flat mound with gradual slopes,
formed by eruptions of basaltic lava. The basalt has such
low viscosity and lacking in ejecta that it cannot stack up
a steep slope. Olympus Mons on Mars and the Hawaiian
Islands are examples of shield volcanoes.
Shikotsu caldera, Japan The Shikotsu caldera appears to
have been the site of a great flow of ash and fall of tephra
in prehistoric times. About 30,000 years ago, the mod-
ern volcano was formed in a huge eruption that produced
approximately 30.5 cubic miles (125 km
3
) of ash (VEI =
6–7). Two of the three prehistoric eruptions were also large.
The eruptions in 6950 and 800 b.c. had VEI = 5. In the mod-
ern volcano, Lake Shikotsu occupies much of the interior of
the caldera. The volcano Tarumai (called Tarumae-San) is
located on the caldera’s southeast edge. In historical times,
the caldera has been active on at least 34 occasions. Major
eruptions occurred in 1667 and 1739 at Tarumai and left a
caldera approximately one mile (1.6 km) wide on the volcano
summit. A vigorous eruption of Tarumai in 1874 preceded
by about three weeks a powerful tectonic earthquake along
the northwestern coast of Hokkaido¯, the northernmost major
island in the Japanese archipelago. Small emissions of ash
occurred in 1894. Tarumai underwent a strong eruption in
1909, approximately a year after a major tectonic earthquake
off the north coast of Hokkaido¯. This 1909 eruption began
in late April with loud detonations, shaking of the ground,
and a tremendous column of dark smoke. Eruptive activ-
ity occurred again in May, apparently with great emissions
of smoke and vigorous seismic activity. Minor eruptions
occurred every few months from 1917 to 1923, and erup-
tive activity continued on an intermittent basis through 1936.
A powerful explosion occurred in 1920. Another eruption,
Diagram of a shield volcano with a summit caldera and flank eruptions
Shikotsu 239
on December 1, 1933, preceded a powerful earthquake on
December 5 and a renewal of volcanic activity on December
11. Explosive eruptions, and possible phreatic eruptions
as well, occurred between 1944 and 1955. earthquake
swarms started to increase in 1967, and minor swarms of
earthquakes were reported again in 1975, 1978, 1979, and
1981. Eruptions resumed in 1978, and small eruptions con-
tinued through 1981. A minor eruption in February 1981
marked the end of earthquake swarm activity that had been
occurring since 1967, although some earthquakes took place
after this eruption. Inflation appears to have occurred at the
caldera during the 1980s.
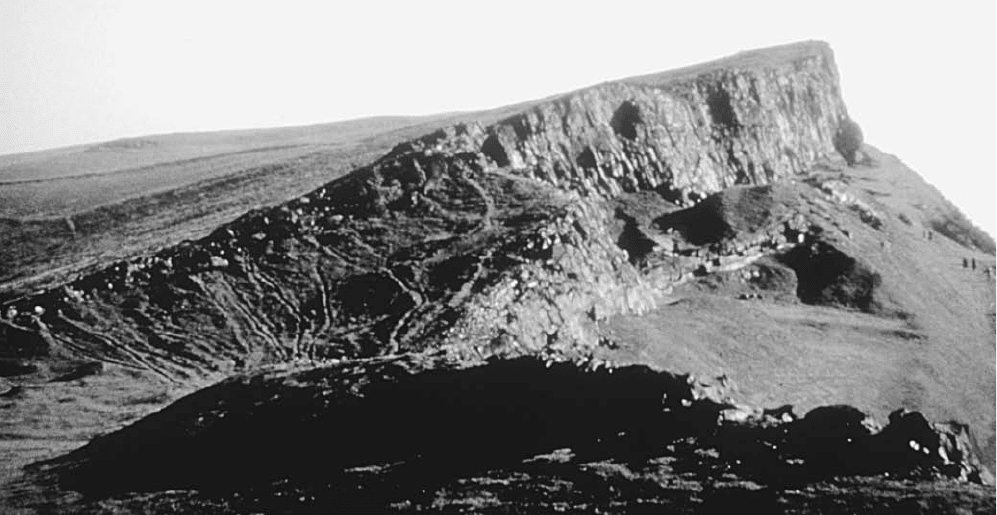
Ship Rock New Mexico, United States One of America’s
most spectacular and famous landforms, Ship Rock is a vol-
canic neck with dikes radiating from it. The ancient volca-
nic cone that once surrounded Ship Rock has been removed
by erosion. The dikes acted as feeders and probably fed flank
eruptions. Ship Rock is part of the Navajo Volcanic Field,
which lies in the Four Corners area (intersection of Utah,
Colorado, Arizona, and New Mexico) covering about
7,810 squares miles (20,000 km
2
). The igneous bodies have
an unusual composition and occur as either diatremes (kim-
berlites) or tuff pipes. The activity occurred from about 30
to 25 million years ago, and erosion has proceeded ever since.
Shiraz earthquake, Iran During the night of May 4, 1853,
a devastating earthquake struck the city of Shiraz, Iran, and
the surrounding towns and villages. The Richter magnitude
of this event was estimated at 6.5, and the damage was esti-
mated at VIII on the modified Mercalli scale. The earth-
quake caused extensive settling of the ground surface and
fissures and slump in the mountains surrounding the city.
There were strong aftershocks for months after the event.
Only the stronger masonry buildings survived the shaking; all
else was laid to waste. In all, some 12,000 people were esti-
mated to have perished in the event, although some sources
placed the number closer to 10,000.
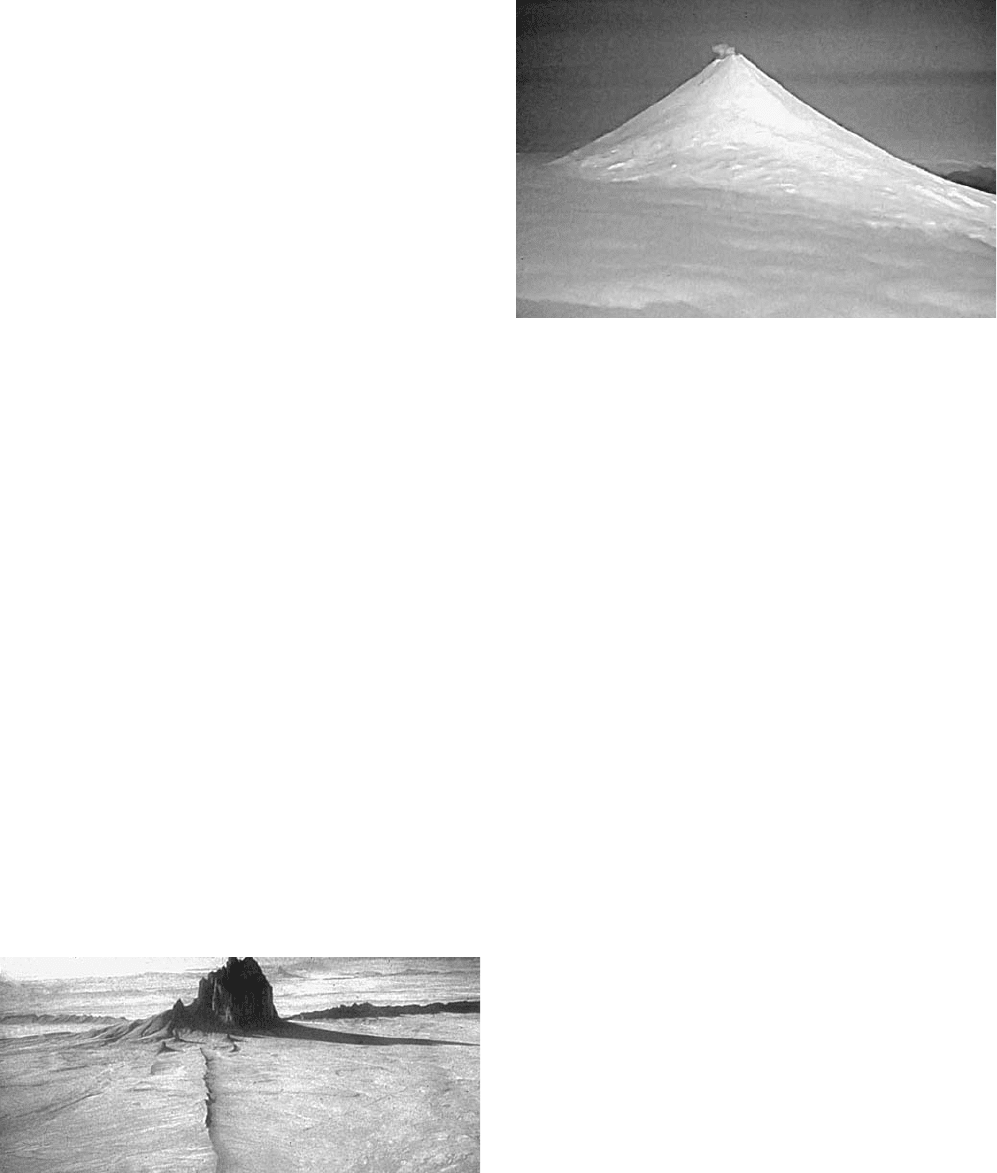
Shishaldin volcano, Alaska, United States A beautifully sym-
metric, snow-covered stratovolcano in the eastern Aleutian
Islands (Unimak Island), Shishaldin is one of the most active
volcanoes in the Aleutians. It has erupted at least 29 times since
1775. The major eruptive periods were 1775–78, 1827–30,
1897–99, 1927–29, 1946–48, 1975–76, and 1986–87. The
most recent full eruption was in 1999, but there are constant
low-frequency rumblings and steam plumes from the volcano,
and it is constantly monitored. An eruption column 45,000
feet (13,716 m) high and an ash cloud that extended 500 miles
(805 km) was produced during this last eruption.
Sierra Negra volcano, Galápagos Islands, Ecuador A large
shield volcano, Sierra Negra occupies Isabela (Albemarle)
Island and has a shallow, elliptical caldera on its sum-
mit. The volcano is less than 4,500 years old. An explosive
eruption was reported in 1813, and other eruptive activity
of unknown character was recorded in 1817. A lava flow
occurred during an eruption in 1844, and an explosive erup-
tion was reported in 1860. Some kind of unrest appears to
have occurred at Sierra Negra in 1911 or 1912, but details
are unavailable. An explosive eruption and associated flow or
flows of lava were reported in 1948 and again in 1953–54.
Unrest of unknown character was reported in 1957. Explo-
sive eruptions with lava flows occurred in 1963 and again in
1979–80. An eruption in 1979 injected large amounts of sul-
fur dioxide, detectable on a global scale, into the atmosphere.
Sierra Nevada California, United States Approximately
350 miles (563 km) long and 60 miles (97 km) wide, the
Sierra Nevada range lies along the western edge of North
America’s Great Basin and is bordered on the north by the
Cascade Mountains. The Sierra Nevada comprises a huge
batholith of granitic rock with faults on the east side
and which is tilted westward. In some places, magma has
made its way to the surface and formed volcanoes atop the
pluton. The Sierra Nevada batholith forms the roots of an
ancient magmatic arc. A subduction zone existed under
California until about 25 million years ago when the tec-
Ship Rock is located in New Mexico. The main part is a volcanic neck
that remained after the rest of the volcano eroded away. The radial lines
are dikes that fed magma to the volcano. Ship Rock is nearly 1,400 feet
(470 m) high, and the dikes form large walls across the desert. (Courtesy
of NOAA)
The snow-covered stratovolcano Shishaldin on Unimak Island in the
Aleutian Islands, Alaska. This volcano has been compared with Mount
Fuji of Japan as one of the most perfect volcanic cones in the world. Only
volcanoes in polar regions are completely ice-covered. (Courtesy of the
USGS)
240 Ship Rock
tonics shifted around to the San Andreas transform margin
that exists today. Previously, California looked more like the
Andes with a high range of volcanic mountains.
The Sierra Nevada range is noted for seismic activity,
especially along its southern border, where a northward-
moving block of crustal rock encounters the deep roots of
the mountain range. This interaction generates numerous
earthquakes in southern California as the block of crust
grinds against, and fragments smaller pieces of crust around
the southwest edge of the Sierra Nevada. The transverse
ranges have arisen along the zone of collision. Veins of
gold were deposited in the rocks along the Sierra Nevada
and became known as the mother lode. Fragments of gold
eroded from the mother lode were laid down with sediments
in placer deposits that, when discovered during the early set-
tlement of California by Americans of European descent, led
to the gold rush of 1849. Alpine glaciation has done much
to sculpt the topography of the Sierra Nevada. The range
exhibits a curious inverted topography in places, where lava
flows that once filled canyons now form ridges because ero-
sion has worn away the granitic rocks on either side of the
lava flows, leaving the former valley (topped with lava) in
separate streams. The basins parallel to the Sierra Nevada on
the west side of the range contain thick deposits of sediment
eroded from the mountains. They formed as the basins sank
relative to the mountains, giving sediment an opportunity to
accumulate to great thickness.
silica Tetrahedra (pyramid-shaped) molecules of silicon and
oxygen. Silica is an important component of many minerals,
especially the silicates, quartz crystals are familiar exam-
ples of silica in its pure form.
silicates Silicate minerals incorporate a characteristic mole-
cule, which consists of a silicon atom and four oxygen atoms
arranged in a tetrahedral (pyramid) structure. Other atoms
such as potassium, iron, and magnesium may occupy spaces
within tetrahedra. Silicate tetrahedra may be joined together
in various arrangements. In minerals where tetrahedra occur
in isolated form, tetrahedra are packed together closely; gar-
net and olivine are examples of minerals with this structure.
An example of a mineral having rings of six tetrahedra is
beryl, commonly found in the form of six-sided crystals. Tet-
rahedra arranged in single chains (pyroxenes, for example)
and double chains (amphiboles—hornblende) are moder-
ately hard and tend to separate in a regular fashion (along
cleavage planes), parallel to the chains. In sheet form, tetrahe-
dra are linked together to form a planar structure; mica (mus-
covite and biotite) is a familiar example of a mineral with
this structure. In frameworks, where tetrahedra join to form
a three-dimensional lattice comparable to the framework of a
building, the best examples are feldspars (plagioclase and
k-feldspar), the most common mineral group, and quartz,
the most common mineral variety.
silicic Rich in silica.
sill A sill is a tabular body of intrusive igneous rock that lies
parallel to and along the layering of the country rock strata.
plutons that lie parallel to strata are said to be conformable
This photo is of a volcanic sill near Edinburgh, Scotland. The magma squeezed along the layering of the existing rock strata before solidifying. The
Palisades of New York and New Jersey formed by the same process. (Courtesy of NOAA)
sill 241