Graef M. Introduction to conventional transmission electron microscopy
Подождите немного. Документ загружается.

638 Phase contrast microscopy
(a) (b) (c)
220 @ 6.9 nm
-1
8.4 nm
-1
6.4 nm
-1
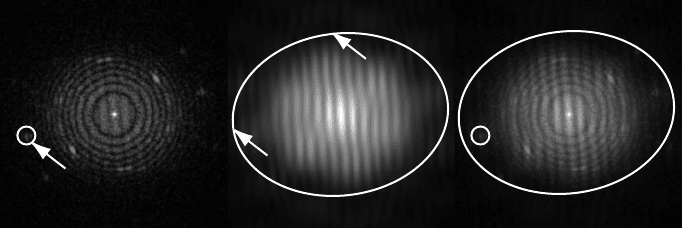
Fig. 10.29. (a) Diffractogram of the sum of two micrographs with a small relative translation,
showing Young fringes; (b) Fourier filtered image using only the Young fringe periodicity;
(c) same as (a), but with enhanced fringe contrast. The ellipse indicates the point at which
the Young fringes are no longer detectable.
equation (10.58) on page 617 and requires a series of image pairs for increasing
defocus. An alternative method for the determination of the effective source size,
which is related to the damping envelope, can be found in [HSI91]. A full and accu-
rate characterization of all electron optical parameters is essential if the information
content of an image or series of images is to be pushed towards the information
limit. The reader is referred to volume 64 of the journal Ultramicroscopy for a series
of papers related to the acquisition of images with an information limit of 0.1 nm.
That it is possible to push the information limit well below 0.1 nm has been shown
by O’Keefe and coworkers [OHW
+
01,ONWA01] in the One
˚
Angstrom Microscope
project (OAM) at the Lawrence Berkeley Laboratory.
10.3 High-resolution image simulations
We have all the ingredients necessary for a HREM image simulation: the exit
wave (from the
BWEW.f90 program), and the microscope contrast transfer function
(computed via the
ctf.f90 module). The computation of a single high-resolution
image, using the linear image formation model, is now straightforward and consists
of the following steps:
r
for a given exit wave φ(r), compute its Fourier transform φ(q);
r
compute the transfer function T (q) for a given set of microscope parameters;
r
multiply φ(q) and T (q), and apply the aperture mask;
r
inverse Fourier transform φ(q)T (q) to the image plane and take the modulus-squared to
convert to intensities.
There are obviously many parameters which can be varied: defocus, defocus
spread, beam divergence, foil thickness, acceleration voltage, and so on. In ad-
dition, the residual aberrations discussed in Section 10.2.5 can also be included
10.3 High-resolution image simulations 639
0 102030405060708090100
2
4
6
8
10
12
14
16
18
20
z
0
∆f
[010]
[001]
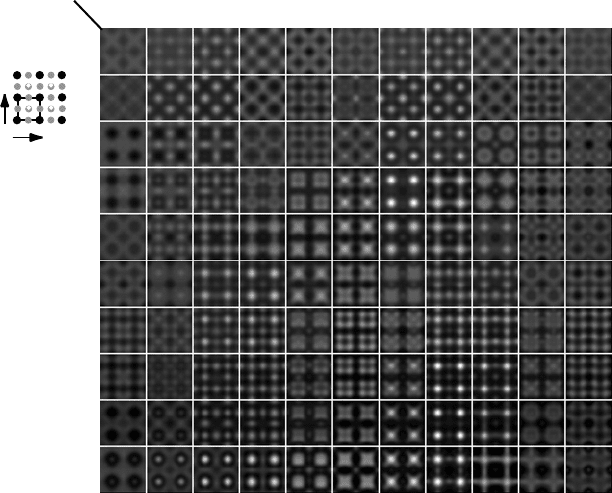
Fig. 10.30. HREM image simulation for the [100] zone axis of BaTiO
3
, using the electron
optical parameters stated in the text. The exit wave computation was carried out with the
BWEW.f90 program, and the images were simulated with HREMExample.f90. All images use
a common intensity scale.
in the simulations. Typically, however, only two parameters are changed: the foil
thickness and the microscope defocus. The resulting images are assembled in a ma-
trix of through-focus series, similar to the one shown in Fig. 10.30. The simulations
were carried out for the [100] zone axis orientation of BaTiO
3
, using 400 kV elec-
trons and a sampling grid of 32 × 32 pixels. The maximum |g| included in the exit
wave computation is 35 nm
−1
, resulting in a 615-beam Bloch wave computation
(
BWEW.f90
). The exit waves were computed for 10 foil thicknesses from 2 to 20 nm.
The
HREMExample.f90 program implements the steps outlined above. The program
uses a namelist file to store the electron optical parameters for a given microscope.
The following parameters were used for Fig. 10.30: C
s
= 1 mm, θ
c
= 0.8 mrad,
= 8 nm, and the aperture radius is 6 nm
−1
. Underfocus values from f = 0to
100 nm were used.
Comparison of the simulated images with the projected structure model to the
left of Fig. 10.30 shows that for most thickness–defocus combinations, the image
consists of bright or dark contrast at the metal atom positions (Ba or Ti). In some
cases, the O positions also show bright or dark contrast. The Scherzer point res-
olution (at f
S
= 49.7 nm) is 0.165 nm, so that the (020) and (002) interplanar
640 Phase contrast microscopy
2.49 2.55
3.60 5.20 6.00
2
4
6
Aperture Radius (nm
-1
)
Thickness (nm)
5 nm
-1
010
001
2.49
2.55
3.60
5.20 6.00
011 021
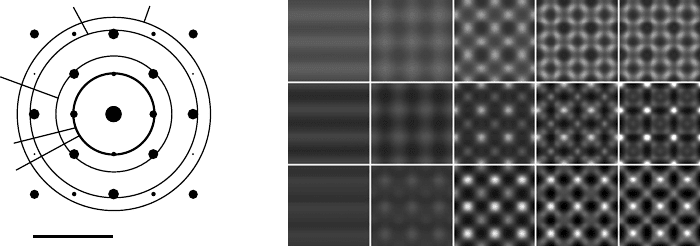
Fig. 10.31. Influence of the aperture size on simulated HREM images, for five different
aperture sizes indicated on the BaTiO
3
[100] zone axis pattern. See the text for more details.
spacings can be resolved directly. It is also clear from the images that the bright or
dark features do not always coincide with the projected atom positions.
Figure 10.31 illustrates the effect of the diffraction aperture. The aperture radii
were selected so that only selected reflections contribute to the image. The small-
est aperture, with a radius of 2.49 nm
−1
, only admits the {001} reflections, and
the resulting image consists of a sinusoidal modulation with the d
001
spacing as
wavelength. A slightly larger aperture allows the {010} reflections to contribute as
well, and the fringe pattern becomes two dimensional. The strong reflections of the
{011} family are admitted with the 3.6nm
−1
aperture, and the image contrast in-
creases significantly. Larger apertures then admit the {021}and the {020}and {002}
families. Since the chromatic information limit for the selected set of parameters
is ρ
c
= 0.144 nm, there is no point in using an aperture larger than the inverse of
this limit. No further image details would be introduced by such a larger aperture.
The
HREMExample.f90 program is provided on the website as an example of how
high-resolution image simulations can be performed. The reader is encouraged to
adapt the program, for instance to include non-rectangular projected unit cells.
There are several other HREM simulation programs available, including:
r
NCEMSS: developed at Lawrence Berkeley Laboratories, runs on various UNIX plat-
forms, ncem.lbl.gov/frames/software.htm;
r
EMS: developed at the Ecole Polytechnique F´ed´erale de Lausanne, runs on most plat-
forms, cimesg1.epfl.ch/CIOL/ems.html, [Sta87];
r
ACEM: programs developed by E.J. Kirkland as part of the book on Advanced Computing
in Electron Microscopy, [Kir98];
r
MacTempas: developed by R. Kilaas, runs on the Macintosh platform,
www.totalresolution.com.

10.4 Lorentz image simulations 641
There are many other packages available and the reader is encouraged to search
on the web for commercial, shareware and free software. Details on simulation
methods can be found in [Kir98,KO89, BCE88, Spe88].
10.4 Lorentz image simulations
In Section 7.5.3, we have seen that a magnetic thin foil affects only the phase of
the electron wave, and not its amplitude. Lorentz microscopy is, therefore, a phase
contrast method, and the magnetic object is a strong phase object. The phase shift
can easily be several radians large so that the weak phase object approximation of
Section 10.2.1.3 is of little or no use for Lorentz microscopy. It is possible, however,
to simplify the microscope transfer function derived earlier in this chapter. The
Lorentz deflection angle θ
L
is of the order of a few µrad, and hence the relevant
spatial frequency vectors q are short vectors. This, in turn, means that the dominant
terms in the phase transfer function are the lowest-order terms in q, which are
the quadratic and fourth-order terms. The contrast transfer function (10.53) can be
rewritten by grouping terms of order q
2
and q
4
, putting u = 1, and ignoring all
higher-order terms:
T
L
(q) = A(q − q
0
)e
z
2
q
2
e
z
4
q
4
(10.73)
with
z
2
=−
(
πθ
c
f
)
2
+ iπλ
[
f + C
a
cos 2(φ − φ
a
)
]
;
z
4
=−
(
πλ
)
2
2
+ 2
(
πθ
c
λ
)
2
fC
s
− i
π
2
C
s
λ
3
.
We have included two-fold astigmatism as a component of the transfer function.
From the aberrated wave function in the back focal plane, the image intensity can
be derived by an inverse Fourier transform:
I (r) =|F
−1
[ψ(q)]|
2
=|ψ (r) ⊗ T
L
(r)|
2
, (10.74)
where ⊗indicates the convolution product and the function T
L
(r)isthepoint spread
function appropriate for Lorentz microscopy.
One might wonder whether or not spherical aberration, the most important lens
aberration for most observation modes, is still important. It turns out that we can
safely ignore the phase shifts caused by spherical aberration, as illustrated by the
following example: at 400 kV, a sample with saturation induction of B
0
= 1 tesla,
and thickness t = 100 nm will give rise to a Lorentz deflection angle of eB
0
λt/ h =
40
µrad. This angle corresponds to a spatial frequency of q = λθ
L
= 0.024 nm
−1
.
The phase shift caused by spherical aberration (C
s
in meters) at this spatial frequency
is then equal to φ = 2.44 × 10
−6
C
s
. This phase shift remains smaller than 1 mrad

642 Phase contrast microscopy
for spherical aberration constants of up to 409 m. Since the spherical aberration
of a dedicated Lorentz pole piece is still significantly smaller than several hundred
meters, it is safe to simply ignore phase shifts caused by C
s
in all Lorentz image
simulations. This means that z
4
is effectively a real number.
For an in-focus image ( f = 0) the first term of z
4
becomes the leading compo-
nent of the damping envelope, so we must take it into account for all Lorentz image
simulations. The defocus spread is significantly larger for Lorentz microscopy
when a dedicated Lorentz pole piece is used. The chromatic aberration constant C
c
of such a lens is in the range of meters rather than millimeters, similar to the spher-
ical aberration constant. We cannot ignore this damping factor, since for f = 0,
ignoring would amount to ignoring the complete damping envelope.
A Lorentz image simulation proceeds along the same lines as a high-resolution
simulation: first we must compute the phase of the electron wave function, using
either an analytical approach to solving the Aharonov–Bohm integral (7.35), or a nu-
merical approach based on the Mansuripur algorithm introduced in equation (7.42)
on page 456. An example of an analytical approach to the computation of the phase
shift for a uniformly magnetized spherical particle can be found in [DGNM99].
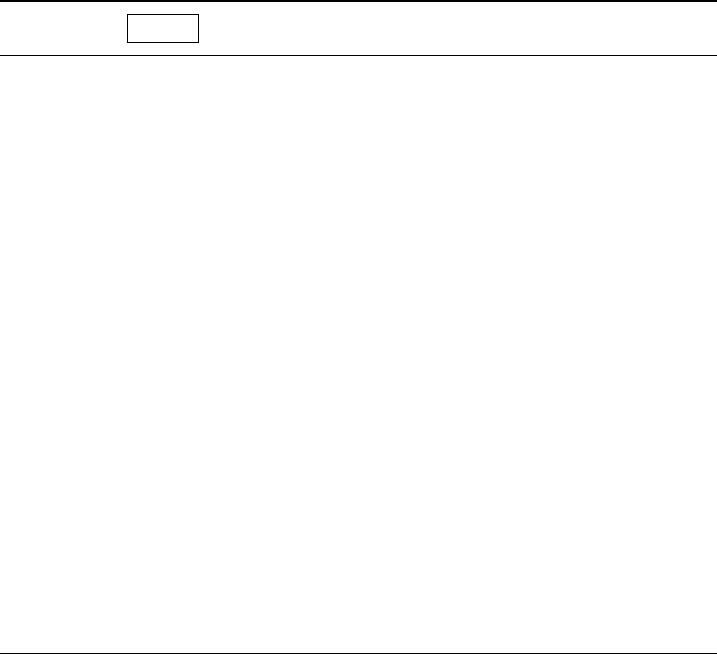
Pseudo code
PC-22 outlines a typical Lorentz image computation, as imple-
mented in the ION routine
lorentz.pro. The routine asks the user for several micro-
scope parameters (accelerating voltage, defocus, defocus spread, astigmatism, aper-
ture radius and position) and computes either a through-focus series (Fresnel mode)
or an aperture shift series (Foucault mode). The actual computation is carried out by
a Fortran program
LorentzExample.f90; this program computes the magnetization
configuration, the resulting phase shift, and then applies the Lorentz contrast trans-
fer function T
L
to the reciprocal wave function. The resulting images are stored in
a TIFF file or sent back to the remote browser in the case of the ION version.
Next, we will discuss two example magnetization configurations: two parallel
180
◦
domain walls and the 2D configuration of Fig. 7.35(a).
10.4.1 Example Lorentz image simulations for periodic
magnetization patterns
The simulations in this section were carried out using the ION implementation of
pseudo code
PC-22 . The reader may experiment with this program and vary all
parameters to study their influence on the image features.
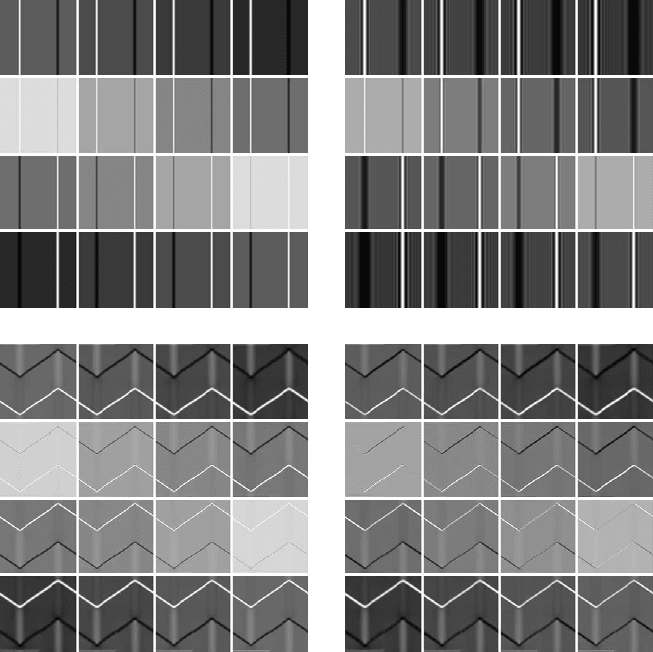
Figure 10.32 shows four Fresnel series for a pair of 180
◦
domain walls (a and b),
and for the intersecting 71
◦
and 180
◦
domain walls of Fig. 7.35(a). The microscope
parameters are listed in the figure caption; the image sequences (c) and (d) have
the same sequence of defocus values as the labeled values in Fig. 10.32(a). The
first Fresnel series (a) shows that domain walls show up as bright or dark lines for
10.4 Lorentz image simulations 643
Pseudo Code PC-22 Outline of a Lorentz image simulation.
Input: 2D periodic magnetization configuration
Output: exit wave phase and images
DFFT of magnetization components → M
mn
compute phase φ for given beam direction, foil thickness {7.42}
DFFT of exit wave e
iφ
ask user for microscope data
if Fresnel mode then
for each defocus value do
compute contrast transfer function
multiply with reciprocal wave function
compute modulus squared of inverse DFFT
end for
end if
if Foucault mode then
for each aperture position do
compute contrast transfer function
multiply with reciprocal wave function
compute modulus squared of inverse DFFT
end for
end if
output to TIFF file
out-of-focus images. We will show below that the Fresnel image contrast occurs
wherever the phase profile has non-zero curvature.
The through-focus series in Fig. 10.32(b) differs from that in (a) only in the value
of the beam divergence angle θ
c
; smaller values indicate a more coherent beam, and
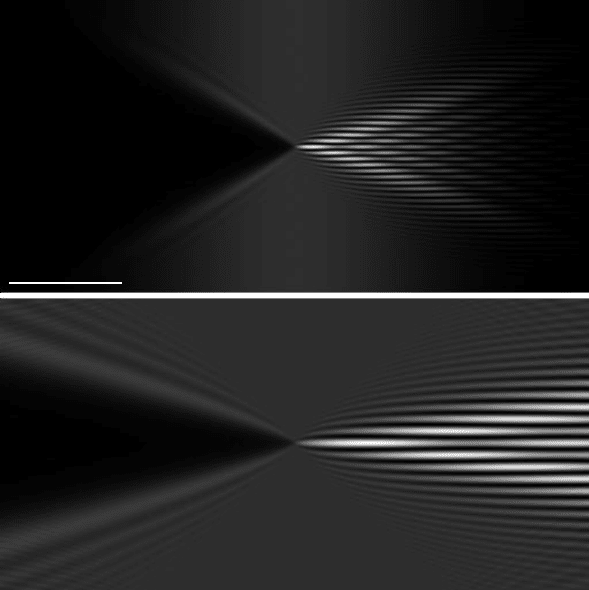
the wall images consist of parallel fringes, as predicted in Section 7.5.2. Figure 10.33
shows how the fringe contrast at a 180
◦
domain wall changes with image defocus
for a beam divergence angle of θ
c
= 10
−5
and 10
−6
rad and a defocus range of ±0.5
mm. The fringe contrast is strong for the convergent wall image (right-hand side)
but nearly vanishes for the divergent wall image. The fringe spacing is determined
by the product B
0
t, as described in Section 7.5.2. A smaller beam divergence angle
extends the defocus range for which Fresnel fringes are visible.
The through-focus series in Fig. 10.32(c) shows that the contrast of 180
◦
domain
walls is significantly stronger than that of 71
◦
walls, implying that the larger the
change in magnetization (either magnitude or direction) across the domain wall, the
more pronounced the image contrast. The through-focus series in Fig. 10.32(d) is
644 Phase contrast microscopy
-75 -65 -55 -45
-35 -25 -15 -5
5152535
45 55 65 75
(a) (b)
(c) (d)
Fig. 10.32. Fresnel image simulations for two parallel 180
◦
domain walls (a) and (b), and for
the domain configuration in Fig. 7.35(a), (c) and (d). The microscope accelerating voltage
is 200 kV, B
0
t = 100 nm T, θ
c
= 0.1 mrad, aperture radius q
a
= 0.2nm
−1
. (a) and (c) show
calculated images for a defocus range from −75 to +75 µm, (b) has θ
c
= 0.001 mrad and a
defocus range of ±750 µm, and (d) is similar to (c), except that astigmatism is included in
the computation (C
a
= 8 µm, φ
a
= 60
◦
). The intensity of each individual image was scaled
between 0 and 255.
identical to that in (c), except for the presence of two-fold astigmatism (C
a
= 8 µm,
φ
a
= 60
◦
). Comparing the image for a defocus of +5 µm to the corresponding
image without astigmatism shows that astigmatism can completely remove the
contrast for domain walls in certain orientations, while enhancing the contrast for
other orientations. It is hence imperative that astigmatism be corrected properly, so
that for the in-focus condition no domain wall contrast is observed.
We will now show that Fresnel contrast occurs wherever the phase profile has a
non-zero curvature. Consider a magnetic thin foil which gives rise to a phase shift
φ(r), where r is a vector in the plane normal to the electron beam. The phase shift
10.4 Lorentz image simulations 645
B
o
t = 200 nm T
θ
c
= 0.01 mrad
B
o
t = 100 nm T
θ
c
= 0.001 mrad
-0.5 mm 0.5 mm
(a)
(b)
0.0 mm
Image defocus
100 nm
Fig. 10.33. Fresnel through-focus montage for a 180
◦
domain wall of width δ = 60 nm.
The beam divergence angle is θ
c
= 10
−4
rad for the upper image and θ
c
= 10
−6
rad for the
bottom one.
includes both magnetic and electrostatic contributions, as described in Chapter 7
(equation 7.35). The exit wave function can be written as
ψ(r) = a(r)e
iφ(r)
.
The sample thickness may be non-uniform. We start from the Lorentz transfer
function (10.73). For small deflection angles (i.e. small |q|), and small defocus
values f , we can ignore the fourth-order terms in z
4
and we write for the paraxial
wave function in the back focal plane:
ψ(q) = F[ψ(r)]
1 − z
2
q
2
, (10.75)
where z
2
= z
2r
+ iz
2i
(see equation 10.73). We have conveniently ignored the aper-
ture function A(q); we will assume that the aperture has a small enough radius to

646 Phase contrast microscopy
exclude all Bragg reflections. This means that the exit wave ψ(r) is essentially the
bright field wave, which may be split into multiple components by the magnetic
domain structure of the sample, as illustrated in Fig. 7.35(c). The wave function
in the image plane is given by the inverse Fourier transform of equation (10.75),
which is (dropping the argument r):
ψ = ae
iφ
− z
2
F
−1
$
F
$
ae
iφ
%
q
2
%
. (10.76)
Writing F[ae
iφ
] = f (q)wehave
F
−1
$
F
$
ae
iφ
%
q
2
%
=
..
q
2
f (q)e
2πiq·r
dq
=
−1
4π
2
..
f (q)∇
2
e
2πiq·r
dq
=
−1
4π
2
∇
2
$
F
−1
[
f (q)
]
%
=
−1
4π
2
∇
2
$
ae
iφ
%
and therefore
ψ = ae
iφ
+
z
2
4π
2
∇
2
$
ae
iφ
%
. (10.77)
The image intensity is then given by the modulus squared of this expression, and
we leave it to the reader to show that (ignoring terms in λ
2
and in the absence of
astigmatism):
I = a
2
−
λ f
2π
∇·
a
2
∇φ
+
(
θ
c
f
)
2
2
$
a∇
2
a − a
2
(∇φ)
2
%
. (10.78)
For a uniform background intensity we have a
2
= 1, and therefore
I = 1 −
λ f
2π
∇
2
φ −
(
θ
c
f
)
2
2
(∇φ)
2
. (10.79)
For realistic conditions, the last term will be small compared to the other two, and
we find that the image intensity is unity everywhere except when ∇
2
φ is non-zero,
or, equivalently, wherever the curvature of the phase is non-zero. For a constant foil
thickness, magnetic contrast will be visible only in those regions where the gradient
of the phase ∇φ is not constant, i.e. at the domain walls. The image contrast is also
linear in the defocus f , which explains the contrast reversal between under-focus
and over-focus images.
Foucault domain contrast can also be simulated using the
LorentzExample.f90
program by simply moving the aperture to an off-axis location. Figure 10.34 shows
three sets of simulated Foucault images for a pair of 180
◦
domain walls (a), and for
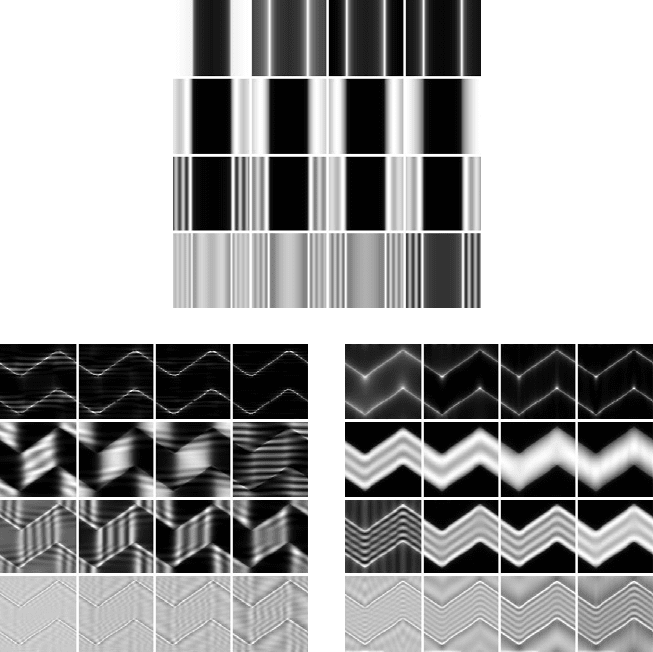
10.4 Lorentz image simulations 647
0.1825 0.1850 0.1875 0.1900
0.1925 0.1950 0.1975 0.2000
0.2025 0.2050 0.2075 0.2100
0.2125 0.2150 0.2175 0.2200
(a)
(b) (c)
Fig. 10.34. Simulated Foucault series for a 0.2nm
−1
radius aperture and the indicated
aperture shifts. Imaging parameters are identical to those used for Fig. 10.32. The aperture
shift is in the horizontal direction for (a) and (b), and along the vertical direction for (c).
the intersecting domains of Fig. 7.35 (b and c). The material parameters are identical
to those used in Fig. 10.32. The aperture radius is q
a
= 0.2nm
−1
; the aperture
shifts are indicated by the numbers in Fig. 10.34(a). Foucault contrast appears
when the aperture begins to intersect the beams deflected by the various magnetic
domains. The easiest way to visualize this is with respect to Fig. 7.35(c): imagine
an aperture that just encloses all four deflected beams. When this aperture is moved
in any direction, one or more of the beams will be cut off and the corresponding
magnetic domain will become dark. If the aperture shift directions are calibrated
with respect to the image orientation, then it is in principle possible to derive the
local magnetization direction from a pair of Foucault images with aperture shifts
in independent directions.
