Griffiths D. Head First Statistics
Подождите немного. Документ загружается.

you are here 4 61
measuring central tendency
Finding the median
If the mean becomes misleading because of skewed data and outliers,
then we need some other way of saying what a typical value is. We can
do this by, quite literally, taking the middle value. This is a different
sort of average, and it’s called the median.
To find the median of the Kung Fu class, line up all the ages in
ascending order, and then pick the middle value, like this:
19 19 20 20 20 21 21 100 102
Here’s the number in the
middle. This is the median, 20.
If you line all the ages up in ascending order, the value 20 is exactly
halfway along. Therefore, the median of the Kung Fu class is 20.
What if there had been an even number of people in the class?
19 20 20 20 21 21 100 102
If there’s an even number of
people in the class, there will
be no single middle number.
If you have an even set of numbers, just take the mean of the two
middle numbers (add them together, and divide by 2), and that’s
your median. In this case, the median is 20.5.
We’ve seen that if you have 9 numbers, the median is the number at position
5. If you have 8 numbers, it’s the number at position 4.5 (halfway between
the numbers at position 4 and 5). What about if you have n numbers?
The median
is always in
the middle.
It’s the
middle value.

62 Chapter 2
How to find the median in three steps:
1. Line your numbers up in order, from smallest to largest.
2. If you have an odd number of values, the median is the one
in the middle. If you have
n
numbers, the middle number is
at position (
n
+ 1) / 2.
3. If you have an even number of values, get the median by
adding the two middle ones together and dividing by 2.
You can find the midpoint by calculating (
n
+ 1) / 2. The
two middle numbers are on either side of this point.
Q:
Is it still OK to use the mean with skewed data if I really
want to?
A: You can, and people often do. However, in this situation the
mean won’t give you the best representation of what a typical value
is. You need the median.
Q:
You say that, but surely the whole point of the mean is
that it gives a typical value. It’s the average.
A: The big danger is that the mean will give a value that doesn’t
exist in the data set. Take the Kung Fu class as an example. If you
were to go into the class and pick a person at random, the chances
are that person would be around 20 years old because most people
in the class are that sort of age. Just going with the mean doesn’t
give you that impression. Finding the median can give you a more
accurate perspective on the data.
But sometimes even the median will give a value that’s not in the
data set, like our example on the previous page. That’s precisely why
there’s more than one sort of average; sometimes you need to use
different methods in order to accurately say what a typical value is.
Q:
So is the median better than the mean?
A: Sometimes the median is more appropriate than the mean,
but that doesn’t make it better. Most of the time you’ll need to use
the mean because it usually offers significant advantages over the
median. The mean is more stable when you are sampling data. We’ll
come back to this later in the book.
Q:
How do I use the mean or median with categorical data?
What about examples like the data on page 9 of Chapter 1?
A: You can only find the mean and median of numerical data.
Don’t worry, though, there’s another sort of average that deals with
just this problem that we’ll explore later on.
Q:
I always get right- and left-skewed data mixed up. How do
I remember which is which?
A: Skewed data has a “tail” of outliers. To see which direction
the data is skewed in, find the direction the tail is pointing in. For
example, right-skewed data has a tail that points to the right.
calculating the median: step-by-step
you are here 4 63
measuring central tendency
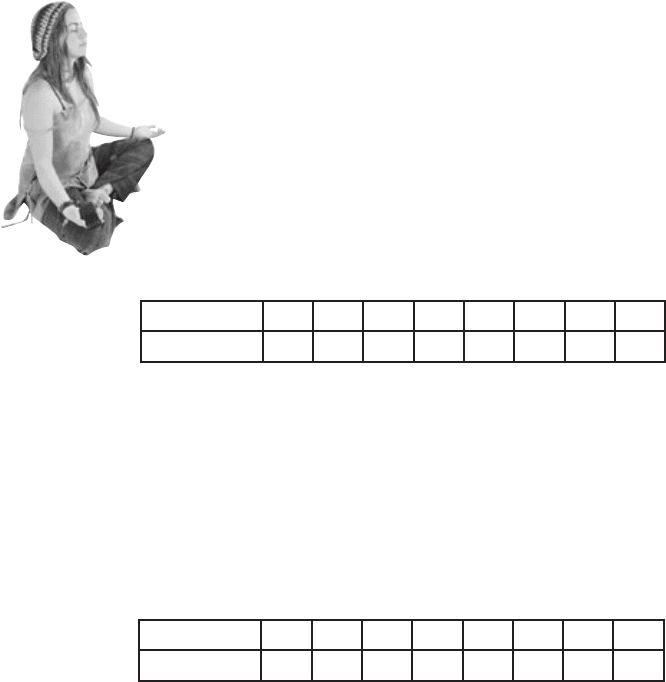
Values 1 2 3 4 5 6 7 8
Frequency 4 6 4 4 3 2 1 1
Values 1 4 6 8 9 10 11 12
Frequency 1 1 2 3 4 4 5 5
BE the data
Your job is to play like you’re the data, and
say what the median is for each set, whether
the data is skewed, and whether the mean
is higher or lower than the median.
Give reasons why.
BE the data
64 Chapter 2
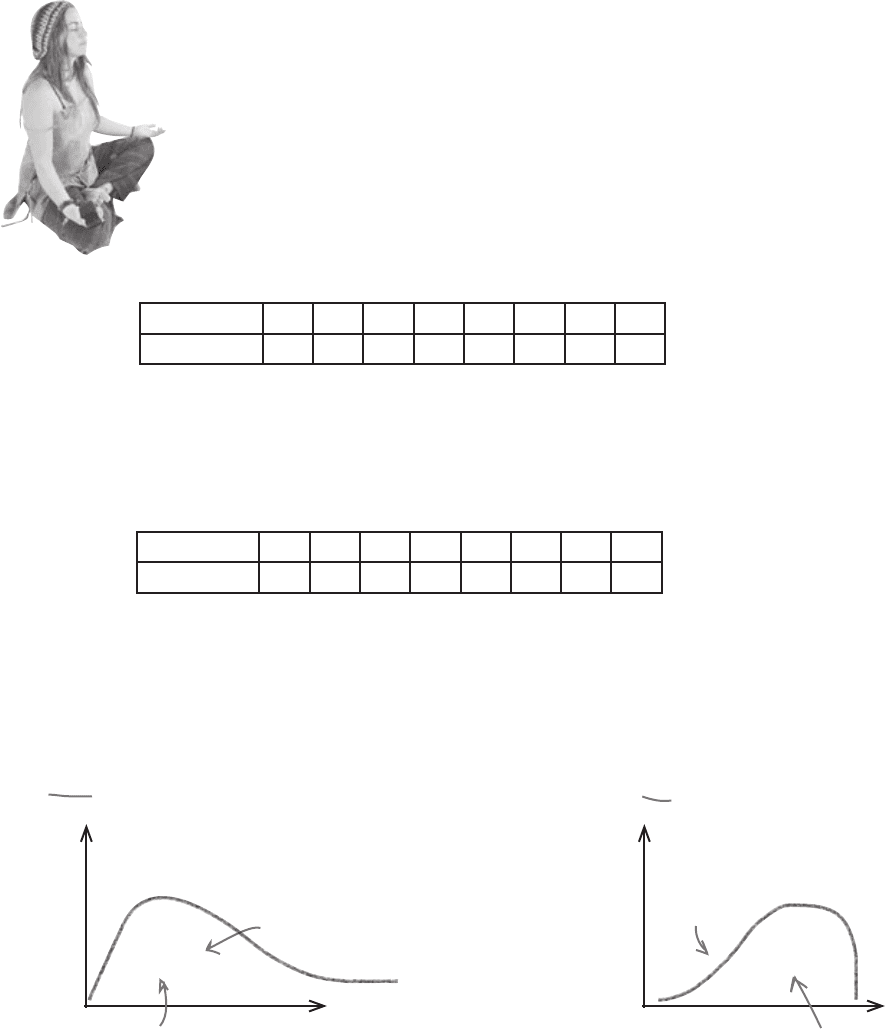
Values 1 2 3 4 5 6 7 8
Frequency 4 6 4 4 3 2 1 1
Values 1 4 6 8 9 10 11 12
Frequency 1 1 2 3 4 4 5 5
There are 25 numbers, and if you line them all up, the median is half way
along, i.e., 13 numbers along. The median is 3. The data is skewed to the
right, which pulls the mean higher. Therefore, the mean is higher than the
median.
The median here is 10. The data is skewed to the left, so the mean is
pulled to the left. Therefore, the mean is lower than the median.
If the data is skewed to the
right, the mean is to the
right of the median (higher).
If the data is skewed to
the left, the mean is to the
left of the median (lower).
BE the data Solution
Your job is to play like you’re the data, and
say what the median is for each set, whether
the data is skewed, and whether the mean
is higher or lower than the median.
Give reasons why.
be the data solution
Mean
Median
Median
Mean

you are here 4 65
measuring central tendency
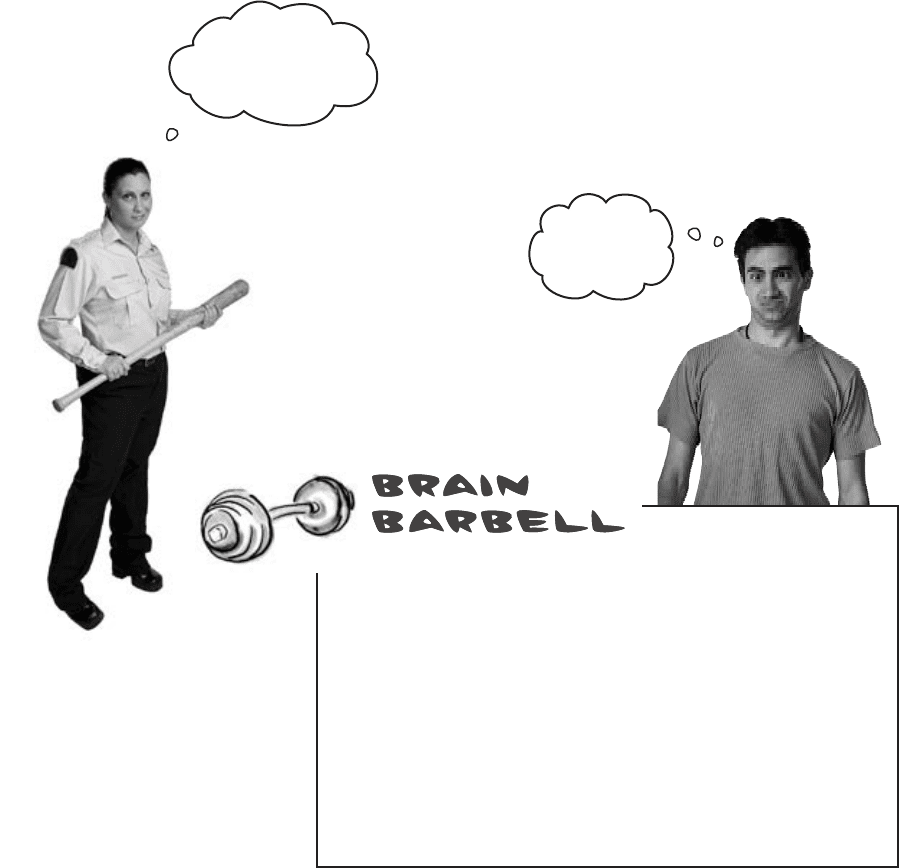
Business is booming
Your work on averages is really paying off. More and more people are
turning up for classes at the Health Club, and the staff is finding it
much easier to find classes to suit the customers.
This teenager is after a swimming class where he can make new
friends his own age.
The swimming
class you have for
teenagers sounds cool!
Sign me up right now.
The swimming class has a mean age of 17, and
coincidentally, that’s the median too. It sounds like this
class will be perfect for him.
Let’s see what happens...
Swimming Class
Median age: 17
66 Chapter 2
The Little Ducklings swimming class
The Little Ducklings class meets at the swimming pool twice a
week. In this class, parents teach their very young children how to
swim, and they all have lots of fun splashing about in the water.
Look who turned up for lessons...
Stop! Where’s
your baby?
What the
heck?
What do you think might have gone wrong this time?
when good medians go bad
you are here 4 67
measuring central tendency
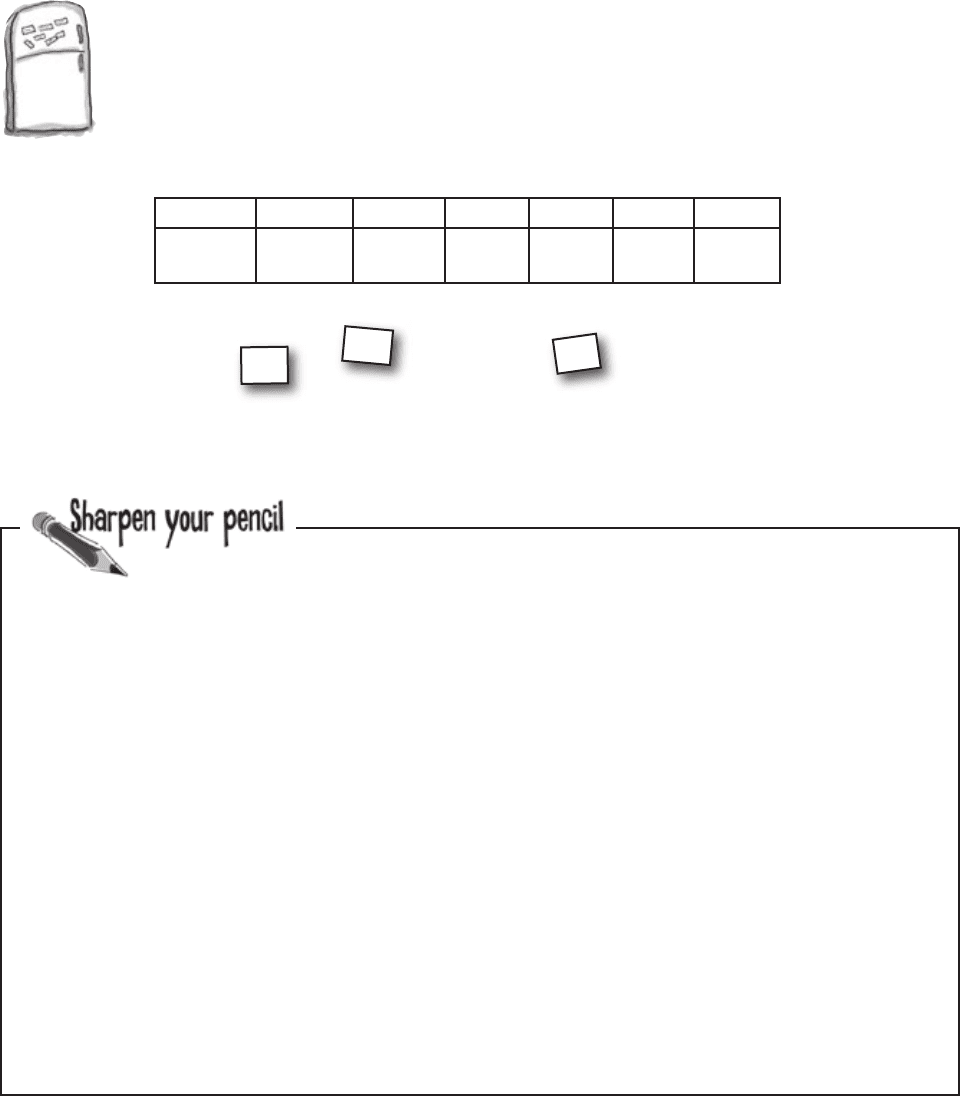
Frequency Magnets
Here are the ages of people who go to the Little Ducklings class, but
some of the frequencies have fallen off. Your task is to put them in the
right slot in the frequency table. Nine children and their parents go to
the class, and the mean and median are both 17.
3
4
4
Age 1 2 3 31 32 33
Frequency 3 2 2
When you’ve figured out the frequencies for the Little Ducklings
class, sketch the histogram. What do you notice?
68 Chapter 2
Age 1 2 3 31 32 33
Frequency 3 2 2
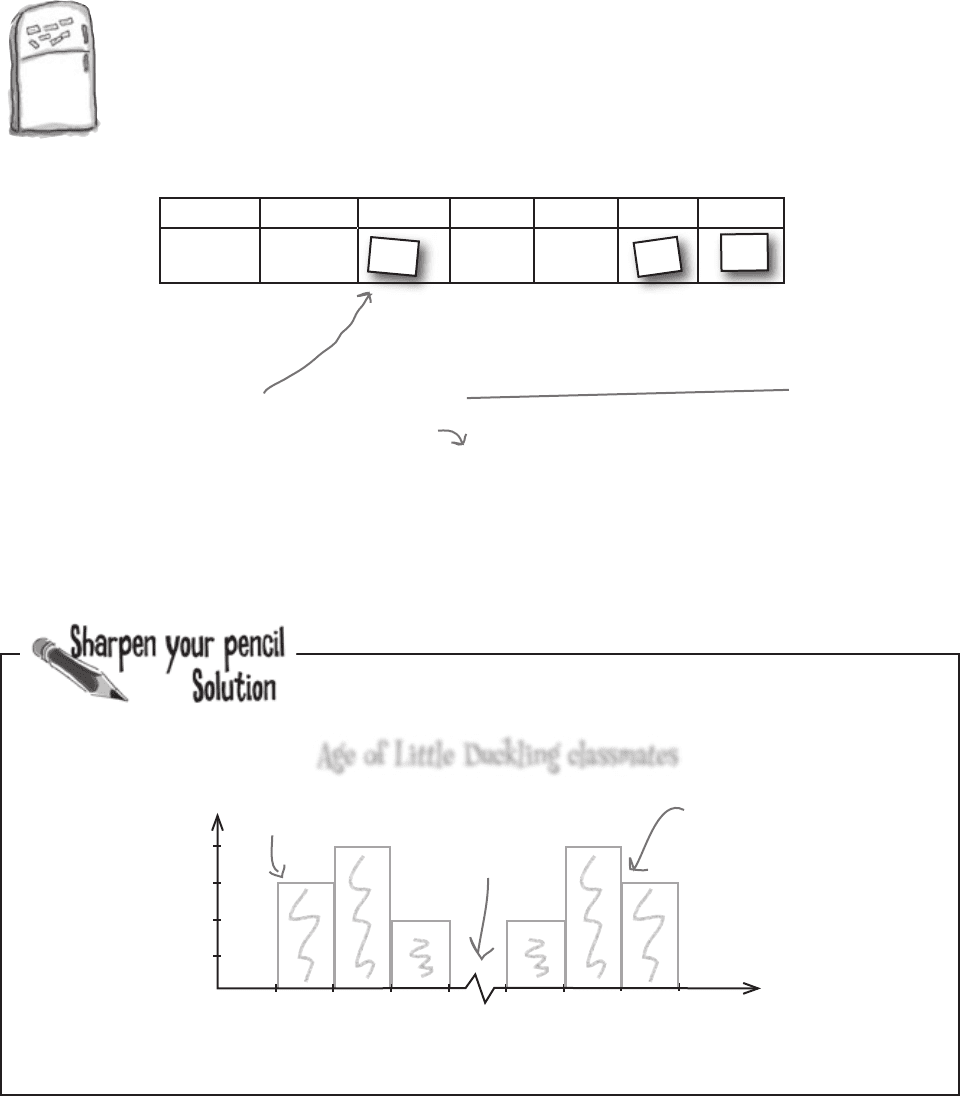
Frequency Magnets
Here are the ages of people who go to the Little Ducklings class, but
some of the frequencies have fallen off. Your task is to put them in the
right slot in the frequency table. Nine children and their parents go to
the class, and the mean and median are both 17.
3
4
4
We’re told there are 9 children,
so the frequencies of the
children must add up to 9. There
must be 4 children of age 2.
The mean is 17. If we substitute in a and b for the
unknown frequencies, we get
1x3 + 2x4 + 3x2 + 31x2 + 32a + 33b = 17
18
3 + 8 + 6 + 62 + 32a + 33b = 17x18 = 306
32a + 33b = 306 - (3 + 8 + 6 + 62) = 306 - 79
32a + 33b = 227
As 32a + 33b is odd, this means tha
t b must be 3,
and a must be 4.
Multiply both
sides by 18.
When you’ve figured out the frequencies for the Little Ducklings
class, sketch the histogram. What do you notice?
exercise solutions
Age of Little Duckling classmates
2
1
3
1 2 3 4 31 32
33 34
4
frequency
age
0
One group of
data here
Another group
of data here
The mean and
median are here.
It doesn’t look like one set of data, but two: one for the parents and one for the children.

you are here 4 69
measuring central tendency
What went wrong with the mean and median?
Let’s take a closer look at what’s going on.
Here are the ages of people who go to the Little Ducklings class.
1 1 1 2 2 2 2 3 3 31 31 32 32 32 32 33 33 33
There’s an even number of values, so the
median is halfway between 3 and 31. Take
the mean of these two numbers—(3 +31)/2—
and you get 17.
The mean and median for the class are both 17, even though there are
no 17-year-olds in the class!
But what if there had been an odd number of people in the class. Both
the mean and median would still have been misleading. Take a look:
1 1 1 2 2 2 2 2 3 3 31 31 32 32 32 32 33 33 33
If we add another 2-year-old
to the class, the median becomes
3. But what about the adults?
If another 33-year-old were added to the class instead, the median
would be 31. But that fails to reflect all the kids in the class.
Whichever value we choose for the average age, it seems misleading.
What should we do for data like this?
1 1 1 2 2 2 2 2 3 31 31 31 32 32 32 32 33 33 33
If we add another 31-year-old
to the class, the median instead
becomes 31. This time, we ignore
the kids!
If another two-year-old were to join the class, like we see above, the
median would still be 3. This reflects the age of the children, but
doesn’t take the adults into account.
70 Chapter 2
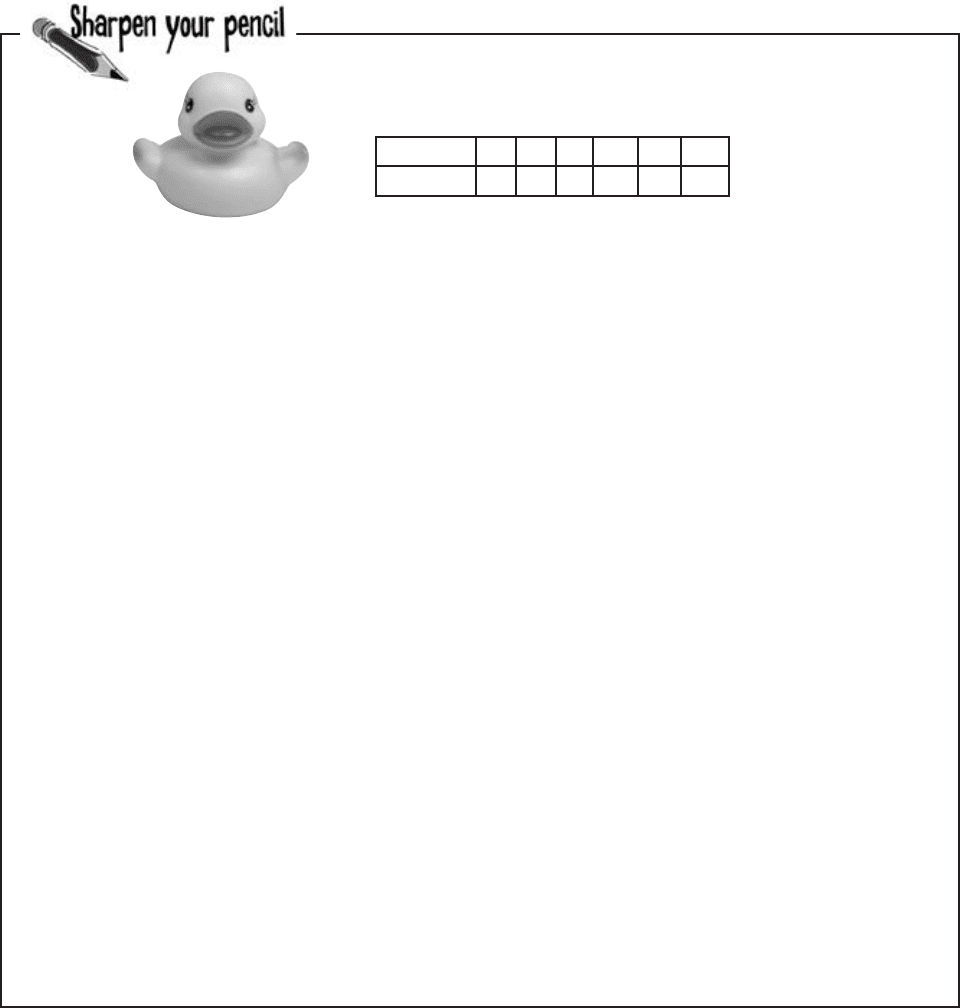
Here’s where you have to really think about how you can best
give a representative age (or ages) for the Little Ducklings class.
Here’s a reminder of the data:
Age 1 2 3 31 32 33
Frequency 3 4 2 2 4 3
1. Why do you think the mean and median both failed for this data? Why are they misleading?
2. If you had to pick one age to represent this class, what would it be? Why?
3. What if you could pick two ages instead? Which two ages would you pick, and why?
sharpen your pencil