Griffiths D. Head First Statistics
Подождите немного. Документ загружается.


you are here 4 91
measuring variability and spread
Wait a sec, do you mean
we pretend the outliers
don’t exist? That doesn’t
sound very scientific.
We need to get away from outliers
The main problem with the range is that, by definition, it includes outliers. If
data has outliers, the range will include them, even though there may be only
one or two extreme values. What we need is a way of negating the impact of
these outliers so that we can best describe how values are dispersed.
One way out of this problem is to look at a kind of mini range, one that
ignores the outliers. Instead of measuring the range of the whole set of data,
we can find the range of part of it, the part that doesn’t contain outliers.
Ignore the
outliers here.
Take the range
of these values.
We need a consistent way of doing this.
One of the problems with ignoring outliers on an ad hoc basis is
that it’s difficult to compare sets of data. How do we know that
all sets of data are omitting outliers in exactly the same way?
We need to make sure that we use the same mini range definition
for all the sets of data we’re comparing. But how?
frequency
score
92 Chapter 3
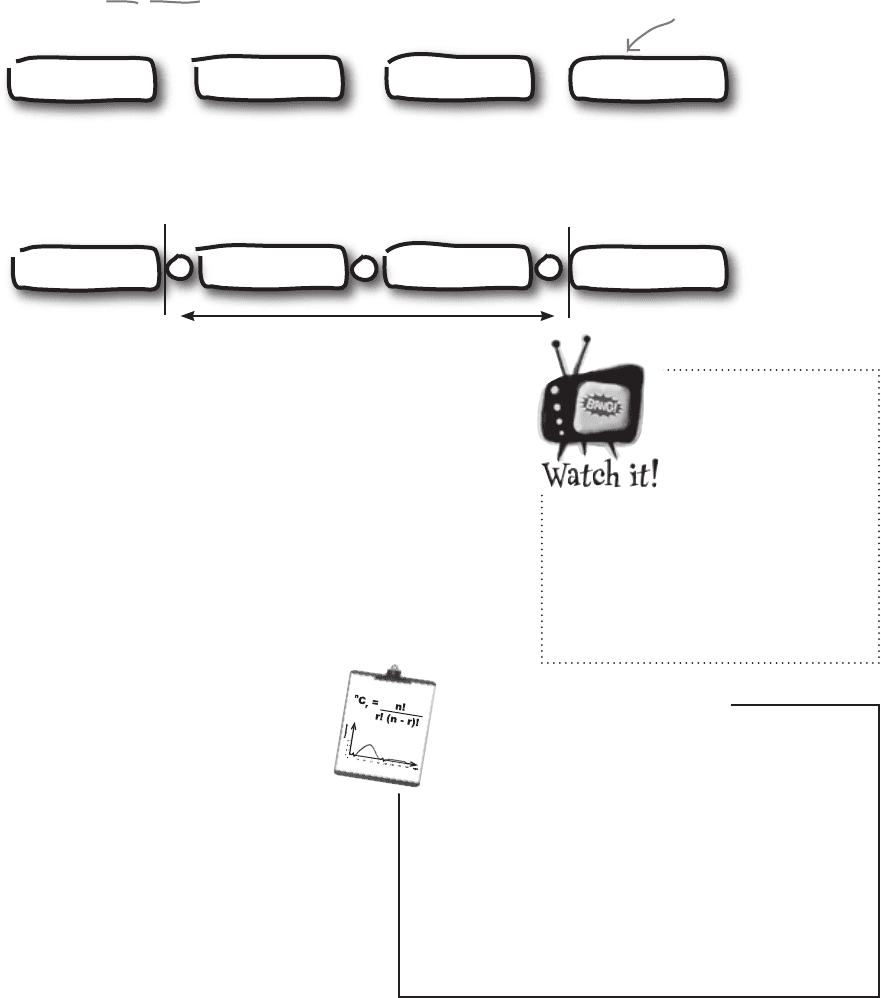
1 1 1 2 2 2 2 3 3 3 3 3 4 4 4 4 5 5 5 10
This is the same data
as before, but this time
it’s split into quarters.
We can then construct a range using the values that fall between the two outer splits:
The values that split the data into equal chunks are known as quartiles,
as they split the data into quarters. Finding quartiles is a bit like finding
the median. Instead of finding the value that splits the data in half, we’re
finding the values that split the data into quarters.
The lowest quartile is known as the lower quartile, or first quartile
(Q1), and the highest quartile is known as the upper quartile, or third
quartile (Q3). The quartile in the middle (Q2) is the median, as it splits
the data in half. The range of the values in these two quartiles is called the
interquartile range (IQR).
Taking the range between these values
gives us a brand new “mini” range.
Interquartile range =
Upper quartile – Lower quartile
The interquartile range gives us a standard,
repeatable way of measuring how values are
dispersed. It’s another way in which we can
compare different sets of data. But what about
outliers? Does the interquartile range help us
deal with these too? Let’s take a look.
Quartiles come to the rescue
One way of constructing a mini range is to just use values around the center of
the data. We can construct a range in this way by first lining up the values in
ascending order, and then splitting the data into four equally sized chunks, with
each chunk containing one quarter of the data.
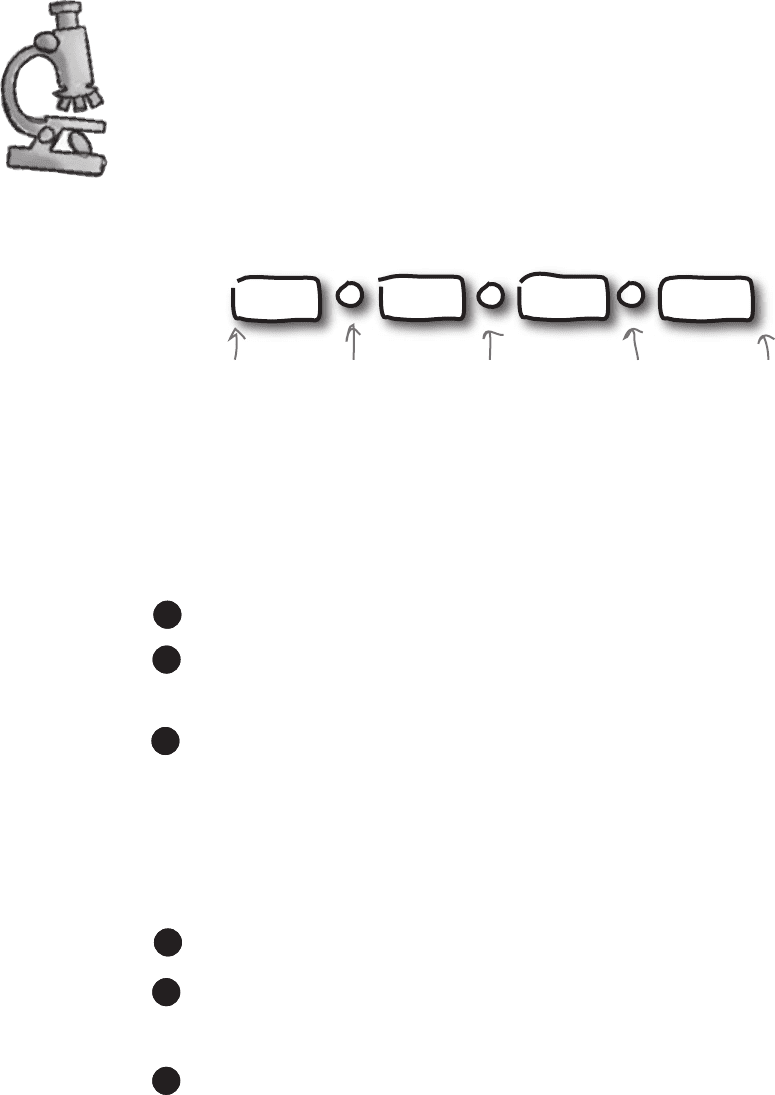
1 1 1 2 2 2 2 3 3 3 3 3 4 4 4 4 5 5 5 10
Some textbooks
refer to
quartiles as the
set of values
within each
quarter of the data.
We’re not. We’re using the term
quartile to specifically refer to
the values that split the data
into quarters.
Q1 Q2 Q3
quartiles and the interquartile range
Quartiles
Quartiles are values that split your data into
quarters. The lowest quartile is called the
lower quartile, and the highest quartile is
called the upper quartile.
The middle quartile is the median.
Vital StatisticsVital Statistics
you are here 4 93
measuring variability and spread
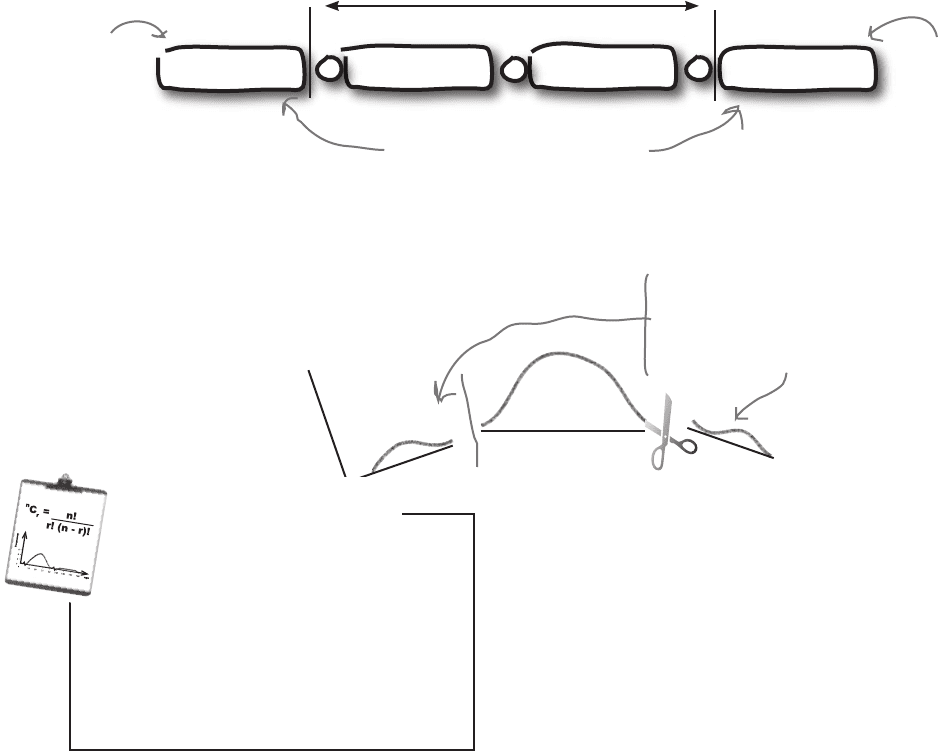
The interquartile range excludes outliers
The good thing about the interquartile range is that it’s a lot less
sensitive to outliers than the range is.
The upper and lower quartiles are positioned so that the lower quartile
has 25% of the data below it, and the upper quartile has 25% of the
data above it. This means that the interquartile range only uses the
central 50% of the data, so outliers are disregarded. As we’ve said
before, outliers are extreme high or low values in the data, so by only
considering values around the center of the data, we automatically
exclude any outliers.
Here’s our data again. Can you see how the interquartile range
effectively ignores any outliers?
As the interquartile range only uses the central 50% of the data,
outliers are excluded irrespective of whether they are extremely high or
extremely low. They can’t be in the middle. This means that any outliers
in the data are effectively cut out.
...but excludes the two outer
quarters where any outliers live.
The interquartile range includes
the middle part of the data...
Outliers are always extreme high
or low values, and the interquartile
range cuts these out.
Excluding the outliers with the interquartile range means
that we now have a way of comparing different sets of data
without our results being distorted by outliers. Before we can
figure out the interquartile range, though, we have to work
out what the quartiles are. Flip the page, and we’ll show you
how it’s done.
1 1 1 2 2 2 2 3 3 3 3 3 4 4 4 4 5 5 5 10
25% of the
data in the
set
25% of the
data in the
set
Q1 Q2 Q3
Interquartile Range
A “mini range” that’s less sensitive to
outliers. You find it by calculating
Upper quartile - Lower quartile
Vital StatisticsVital Statistics
94 Chapter 3
Median Upper
bound
Lower
bound
Lower
quartile
Upper
quartile
Quartile anatomy
Finding the quartiles of a set of data is a very similar process to finding the median.
If you line all of your values up in ascending order, the median is the value right in
the very center. If you have n numbers, it’s the number that’s at position (n + 1) ÷ 2,
and if this falls halfway between two numbers, you take their average.
If we then further split the data into quarters, the quartiles are the values at each of
these splits. The lowest is the lower quartile, and the highest is the upper quartile:
Finding the position of the quartiles is slightly trickier than finding the position of the
median, as we need to make sure the values we choose keep the data split into the
right proportions. There is a way of doing it though; let’s start with the lower quartile.
Finding the position of the lower quartile
Finding the position of the upper quartile
Q1 Q2 Q3
a closer look at quartiles
First, start off by calculating n ÷ 4.
11
If n ÷ 4 is not an integer, then round it up. This gives you the position of
the lower quartile.
33
If this gives you an integer, then the lower quartile is positioned halfway
between this position and the next one. Take the average of the
numbers at these two positions to get your lower quartile.
22
As an example, if you have 6 numbers, start off by calculating 6 ÷ 4, which
gives you 1.5. Rounding this number up gives you 2, which means that the lower
quartile is at position 2.
Start off by calculating 3n ÷ 4.
11
If it’s an integer, then the upper quartile is positioned halfway between
this position and the next. Add the two numbers at these positions
together and divide by 2.
22
If 3n ÷ 4 is not an integer, then round it up. This new number gives you
the position of the upper quartile.
33
you are here 4 95
measuring variability and spread
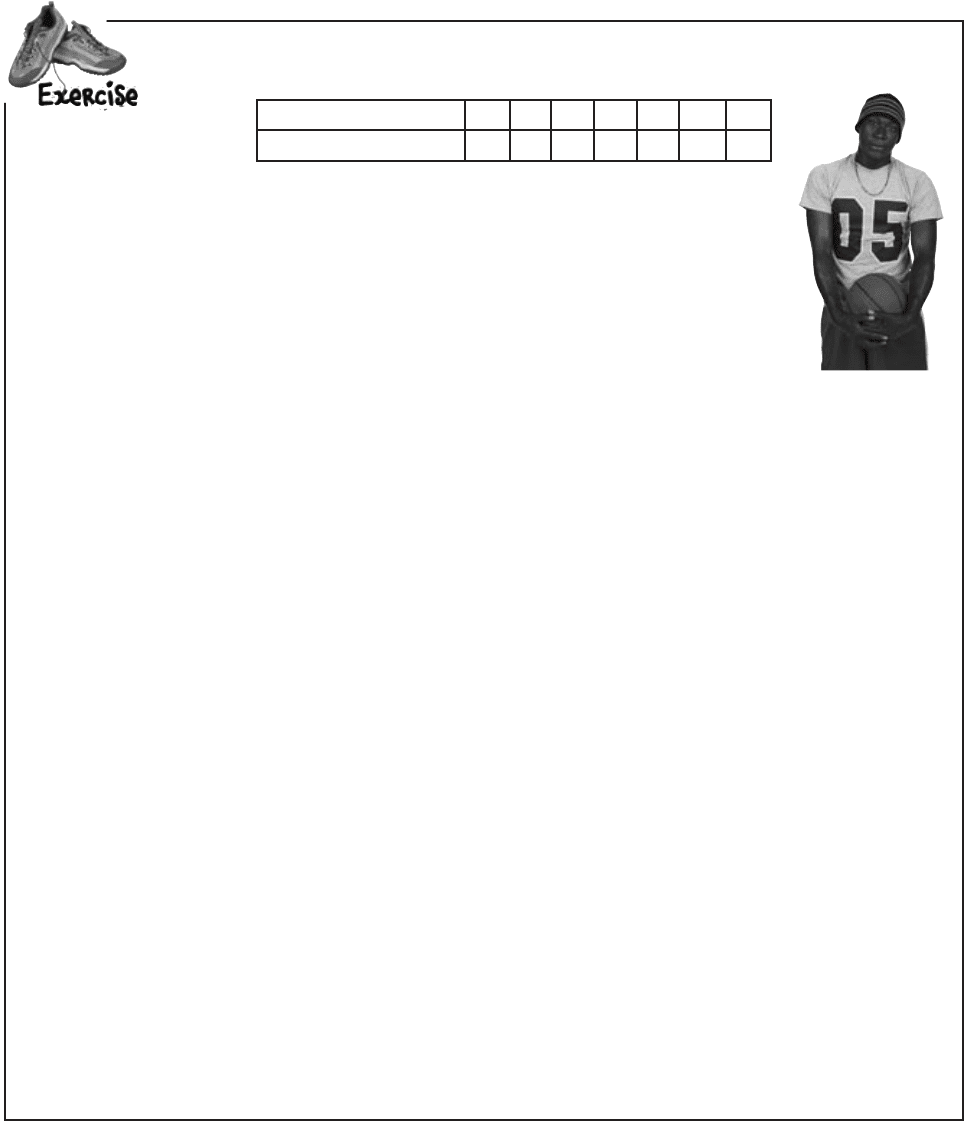
It’s time to put your quartile skills into practice. Here are the scores for one of the players:
Points scored per game 3 6 7 10 11 13 30
Frequency 2 1 2 3 1 1 1
1. What’s the range of this set of data?
2. What are the lower and upper quartiles?
3. What’s the interquartile range?
96 Chapter 3
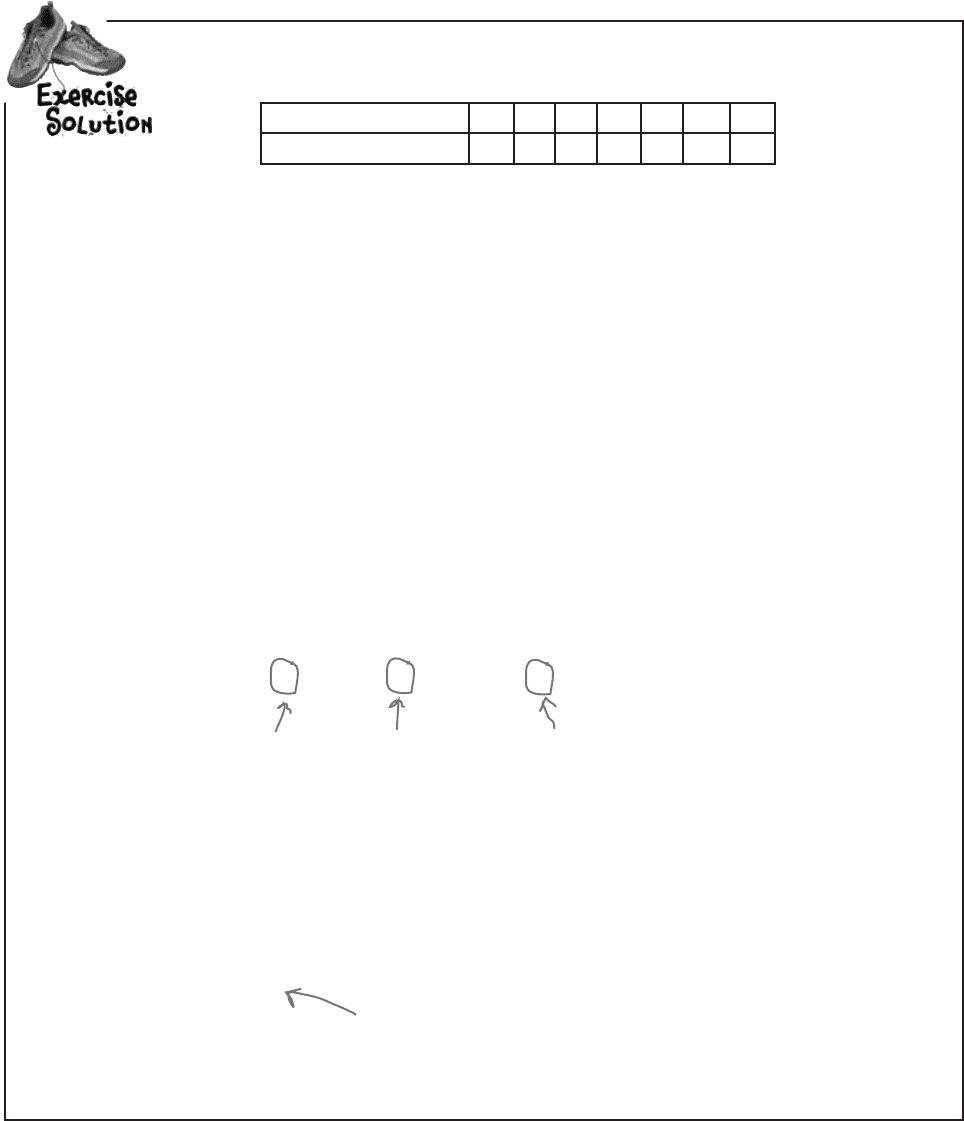
Here are the scores for one of the players:
Points scored per game 3 6 7 10 11 13 30
Frequency 2 1 2 3 1 1 1
1. What’s the range of this set of data?
2. What are the lower and upper quartiles?
3. What’s the interquartile range?
The lower bound of this set of data is 3, as that’s the lowest number of points scored. The upper
bound is 30, as that’s the highest. This gives us
Range = upp
er bound - lower bound
= 30 - 3
= 27
3 3 6 7 7 10 10 10 11 13 30
Let’s start with the lower quartile. There are 11 numbers, and calculating 11 ÷ 4 gives us 2.75.
Rounding this number up gives us the position of the lower quartile, so the lower quartile is at position
3. This means that the lower quartile is 6.
Now let’s find the upper quartile. 3 x 11 ÷ 4 gives us 8.25, and rounding this up gives us 9 - the
upper quartile is at position 9. This means that the upper quartile is 11.
Lower quartile
Upper quartile
Median
The interquartile range is the lower bound subtracted from the upper bound.
Interquartile range = upper bound - lower bound
= 11 - 6
= 5
This is MUCH lower than the
range, as it excludes outliers.
exercise solution

you are here 4 97
measuring variability and spread
Q:
I get why mean, median, and mode are useful, but why
do I need to know how the data is spread out?
A: Averages offer you only a one-dimensional view of your
data. They tell you what the center of your data is, but that’s it.
While this can be useful, it’s often not enough. You need some
other way of summarizing your data in addition to the average.
Q:
So is the median the same as the interquartile range?
A:
No. The median is the middle value of the data, and the
interquartile range is the range of the middle 50% of the values.
Q:
What’s the point of all this quartiles stuff? It seems like
a really tedious way to calculate ranges.
A: The problem with using the range to measure how your
data is dispersed is that it’s very sensitive to outliers. It gives you
the difference between the lower and upper bounds of your data,
but just one outlier can make a huge difference to the result.
We can get around this by focusing only on the central 50% of the
data, as this excludes outliers. This means finding quartiles, and
using the interquartile range. So even though finding quartiles
is trickier than finding the lower and upper bounds, there are
definite advantages.
Q:
Should I always use the interquartile range to measure
the spread of data?
A: In a lot of cases, the interquartile range is more meaningful
than the range, but it all depends on what information you
really need. There are other ways of measuring how values are
dispersed that you might want to consider too; we’ll come to
these later.
Q:
Would I ever want to look at just one quartile of my
data instead of the range or the interquartile range?
A: It’s possible. For example, you might be interested in what
the high values look like, so you’d just look at what values are in
the upper quarter of your data set, using the upper quartile as a
cut-off point.
Q:
Would I ever want to break my data into smaller pieces
than quarters? How about breaking my data into, say, 10
pieces instead of 4?
A: Yes, there are times when you might want to do this. Turn
the page, and we’ll show you more...
The upper and lower bounds of the data are
the highest and lowest values in the data set.
The range is a simple way of measuring how
values are dispersed. It’s given by:
range = upper bound - lower bound
The range is very sensitive to outliers.
The interquartile range is less sensitive to
outliers than the range.
Quartiles are values that split your data
into quarters. The highest quartile is called
the upper quartile, and the lowest quartile is
called the lower quartile. The middle quartile
is the median.
The interquartile range is the range of
the central 50% of the data. It’s given by
calculating
upper quartile - lower quartile
98 Chapter 3
We’re not just limited to quartiles
So far we’ve looked at how the range and interquartile range give us
ways of measuring how values are dispersed in a set of data. The range
is the difference between the highest number and the lowest, while the
interquartile range focuses on the middle 50% of the data.
So are they the only
sorts of ranges I can use?
Do I get any other options?
There are other sorts of ranges we can use in
addition to the range and interquartile range.
Our original problem with the range was that it’s extremely sensitive to
outliers. To get around this, we divided the data into quarters, and we
used the interquartile range to provide us with a cut-down range of the
data.
While the interquartile range is quite common, it’s not the only way of
constructing a mini range. Instead of splitting the data into quarters,
we could have split it into some other sort of percentage and used that
for our range instead.
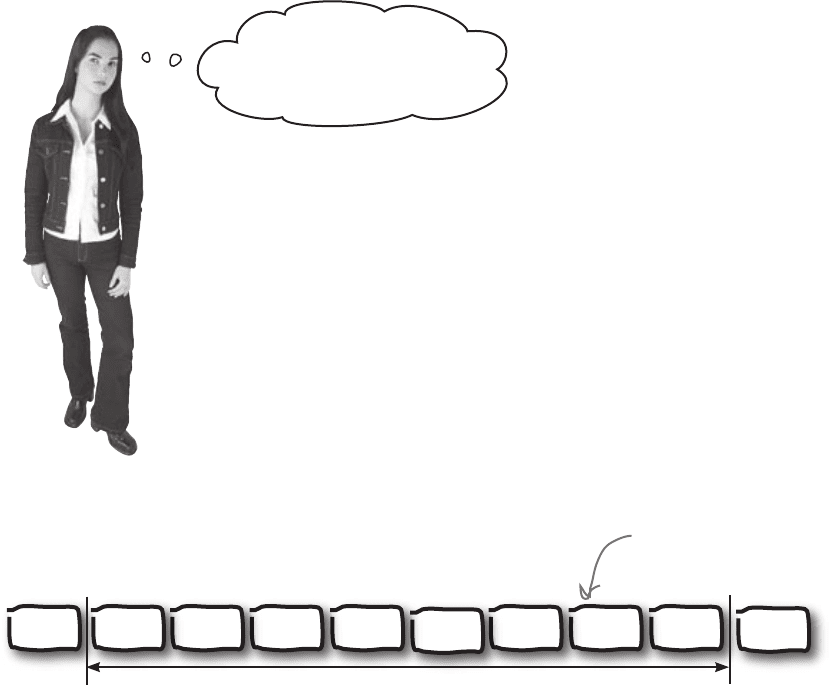
As an example, suppose we’d divided our set of data into tenths instead
of quarters so that each segment contains 10% of the data. We’d have
something like this:
This is the same set of data, but it’s
now split into 10 equally sized chunks.
Each chunk contains 10% of the data.
If you break up a set of data into percentages, the values that split the
data are called percentiles. In the case above, our data is split into
tenths, so the values are called deciles.
We can use percentiles to construct a new range called the
interpercentile range.
We can use these divisions to create a brand new mini range.
1 1 1 2 2 2 2 3 3 3 3 3 4 4 4 4 5 5 5 10
splitting data into percentiles
you are here 4 99
measuring variability and spread
So what are percentiles?
Percentiles are values that split your data into percentages in the same way that quartiles split data
into quarters. Each percentile is referred to by the percentage with which it splits the data, so the 10th
percentile is the value that is 10% of the way through the data. In general, the xth percentile is the
value that is k% of the way through the data. It’s usually denoted by P
k
.
k%
P
k
P
k
is the value k% of the
way through your data.
Percentile uses
Even though the interpercentile range isn’t that commonly used, the
percentiles themselves are useful for benchmarking and determining
rank or position. They enable you to determine how high a particular
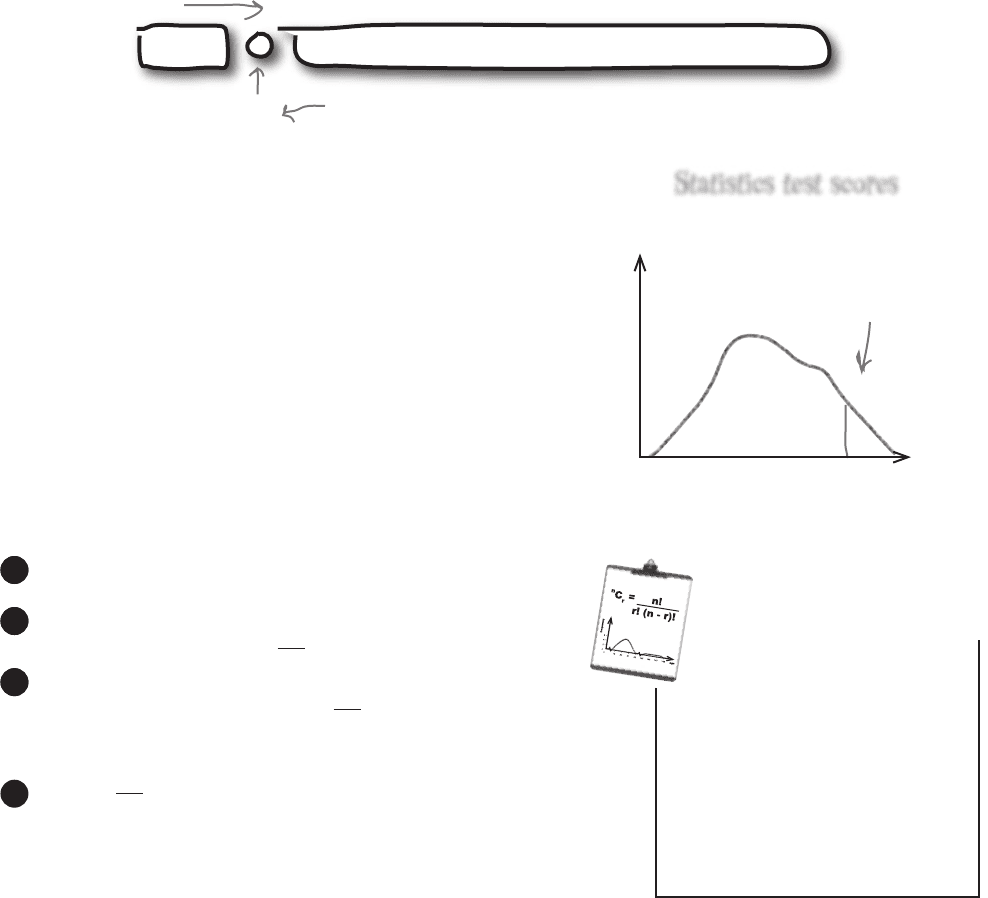
value is relative to all the others. As an example, suppose you heard you
scored 50 on your statistics test. With just that number by itself, you’d
have no idea how well you’d done relative to anyone else. But if you
were told that the 90th percentile for the exam was 50, you’d know that
you scored the same as or better than 90% of the other people.
50
P
90
If you scored 50 and knew
that P
90
= 50, you’d have
beaten or matched the score
of 90% of other people.
Finding percentiles
You can find percentiles in a similar way to how you find quartiles.
Quartiles are actually a type of percentile. The lower quartile is P
25
,
and the upper quartile is P
75
. The median is P
50
.
frequency
score
Statistics test scores
First of all, line all your values up in ascending order.
11
To find the position of the kth percentile out of n numbers,
start off
by calculating .
22
If this gives you an integer, then your percentile is halfway
between the v
alue at position and the next number
along. Take the average of the numbers at these two positions
to give you your percentile.
33
If is not an integer, then round it up. This then gives
you the position of the percentile.
As an example, if you have 125 numbers and want to find the 10th
percentile, start off by calculating 10
×
125 ÷ 100. This gives you a
value of 12.5. Rounding this number up gives you 13, which means
that the 10th percentile is the number at position 13.
4
Percentile
The kth percentile is the
value that’s k% of the way
through your data. It’s
denoted by
P
k
Vital StatisticsVital Statistics
k
n
100
)(
k
n
100
)(
k
n
100
)(
100 Chapter 3
We’ve talked a lot about different sorts of ranges, and it would be
useful to be able to compare the ranges of different sets of data in a
visual way. There’s a chart that specializes in showing different types
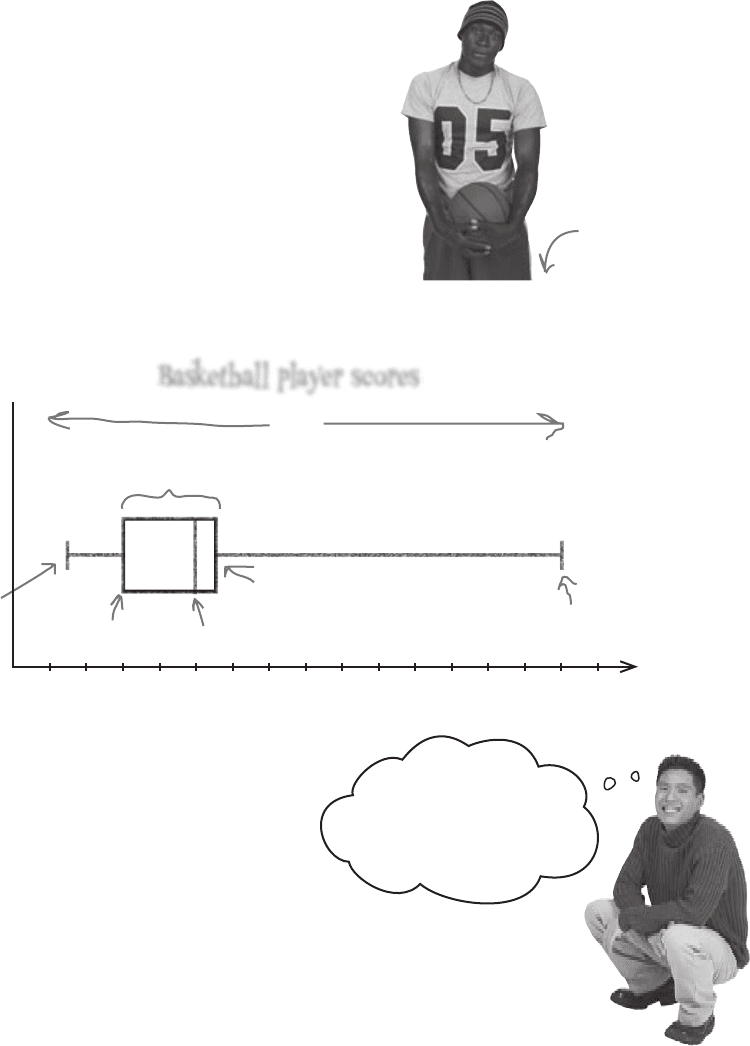
of ranges: the box and whisker diagram, or box plot.
A box and whisker diagram shows the range, interquartile range, and
median of a set of data. More that one set of data can be represented
on the same chart, which means it’s a great way of comparing data
sets.
To create a box and whisker diagram, first you draw a box against a
scale with the left and right sides of the box representing the lower
and upper quartiles, respectively. Then, draw a line inside the box to
mark the value of the median. This box shows you the extent of the
interquartile range. After that, you draw “whiskers” to either side of
your box to show the lower and upper bounds and the extent of the
range. Here’s a box and whisker diagram for the scores of our player
from page 95:
Lower bound
Upper
bound
Median
Lower
quartile
Upper quartile
Interquartile range
Range
If your data has outliers, the range will be wider. On a box
and whisker diagram, the length of the whiskers increases in
line with the upper and lower bounds. You can get an idea of
how data is skewed by looking at the whiskers on the box and
whisker diagram.
If the box and whisker diagram is symmetric, this means that
the underlying data is likely to be fairly symmetric, too.
So box and whisker
diagrams are really just
a neat way of showing
ranges and quartiles.
3 3 6 7 7 10 10 10 11 13 30
Here’s a reminder of
the data.
Score
Player
2
0
4 6 8 10 12 14 16 18 20 22 24 26 28 30 32
Box and whisker plots let you visualize ranges
Basketball player scores
box and whisker plots