Griffiths D. Head First Statistics
Подождите немного. Документ загружается.


you are here 4 81
measuring central tendency
The Case of the Ambiguous Average: Solved
What’s going on with the average? Who do you think
is right?
The workers, the managers, and the CEO are
each using a different sort of average.
The workers are using the median, which
minimizes the effect of the CEO’s salary.
The managers are using the mean. The large
salary of the CEO is skewing the data to the right,
which is making the mean artificially high.
The CEO is using the mode. Most workers are paid $500 per week,
and so this is the mode of the salaries.
So who’s right? In a sense, they all are, although it has to be said
that each group of people are using the average that best supports
what they want. Remember, statistics can be informative, but
they can also be misleading. For balance, we think that the most
appropriate average to use in this situation is the median because
of the outliers in the data.
Five Minute
Mystery
Solved
Five Minute
Mystery
Solved
this is a new chapter 83
measuring variability and spread
3
Power Ranges
Not everything’s reliable, but how can you tell?
Averages do a great job of giving you a typical value in your data set, but they
don’t tell you the full story. OK, so you know where the center of your data
is, but often the mean, median, and mode alone aren’t enough information
to go on when you’re summarizing a data set. In this chapter, we’ll show you
how to take your data skills to the next level as we begin to analyze ranges
and variation.
Don’t worry about the dinner,
Mother. When you have an oven
with a lower standard deviation,
you’ll never burn anything again.
84 Chapter 3
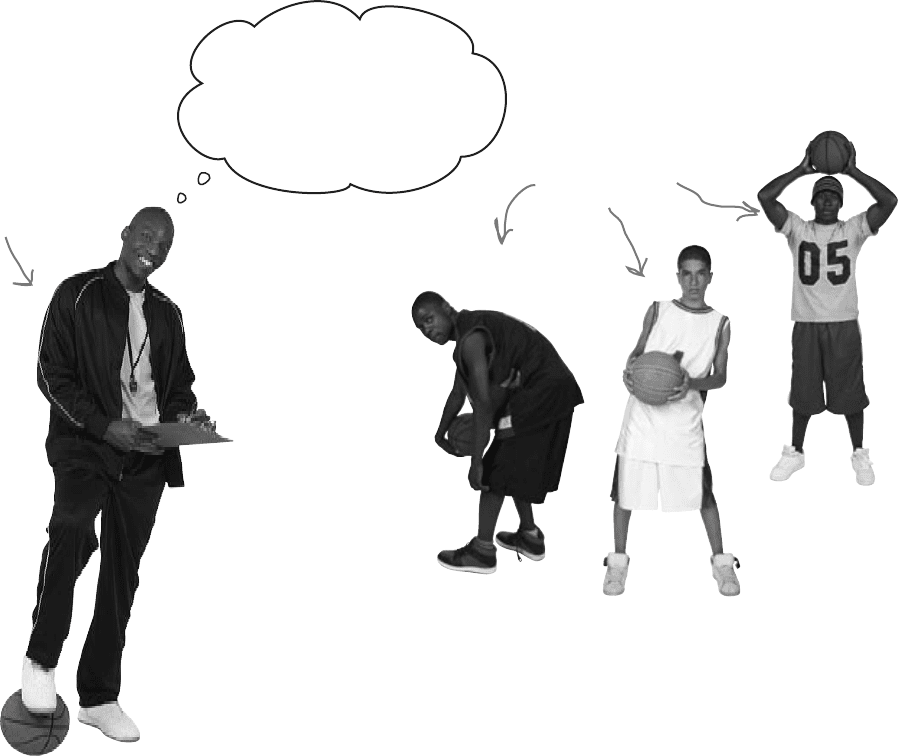
Wanted: one player
The Statsville All Stars are the hottest basketball team in the
neighborhood, and they’re the favorite to win this year’s league.
There’s only one problem—due to a freak accident, they’re a
player down. They need a new team member, and fast.
The new recruit must be good all-round, but what the coach
really needs is a reliable shooter. If he can trust the player’s
ability to get the ball in the basket, they’re on the team.
The coach has been conducting trials all week, and he’s down
to three players. The question is, which one should he choose?
All three players have
the same average score
for shooting, but I need some
way of choosing between them.
Think you can help?
The Statsville
All Stars coach
All three players had
the same average
score in the trials,
so how should the
coach decide which
to pick?
introducing the statsville all stars
you are here 4 85
measuring variability and spread
What information in addition to the average
would help the coach make his decision?
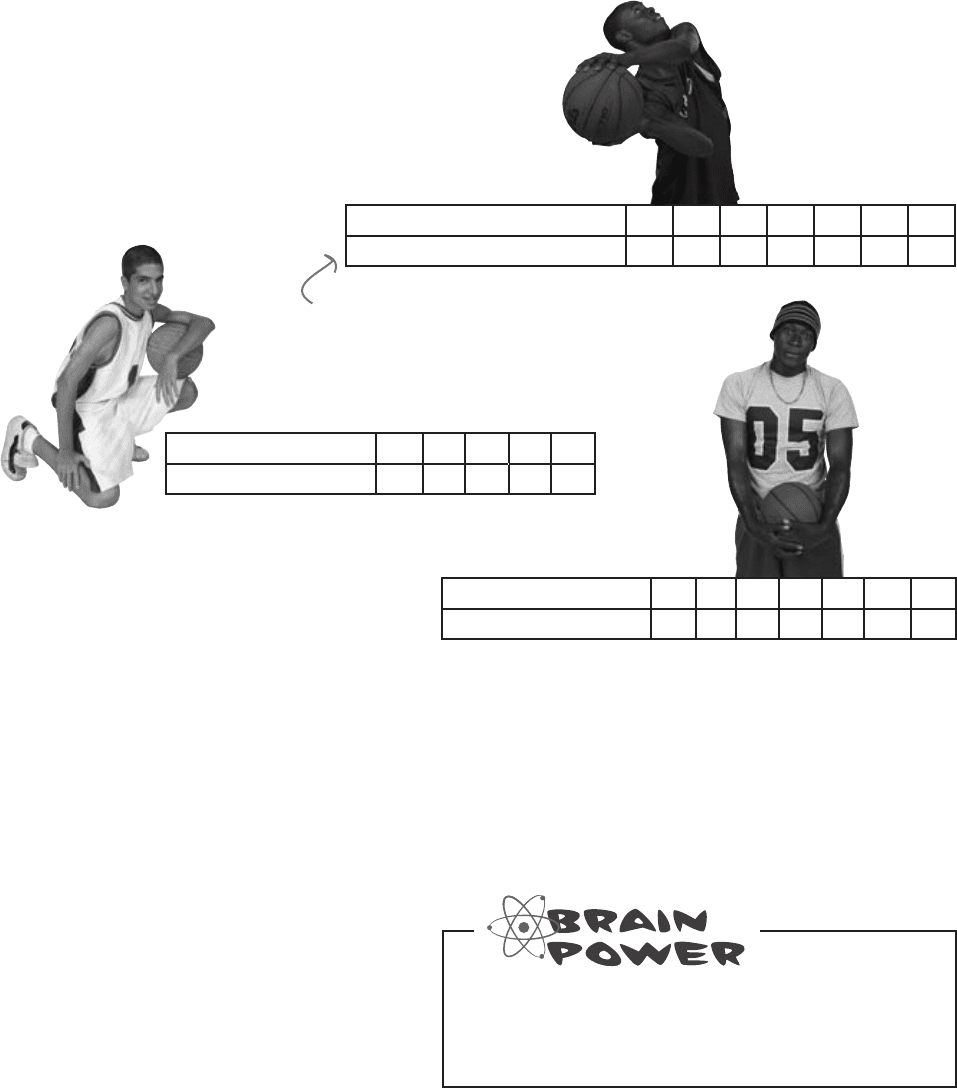
Points scored per game 7 8 9 10 11 12 13
Frequency 1 1 2 2 2 1 1
Here are the scores of the three players:
Each player has a mean, median, and mode score of 10 points, but if you look at
their scores, you’ll see they’ve all achieved it in different ways. There’s a difference in
how consistently the players have performed, which the average can’t measure.
What we need is a way of differentiating between the three sets of scores so that we
can pick the most suitable player for the team. We need some way of comparing the
sets of data in addition to the average—but what?
Points scored per game 7 9 10 11 13
Frequency 1 2 4 2 1
Here, frequency tells us the number of games
where the player got each score. This player
scored 9 points in 2 games, and 12 points in
1 game.
Points scored per game 3 6 7 10 11 13 30
Frequency 2 1 2 3 1 1 1
We need to compare player scores
86 Chapter 3
Use the range to differentiate between
data sets
So far we’ve looked at calculating averages for sets of data, but quite
often, the average only gives part of the picture. Averages give us a way of
determining where the center of a set of data is, but they don’t tell us how
the data varies. Each player has the same average score, but there are clear
differences between each data set. We need some other way of measuring
these differences.
We can differentiate between each set of data by looking at the way in which
the scores spread out from the average. Each player’s scores are distributed
differently, and if we can measure how the scores are dispersed, the coach
will be able to make a more informed decision.
Lower
bound
Upper
bound
Range
To calculate the range, we subtract the lower bound from the upper
bound. Looking at the data, the smallest value is 7, which means that
this is the lower bound. Similarly, the upper bound is the largest value,
or 13. Subtracting the lower bound from the upper bound gives us:
Range = upper bound - lower bound
= 13 - 7
= 6
so the range of this set of data is 6.
The range is a simple and easy way of measuring how spread out
values are, and it gives us another way of comparing sets of data.
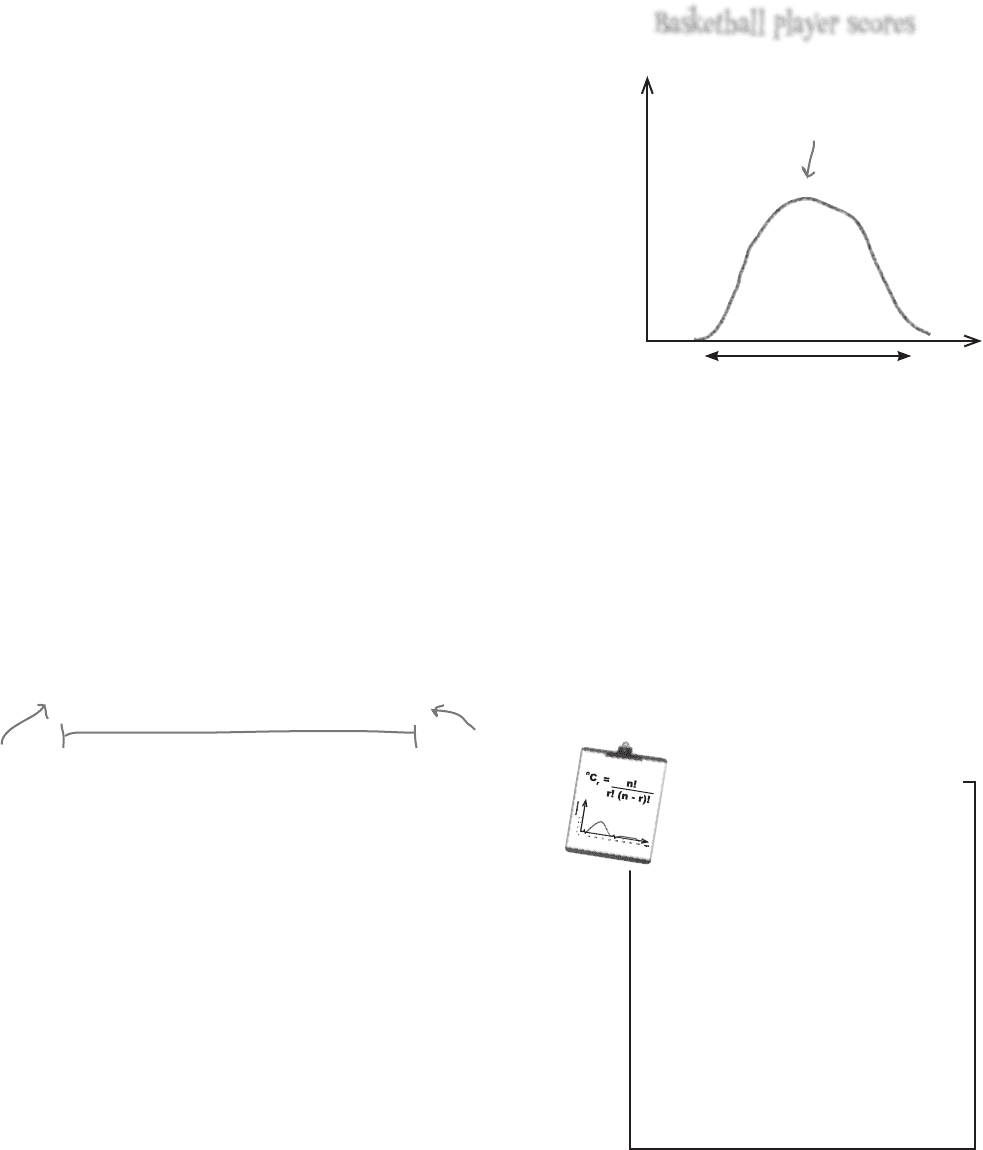
7 8 9 9 10 10 11 12 13
We can measure the
center of the data by
looking at averages.
The mean tells us nothing
about how spread out the
data is, so we need some
other measure to tell us this.
Measuring the range
We can easily do this by calculating the range. The range tells us over
how many numbers the data extends, a bit like measuring its width. To
find the range, we take the largest number in the data set, and then
subtract the smallest.
The smallest value is called the lower bound, and the largest value is
the upper bound.
Let’s take a look at the set of scores for one of the players and see how
this works. Here are the scores:
frequency
score
Basketball player scores
range measures data width
Range
The range is a way of
measuring how spread out a
set of values are. It’s given by
Upper bound - Lower bound
where the upper bound is the
highest value, and the lower
bound the lowest.
Vital StatisticsVital Statistics
you are here 4 87
measuring variability and spread
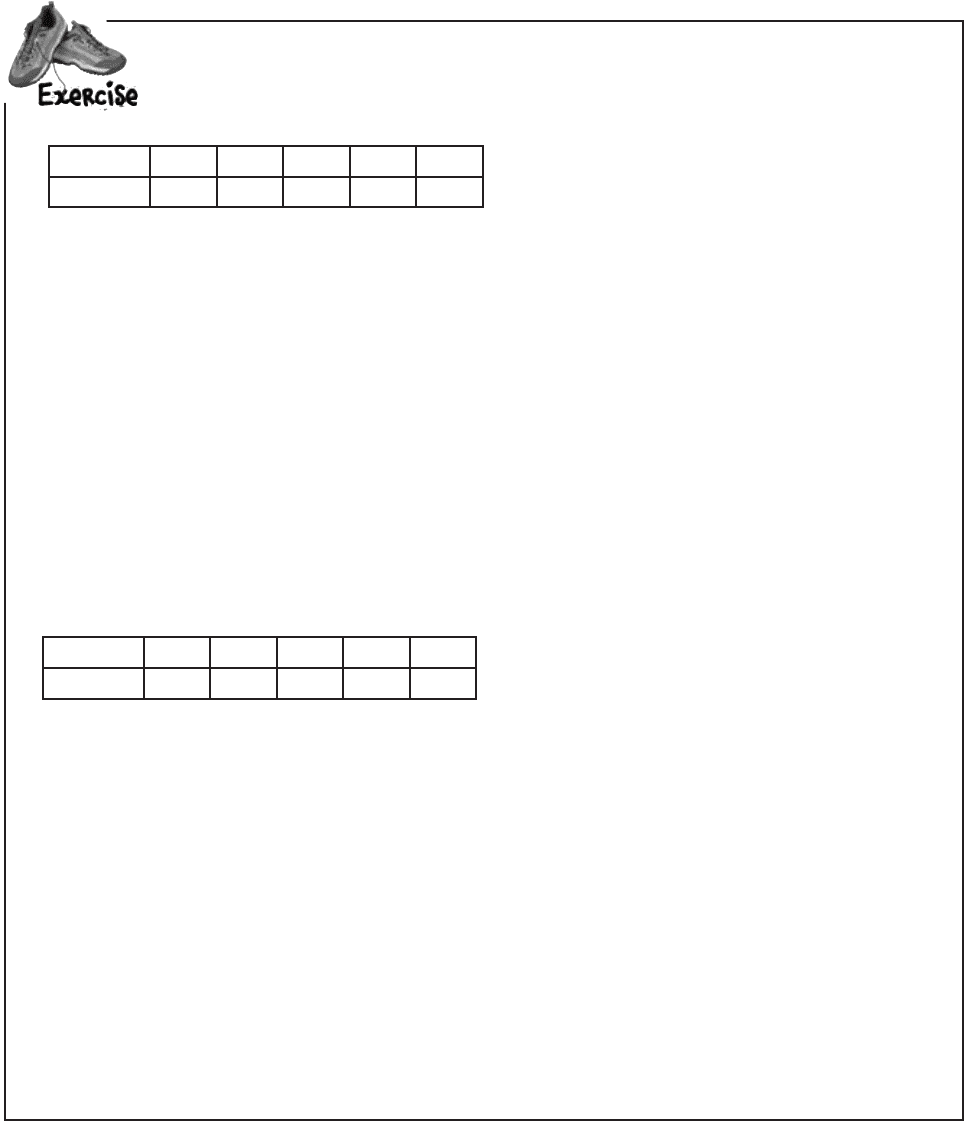
Work out the mean, lower bound, upper bound, and range for the following sets of data, and
sketch the charts. Are values dispersed in the same way? Does the range help us describe
these differences?
Score 8 9 10 11 12
Frequency 1 2 3 2 1
Score 8 9 10 11 12
Frequency 1 0 8 0 1
88 Chapter 3
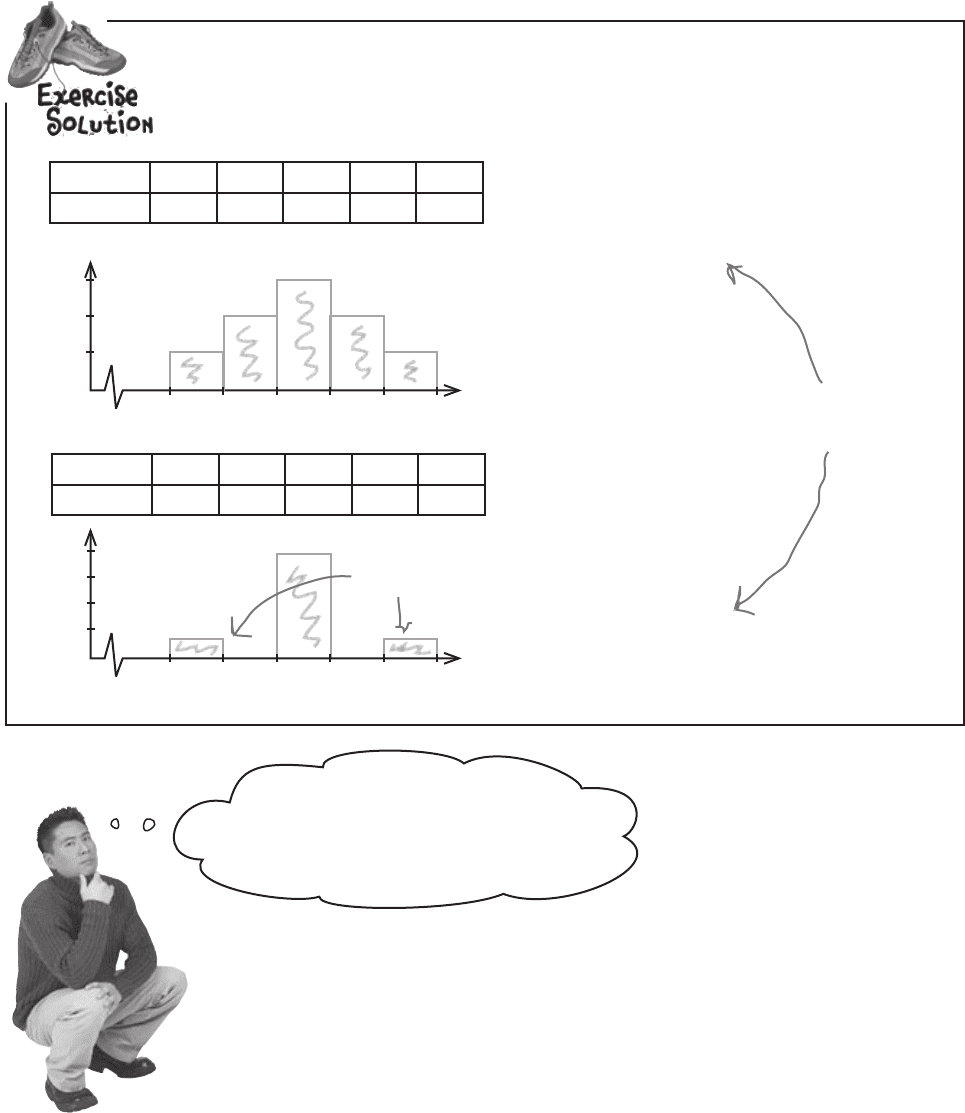
Work out the mean, lower bound, upper bound, and range for the following sets of basketball
scores, and sketch the charts. Are values dispersed in the same way? Does the range help us
describe these differences?
Score 8 9 10 11 12
Frequency 1 2 3 2 1
Score 8 9 10 11 12
Frequency 1 0 8 0 1
μ = 10
Lower bound = 8
Upper bound = 12
Range = 12 - 8
= 4
μ = 10
Lower bound = 8
Upper bound = 12
Range = 12 - 8
= 4
The range only describes the width of the data,
not how it’s dispersed between the bounds.
Both sets of data above have the same range, but the second
set has outliers—extreme high and low values. It looks like the
range can measure how far the values are spread out, but it’s
difficult to get a real picture of how the data is distributed.
Remember outliers?
There are two here.
Both data sets above have the same
range, but the values are distributed
differently. I wonder if the range really gives
us the full story about measuring spread?
Look, these results are the same
even though the data’s different.
4
2
8
6
7.5 8.5 9.5 10.5 11.5 12.5
2
1
3
7.5 8.5 9.5 10.5 11.5 12.5
frequencyfrequency
score
score
exercise solution
you are here 4 89
measuring variability and spread
The problem with outliers
The range is a simple way of saying what the spread of a set of
data is, but it’s often not the best way of measuring how the data
is distributed within that range. If your data has outliers, using
the range to describe how your values are dispersed can be very
misleading because of its sensitivity to outliers. Let’s see how.
Imagine you have a set of numbers as follows:
1 1 1 2 2 2 2 3 3 3 3 3 4 4 4 4 5 5 5
Here, numbers are fairly evenly distributed between the lower
bound and upper bound, and there are no outliers for us to worry
about. The range of this set of numbers is 4.
But what happens if we introduce an outlier, like the number 10?
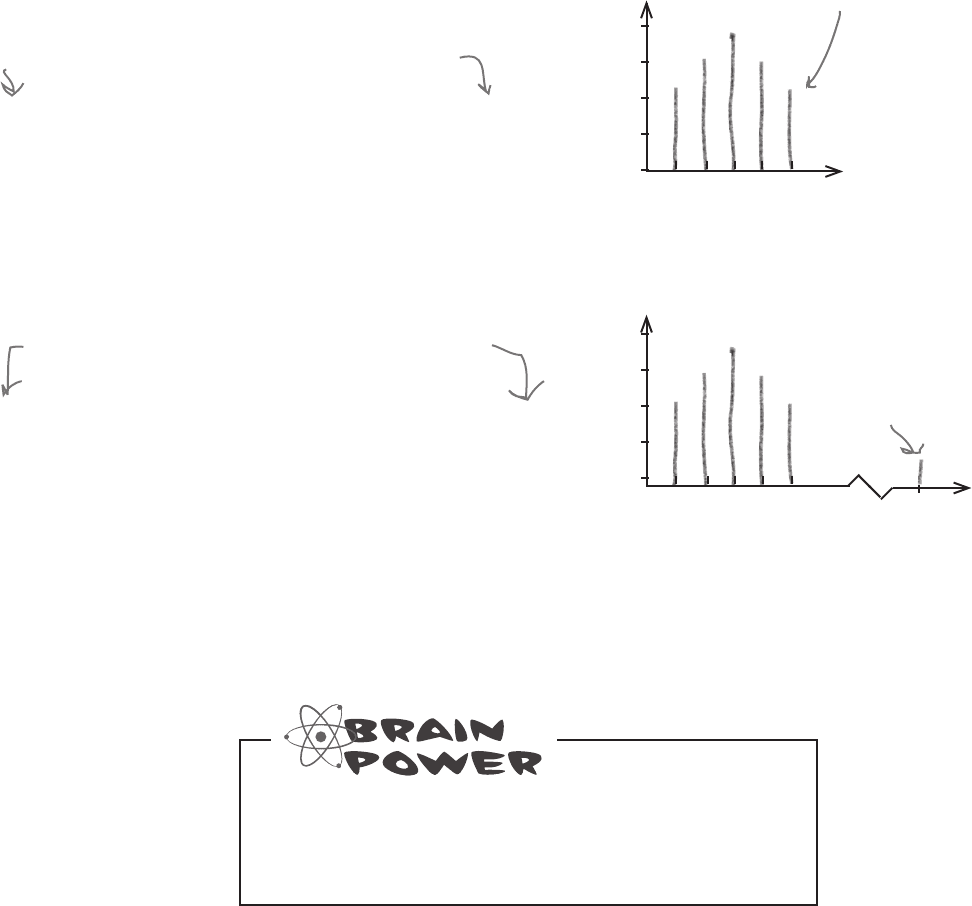
Here’s the data on a vertical line
chart (a type of bar chart that
uses lines instead of bars). Each
line represents the frequency of
each number in the data set.
1 1 1 2 2 2 2 3 3 3 3 3 4 4 4 4 5 5 5 10
Here’s the outlier
on the chart.
Our lower bound is the same, but the upper bound has gone up to
10, giving us a new range of 9. The range has increased by 5 just
because we added one extra number, an outlier.
Without the outlier, the two sets of data would be identical, so why
should there be such a big difference in how we describe how the
values are distributed?
Lower bound
of 1
Upper bound
of 5
The lower bound
is still 1.
But the upper bound
has increased to 10.
Can you think of a way in which we can construct
a range that’s less sensitive to outliers?
1 2 3 4 5
2
1
3
4
5
1 2 3 4 5
2
1
3
4
5
10
90 Chapter 3
So is it a bad idea to
use the range then?
The range is a great quick-and-dirty way to get an idea
of how values are distributed, but it’s a bit limited.
The range tells you how far apart your highest and lowest values are, but
that’s about it. It only provides a very basic idea of how the values are
distributed.
The primary problem with the range is that it only describes the width of
your data. Because the range is calculated using the most extreme values
of the data, it’s impossible to tell what that data actually looks like—and
whether it contains outliers. There are many different ways of constructing
the same range, and sometimes this additional information is important.
Mainly because it’s so simple.
The range is so simple that it’s easily understood by lots
of people, even those who have had very little exposure
to statistics. If you talk about a range of ages, for
example, people will easily understand what you mean.
Be careful, though, because there’s danger in its pure
simplicity. As the range doesn’t give the full picture of
what’s going on between the highest and lowest values,
it’s easy for it to be used to give a misleading impression
of the underlying data.
If the range is
so limited, why do
people use it?
range: uses and limitations