Griffiths D. Head First Statistics
Подождите немного. Документ загружается.

you are here 4 661
statistics tables
#3.
X
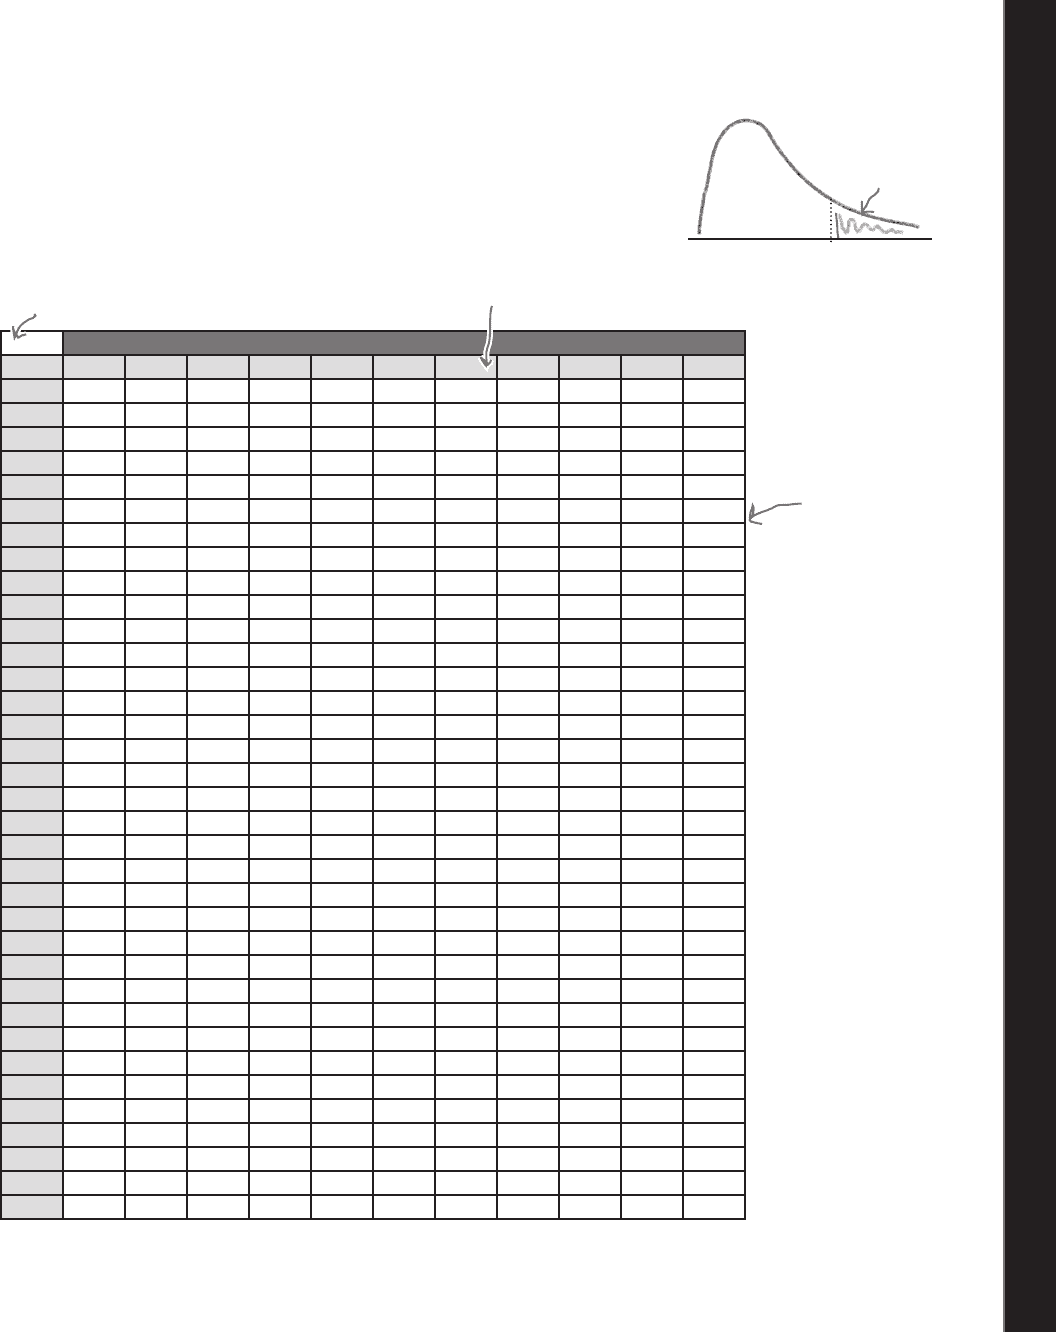
2
critical values
Tail probability α
ν
.25 .20 .15 .10 .05 .025 .02 .01 .005 .0025 .001
1 1.32 1.64 2.07 2.71 3.84 5.02 5.41 6.63 7.88 9.14 10.83
2 2.77 3.22 3.79 4.61 5.99 7.38 7.82 9.21 10.60 11.98 13.82
3 4.11 4.64 5.32 6.25 7.81 9.35 9.84 11.34 12.84 14.32 16.27
4 5.39 5.99 6.74 7.78 9.49 11.14 11.67 13.28 14.86 16.42 18.47
5 6.63 7.29 8.12 9.24 11.07 12.83 13.39 15.09 16.75 18.39 20.51
6 7.84 8.56 9.45 10.64 12.59 14.45 15.03 16.81 18.55 20.25 22.46
7 9.04 9.80 10.75 12.02 14.07 16.01 16.62 18.48 20.28 22.04 24.32
8 10.22 11.03 12.03 13.36 15.51 17.53 18.17 20.09 21.95 23.77 26.12
9 11.39 12.24 13.29 14.68 16.92 19.02 19.68 21.67 23.59 25.46 27.88
10 12.55 13.44 14.53 15.99 18.31 20.48 21.16 23.21 25.19 27.11 29.59
11 13.70 14.63 15.77 17.28 19.68 21.92 22.62 24.72 26.76 28.73 31.26
12 14.85 15.81 16.99 18.55 21.03 23.34 24.05 26.22 28.30 30.32 32.91
13 15.98 16.98 18.20 19.81 22.36 24.74 25.47 27.69 29.82 31.88 34.53
14 17.12 18.15 19.41 21.06 23.68 26.12 26.87 29.14 31.32 33.43 36.12
15 18.25 19.31 20.60 22.31 25.00 27.49 28.26 30.58 32.80 34.95 37.70
16 19.37 20.47 21.79 23.54 26.30 28.85 29.63 32.00 34.27 36.46 39.25
17 20.49 21.61 22.98 24.77 27.59 30.19 31.00 33.41 35.72 37.95 40.79
18 21.60 22.76 24.16 25.99 28.87 31.53 32.35 34.81 37.16 39.42 42.31
19 22.72 23.90 25.33 27.20 30.14 32.85 33.69 36.19 38.58 40.88 43.82
20 23.83 25.04 26.50 28.41 31.41 34.17 35.02 37.57 40.00 42.34 45.31
21 24.93 26.17 27.66 29.62 32.67 35.48 36.34 38.93 41.40 43.78 46.80
22 26.04 27.30 28.82 30.81 33.92 36.78 37.66 40.29 42.80 45.20 48.27
23 27.14 28.43 29.98 32.01 35.17 38.08 38.97 41.64 44.18 46.62 49.73
24 28.24 29.55 31.13 33.20 36.42 39.36 40.27 42.98 45.56 48.03 51.18
25 29.34 30.68 32.28 34.38 37.65 40.65 41.57 44.31 46.93 49.44 52.62
26 30.43 31.79 33.43 35.56 38.89 41.92 42.86 45.64 48.29 50.83 54.05
27 31.53 32.91 34.57 36.74 40.11 43.19 44.14 46.96 49.64 52.22 55.48
28 32.62 34.03 35.71 37.92 41.34 44.46 45.42 48.28 50.99 53.59 56.89
29 33.71 35.14 36.85 39.09 42.56 45.72 46.69 49.59 52.34 54.97 58.30
30 34.80 36.25 37.99 40.26 43.77 46.98 47.96 50.89 53.67 56.33 59.70
40 45.62 47.27 49.24 51.81 55.76 59.34 60.44 63.69 66.77 69.70 73.40
50 56.33 58.16 60.35 63.17 67.50 71.42 72.61 76.15 79.49 82.66 86.66
60 66.98 68.97 71.34 74.40 79.08 83.30 84.58 88.38 91.95 95.34 99.61
80 88.13 90.41 93.11 96.58 101.9 106.6 108.1 112.3 116.3 120.1 124.8
100 109.1 111.7 114.7 118.5 124.3 129.6 131.1 135.8 140.2 144.3 149.4
x
α
This table gives you the value of x where P(X ≥ x) = α. X
has a χ
2
distribution with ν degrees of freedom. Look up
the values of ν and α, and read off x.
Look up the value of ν in the
first column...
...look up the value of α in
the first row...
...then read off
the value of x
from the table.

this is the index 663
Index
Symbols
| symbol (see conditional probabilities)
intersection
finding 159
P(A B) versus P(A | B) 165
P(Black Even) 167
P(Even) 167
1/p, expectation 281
when large 407
when small 407
distribution (see Poisson distribution)
μ (mu) 50, 445
confidence intervals 498
ν (nu) 573
degrees of freedom 574
(sigma) 49
mean 49
(sigma) 107
χ2 (chi square) 576
χ2 (chi square) distribution 567–604
cheat sheet 584
contingency table 587
defined 572
degrees of freedom 574, 576, 595
calculating 591
generalizing 596–597
expected frequencies 587–588
goodness of fit 573, 579, 584
independence 573, 586
main uses 573
significance 575
ν (nu) 573
χ2 (chi square) hypothesis testing steps 576
χ2 (chi square) probability tables 575
χ2 (chi square) test 571
x (x bar) 445–447, 472–476
distribution of 476–486
A
accurate linear correlation 630
alternate hypothesis 529–530, 543
average 46–82
mean (see mean)
median (see median)
mode (see mode)
types of 71
average distance 105
interquartile range 105
B
bar charts 10–20, 23
frequency scales 13
percentage scales 12
scales 23
segmented bar chart 14
split-category bar chart 14
Bayes’ Theorem 173, 178–179
bias 423–426, 434, 438
in sampling 424–426, 438
sources 425
bimodal 73
binomial distribution 289, 324, 384, 392–393, 544
approximating 389, 398, 407
approximating with normal distribution 386
approximating with Poisson distribution 316–317
central limit theorem 482

664 Index
the index
binomial distribution (continued)
discrete 395
expectation and variance 298, 301
finding mean and variance 389
guide 302
versus normal distribution 393, 395
Binomial Distribution Up Close 297
binomial probabilities 384
bivariate data 608, 616, 640
visualizing 609
blinding 646
box and whisker diagrams 100–102
box plot 100
Bullet Points
bias 438
binomial distribution 324
bivariate data 640
box and whisker diagram 102
cluster sampling 438
continuity correction 396
continuous data 337
continuous probability distributions 337
correlation coefficient 640
critical region 539
cumulative frequency 42
discrete data 337
expectation and variance of X 485
expectation of random variable X 224
expectations 220, 233
frequency density 30
geometric distribution 324
histograms 30
hypothesis tests 539
Type I error 566
Type II error 566
independent observations 378
independent observations of X 233
independent random variables 233
interpercentile range 102
interquartile range 97
kth percentile 102
linear regression 640
linear transforms 220, 224, 233
line of best fit 640
negative linear correlation 640
normal distribution 359
approximating 396
normal probabilities 359
one-tailed tests 539
p-value 539
percentiles 102
point estimator 447
Poisson distribution 324, 412
population 438
positive linear correlation 640
probability distributions 220, 224
quartiles 97
range 97
sample 438
sampling distribution of means 485
sampling distribution of proportions 466
scatter diagrams 640
significance level 539
simple random sampling 438
standard deviation 122, 220
224
standard error of proportion 466
standard error of the mean 485
standard scores 122
stratified sampling 438
sum of squared errors 640
systematic sampling 438
test statistic 539
two-tailed tests 539
univariate data 640
upper and lower bounds 97
variance of random variable X 224
variances 122, 220, 233
z-scores 122
χ2 distribution 598
goodness of t test 598
test for independence 598

you are here 4 665
the index
C
categorical data 18, 73
mean 62
median 62
categories versus numbers 18–23
causation versus correlation 614
census 418
central limit theorem 481–482, 485
binomial distribution 482
Poisson distribution 482
central tendency 45–82
charts and graphs 4
bar charts 10–20, 23
bar chart scales 23
choosing right one 39–40
comparing 6
cumulative frequency 35, 42
failure 9
frequency 8–9, 23
frequency scales 13
histograms (see histograms)
horizontal bar charts 11, 23
line charts 41, 42
multiple sets of data 14, 23
numerical data 23
percentage sales 12
pie charts 8–9, 9, 23
proportions 9
scales 12
segmented bar chart 14
software 6
split-category bar chart 14
vertical bar charts 10–11, 23
Chebyshev’s inequality 645
chi square (χ2) 576
chi square (χ2) distribution 567–604
cheat sheet 584
contingency table 587
defined 572
degrees of freedom 574, 576, 595
calculating 591
generalizing 596–597
expected frequencies 587–588
goodness of fit 573, 579, 584
independence 573, 586
main uses 573
significance 575
ν (nu) 573
chi square (χ2) hypothesis testing steps 576
chi square (χ2) probability tables 575
chi square (χ2) test 571
clustered sampling 434
cluster sampling 433–434, 436, 438
coefficient of determination 649
combinations (see permutations and combinations)
combined weight
continuous 365
distributed 367
distributed normally 365
complementary event 136
completely randomized design (experiments) 647
conditional probabilities 157–160
Bayes’ Theorem 173
P(A
B) versus P(A | B) 165
P(Black | Even) 170
probability tree 158–161
confidence intervals 487–520, 539
cheat sheet 504
confidence level changes 518
four steps for finding 491–502
Step 1: Choose your population statistic 492, 508
Step 2: Find its sampling distribution 492, 509
Step 3: Decide on the level of condence 494, 512
Step 4: Find the condence limits 496–501, 513
introducing 490
point estimators 493
selecting appropriate confidence level 495
size of sample changes 518
666 Index
the index
confidence intervals (continued)
slope of regression line 651
summary 503
t-distributions 509–515
probability tables 513
shortcuts 515
small sample 510
standard score 511
versus confidence level 507
confidence level versus confidence interval 507
confidence limits 496, 502, 513
confounding 646
contingency table 587
continuity correction 395–398, 412
Continuity Corrections Up Close 397
continuous data 327, 337, 365
frequency 328
probability distribution 329–333
range of values 333
versus discrete data 366
continuous probabilities 333
continuous probability distributions 337
E(X) and Var(X) 654–655
continuous random variables 331
continuous scale versus discrete probability
distribution 395
control group 646
controls 646
correlation and regression 605–642
accurate linear correlation 630
bivariate data 608, 616, 640
visualizing 609
correlation coefficient 630–634, 640
correlation versus causation 614
dependent variable 608
explanatory variable 608
independent variable 608
least squares regression 626
linear regression 626, 640
line of best fit 618, 624, 640
nding equation 622
nding slope 623–624
sum of squared errors 620–621
negative linear correlation 613, 631, 640
no correlation 613, 631
no linear correlation 630
outliers 634
perfect negative linear correlation 631
perfect positive linear correlation 631
positive linear correlation 613, 631, 640
regression line 626
response variable 608
scatter diagrams 609, 612, 616, 618, 640
scatter plots 609
sum of squared errors 640
univariate data 608, 640
correlation coefficient 631–634, 640
formula 632
least square regression 648
critical region 531–534, 539, 548
Critical Regions Up Close 534
critical value 532
cumulative frequency 34–38, 42
graph 35
D
data
categorical and numerical data 18
categorical data 18
grouped 19
multiple sets of data 14
numerical data 18
qualitative data 18
deciles 98
degrees of freedom 574, 576, 595
calculating 591
generalizing 596–597
number of 510
dependent events 181, 189–190
you are here 4 667
the index
dependent variables (experiments) 608, 646
discrete data 329, 337, 370
versus continuous data 326–327, 366
discrete probability distributions 197–240
expectation 204–208
linear transforms 233
expectations 219
independent observations 224, 225–226
linear relationship between E(X) and E(Y) 217–218
linear transforms 219, 225–226
expectation and variance 233
linear transforms versus playing multiple games 221
observation 222–224
observation shortcuts 223
Pool Puzzle 215–216
random variables
adding 230
independent 233
subtracting 231
shortcut or formula 236
variance 205–208, 219
linear transforms 233
versus continuous scale 395
discrete random variables 202
distribution
anatomy 645
mean 56
of X + Y 370
dotplots 644
double blinding 646
drawing lots 431, 434
E
E(X) and Var(X) for continuous probability distributions
654–655
empirical rule for normal distribution 645
estimating populations and samples 441–486
central limit theorem 481–482, 485
binomial distribution 482
Poisson distribution 482
distribution of P
s
464–466
expectation of P
s
462
formulas 451
point estimators 443–447, 452
for population variance 457
sampling distributions 485
population mean 443, 446
population parameters 444
population proportion 454–457
population variance 448–450
probabilities for a sample 459
proportions, sampling distribution of 460
sample mean 445, 446
sample variance 449, 452
sampling distribution 466
continuity correction 469
of proportions 460
sampling distribution of means 471–479
distribution of x 480
expectation for X 474–475
variance of X 476
standard error 485
of mean 479
of proportion 466
variance of Ps 463
x bar 445
μ 445
events 132
complementary 136
dependent 181
exclusive 147–154
versus exhaustive 150
independent 182–184
versus dependent 189–190
intersecting 147–154
mutually exclusive 147, 150
exclusive events 147–154, 150
exhaustive 149
exhaustive events 150
expectations 204–208, 219, 220, 367
1/p 281
binomial distribution 298
668 Index
the index
expectations (continued)
geometric distribution 280–281
independent observations 378
linear transforms 233
Poisson distribution 308
two games 222–224
experimental units 646
experiments 646
designing 647
explanatory variable 608
F
factorials 246, 248
Fireside Chats, Dependent and Independent discuss their
differences 186–187
Five Minute Mystery
Case of the Broken Cookies 315
Solved 318
Case of the High Sunscreen Sales 611
Solved 615
Case of the Lost Coffee Sales 421
Solved 429
Case of the Missing Parameters 357
Solved 358
Case of the Moving Expectation 211
Solved 220
The Case of the Ambiguous Average 51
Solved 81
The Case of the Two Classes 185
Solved 188
formulas for arrangements 248
frequencies 8, 23, 67–68, 73
comparing 14
continuous data 328
cumulative frequency 34–38, 42
highest frequency group of values 52
histograms 24–30
percentages with no frequencies 12
frequency density 27–32, 68
Frequency Density Up Close 29
frequency scales 13
G
Gaussian distribution 352
geometric distribution 277–287, 297, 301, 324
guide 284
inequalities 279
pattern of expectations 280–281
variance 281–284
Geometric Distribution Up Close 278
goodness of fit 573
test 579
graphs (see charts and graphs)
grouped data 19
H
height probabilities 338–341
histograms 19–28
frequency 24–30, 25
intervals 20
making 20
making area proportional to frequency 26–28
mean 56
unequal intervals 24–30
when not to use 33
horizontal bar charts 11, 23
horse racing 243–246
hypothesis tests 521–566
alternate hypothesis 529–530, 543
critical region 531–534, 539, 548
critical value 532
null hypothesis 528, 543
one-tailed tests 534, 539
p-value 539
power of a hypothesis test 561
process 526–539
overview 527
Step 1: Decide on the hypothesis 528–529, 543
Step 2: Choose the test statistic 531, 544
Step 3: Determine the critical region 532, 548
you are here 4 669
the index
Step 4: Find the p-value 535–536
Step 5: Is the sample result in the critical region?
537
Step 6: Make your decision 537
significance level 533, 538, 539
statistically significant 551
test statistic 531, 539, 544, 547
two-tailed tests 534, 539
Type I error 555–560, 566
Type II error 555–560, 566
I
incorrect sampling unit 425
independence 573
independent events 182–183, 189–190
versus mutually exclusive 183
independent observations 224–226, 377, 472
expectation 378
of X 233
variance 378
versus linear transforms 376–378
independent random variables 230–233, 368
indpendent variables 608, 646
information
versus data 5
visualizing (see visualizing information)
interpercentile range 98, 102
interquartile range 92–93, 97
average distance 105
versus the median 97
intersecting events 147–154
intersection 149–154
K
kth percentile 99, 102
L
Law of Total Probability 172, 178
least squares regression 626, 648
Least Squares Regression Up Close 626
leaves 644
left-skewed data 62, 64
letters, using to represent numbers 48–49
linear correlations 613, 630–631
Linear Correlations Up Close 613
linear regression 626, 640, 650
linear relationship between E(X) and E(Y) 217–218
linear transforms 219, 220, 224–226
distribution 376
expectation and variance 233
versus independent observations 376–378
versus playing multiple games 221
line charts 41, 42
Line Charts Up Close 41
line of best fit 618, 622, 640
finding equation 622
finding slope 623–624
minimizing errors 620–621
non-linear 650
sum of squared errors 620–621
lower bounds 86, 97
basketball scores 88
lower quartile 92
finding 94
M
matched pairs design (experiments) 647
mean 47–60
basketball scores 88
binomial distribution 389
calculating 50
calculating when to use 78

670 Index
the index
mean (continued)
categorical data 62
distributions 56
frequencies 52
frequency density 68
histograms 56
of two middle numbers 61
outliers 57–59
positive and negative distances 105
problems with 65–72
skewed data 62, 64
standard deviations from 121
using letters to represent numbers 48–49
versus median 62
X + Y 368
μ (mu) 50
(sigma) 49
measuring probability 132
median 61–70
calculating when to use 78
categorical data 62
frequency density 68
in three steps 62
middle quartile 92
problems with 65–72
skewed data 64
versus mean 62
versus the interquartile range 97
middle quartile 92
modal class 73
mode 73–80
calculating when to use 78
categorical data 73
three steps for finding 74
mu (see μ (mu))
multiple sets of data 14, 23
mutually exclusive events 147, 150
N
n! 248
negative linear correlation 613, 631, 640
no correlation 613, 631
No Dumb Questions
adding probabilities 143
alternate hypothesis 530
approximating binomial distribution 398
arranging objects in circle 248
average distance
interquartile range 105
Bayes’ Theorem 179
bias 426, 434
binomial distribution 301, 412
bivariate data 616
box and whisker diagram 101
breaking data into more than four pieces 97
central limit theorem 485
charts 5
clustered sampling 434
confidence intervals 491, 518, 539
confidence interval versus confidence level 507
continuity corrections 398, 412
continuous data 370
continuous distributions 352
correlation coefficient 634
cumulative frequency 36
degrees of freedom 576, 595
discrete data 370
discrete random variable 203
distribution of X + Y 370
drawing lots 434
E(X
1
+ X
2
) and E(2X) 224
expectation 208, 219
factorials 248
frequency density 30
Gaussian distribution 352
geometric distribution 277, 284, 301
histograms 23, 30
how data is spread out 97