Griffiths D. Head First Statistics
Подождите немного. Документ загружается.


you are here 4 331
using the normal distribution
Probability = area
For continuous random variables, probabilities are given by area. To find the
probability of getting a particular range of values, we start off by sketching the
probability density function. The probability of getting a particular range of values
is given by the area under the line between those values.
As an example, we want to find the probability that Julie has to wait for between 5
and 20 minutes for her date to turn up. We can find this probability by sketching
the probability density function, and then working out the area under it where x is
between 5 and 20.
The total area under the line must be equal to 1, as the total area represents the
total probability. This is because for any probability distribution, the total probability
must be equal to 1, and, therefore, the area must be too.
Let’s use this to help us find the probability that Julie will need to wait for over 5
minutes for her date to arrive.
The total area under the line must be 1. What’s the value of f(x)?
x
f(x)
0
20
5
P(X > 5) is equal
to the area here.
This area represents the total
probability so it must be equal
to 1.
x
f(x)
0
20
Hint: It’s a
constant value.
332 Chapter 8
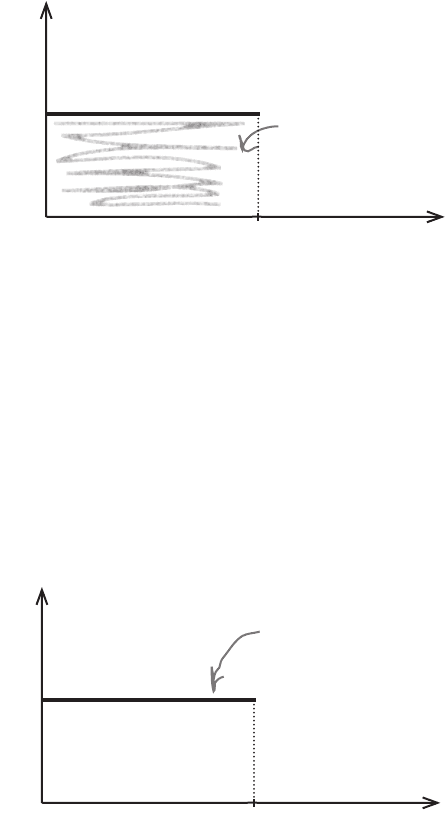
Before we can find probabilities for Julie, we need to find f(x), the probability
density function.
So far, we know that f(x) is a constant value, and we know that the total area under
it must be equal to 1. If you look at the sketch of f(x), the area under it forms
a rectangle where the width of the base is 20. If we can find the height of the
rectangle, we’ll have the value of f(x).
We find the area of a rectangle by multiplying its width and height together.
This means that
1 = 20
×
height
height = 1/20
= 0.05
This means that f(x) must be equal to 0.05, as that ensures the total area under it
will be 1. In other words,
f(x) = 0.05 where x between 0 and 20
Here’s a sketch:
Now that we’ve found the probability density function, we can find P(X > 5).
This area must be equal to 1.
x
f(x)
0
20
f(x) = 0.05 where x
is between 0 and 20.
x
f(x)
0
20
0.05
finding f(x)
To calculate probability, start by finding f(x)…

you are here 4 333
using the normal distribution
Do I have to use area to find
probability? Can’t I just pick all the
exact values in that range and add their
probabilities together? That’s what we
did for discrete probabilities.
…then find probability by finding the area
The area under the probability density line between 5 and 20 is a rectangle.
This means that calculating the area of this rectangle will give us the probability
P(X > 5).
P(X > 5) = (20 - 5)
×
0.05
= 0.75
So the probability that Julie will have to wait for more than 5 minutes is 0.75.
5
20
0.05
That doesn’t work for continuous probabilities.
For continuous probabilities, we have to find the probability by calculating the
area under the probability density line.
We can’t add together the probability of getting each value within the range
as there are an infinite number of values. It would take forever.
The only way we can find the probability for continuous probability
distributions is to work out the area underneath the curve formed by the
probability density function.
Area of rectangle = base x height.
When x is 5, f(x) = 0.05.
When dealing with
continuous data, you
calculate probabilities
for a range of values.

334 Chapter 8
Q:
So there’s a function called the
probability density function. What’s
probability density?
A: Probability density tells you how
high probabilities are across ranges, and
it’s described by the probability density
function. It’s very similar to frequency density,
which we encountered back in Chapter 1.
Probability density uses area to tell you
about probabilities, and frequency density
uses area to tell you about frequencies.
Q:
So aren’t probability density and
probability the same thing?
A: Probability density gives you a
means of finding probability, but it’s not the
probability itself. The probability density
function is the line on the graph, and the
probability is given by the area underneath it
for a specific range of values.
Q:
I see, so if you have a chart
showing a probability density function,
you find the probability by looking at area,
instead of reading it directly off the chart.
A: Exactly. For continuous data, you
need to find probability by calculating area.
Reading probabilities directly off a chart only
works for discrete probabilities.
Q:
Doesn’t finding the probability
get complicated if you have to calculate
areas? I mean, what if the probability
density function is a curve and not a
straight line?
A: It’s still possible to do it, but you
need to use calculus, which is why we’re
not expecting you to do that in this book.
The key thing is that you see where the
probabilities come from and how to interpret
them.
If you’re really interested in working out
probabilities using calculus, by all means,
give it a go. We don’t want to hold you back.
Q:
You’ve talked a lot about
probability ranges. How do I find the
probability of a precise value?
A: When you’re dealing with continuous
data, you’re really talking about acceptable
degrees of accuracy, and you form a range
based on these values. Let’s look at an
example:
Suppose you wanted a piece of string that’s
10 inches long to the nearest inch. It would
be tempting to say that you need a piece of
string that’s exactly 10 inches long, but that’s
not entirely accurate. What you’re really after
is a piece of string that’s between 9.5 inches
and 10.5 inches, as you want string that 10
inches in length to the nearest inch. In other
words, you want to find the probability of the
length being in the range 9.5 inches to 10.5
inches.
Q:
But what if I want to find the
probability of a precise single value?
A: This may not sound intuitive at first,
but it’s actually 0. What you’re really talking
about is the probability that you have a
precise value to an infinite number of
decimal places.
If we go back to the string length example,
what would happen if you needed a piece
of string exactly 10 inches long? You would
need to have a length of string measuring
10 inches long to the nearest atom and
examined under a powerful microscope.
The probability of the string being precisely
10 inches long is virtually impossible.
Q:
But I’m sure that degree of
accuracy isn’t needed. Surely it would
be enough to measure it to the nearest
hundredth of an inch?
A: Ah, but that brings us back to the
degree of accuracy you need in order for
the length to pass as 10 inches, rather
than finding the probability of a value to an
infinite degree of precision. You use your
degree of accuracy to construct your range
of acceptable measurements so that you can
work out the probability.
no dumb questions

you are here 4 335
using the normal distribution
BE the probability density function
A bunch of probability density functions
have lost track of their probabilities.
Your job is to play like you’re the
probability density function and
work out the probability between
the specified ranges. Draw a sketch
if you think that will help.
2. f(x) = 1 where 0 < x < 1
Find P(X < 0.5)
4. f(x) = 0.1 – 0.005x where 0 < x < 20
Find P(X > 5)
3. f(x) = 1 where 0 < x < 1
Find P(X > 2)
1. f(x) = 0.05 where 0 < x < 20
Find P(X < 5)
336 Chapter 8
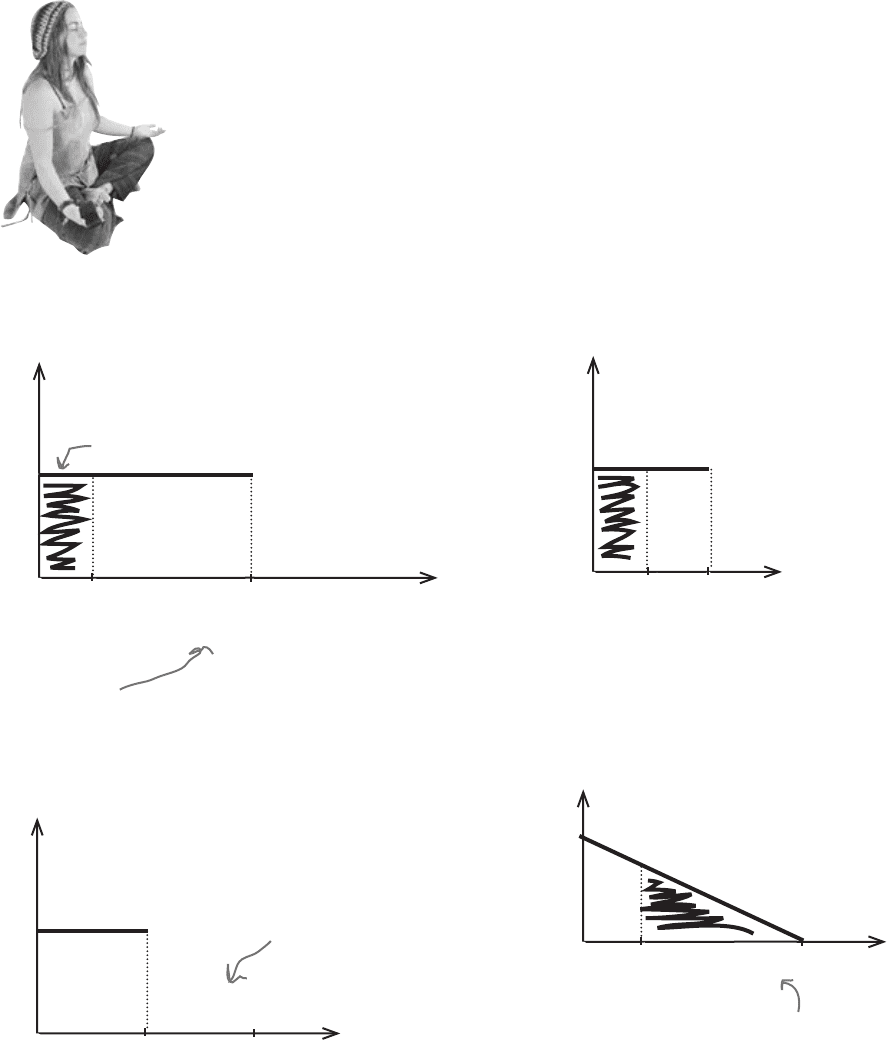
BE the probability density function solution
A bunch of probability density functions
have lost track of their probabilities.
Your job is to play like you’re the
probability density function and
work out the probability between
the specified ranges. Draw a sketch
if you think that will help.
2. f(x) = 1 where 0 < x < 1
Find P(X < 0.5)
4. f(x) = 0.1 – 0.005x where 0 < x < 20
Find P(X > 5)
When x = 5, f(x) = 0.075. This means we have to find
the area of a right-angled triangle with height 0.075
and width 15.
3. f(x) = 1 where 0 < x < 1
Find P(X > 2)
The upper limit of x for this probability
density function is 1, which means that
it’s 0 above this.
P(X > 2) = 0
1. f(x) = 0.05 where 0 < x < 20
Find P(X < 5)
P(X < 5) = 5 x 0.05
= 0.25
P(X < 5) is equal
to the area here
f(x)
0
20
5
x
0.05
P(X < 0.5) = 1 x 0.5
= 0.5
x
f(x)
0
0.5
1
1
The probability density
is 0 where X > 1.
x
2
f(x)
0
1
1
P(X > 5) = (0.075 x 15)/2
= 1.125/2
= 0.5625
x
20
5
f(x)
0
0.1
0.075
The area of a triangle is
1/2 the base multiplied
by the height.
be the probability density function solution

you are here 4 337
using the normal distribution
Discrete data is composed of
distinct numeric values.
Continuous data covers a range,
where any value within that range is
possible. It’s frequently data that is
measured in some way, rather than
counted.
Continuous probability distributions
can be described with a probability
density function.
You find the probability for a range
of values by calculating the area
under the probability density function
between those values. So to find
P(a < X < b), you need to calculate
the area under the probability density
function between a and b.
The total area under the probability
density function must equal 1.
We’ve found the probability
So far, we’ve looked at how you can use probability density functions
to find probabilities for continuous data. We’ve found that the
probability that Julie will have to wait for more than 5 minutes for her
date to turn up is 0.75.
That’s great, at least
now I have an idea of
how long I’ll be waiting.
But what about my shoes?

338 Chapter 8
Searching for a soul mate
As well as preferring men who are punctual, Julie has preconceived ideas
about what the love of her like should be like.
I need a man who’ll be taller
than me when I wear my
highest heels. Shoes definitely
come first.
Julie loves wearing high-heeled shoes, and the higher the heel, the
happier she is. The only problem is that she insists that her dates
should be taller than her when she’s wearing her most extreme set of
heels, and she’s running out of suitable men.
Unfortunately, the last couple of times Julie was sent on a blind date,
the guys fell short of her expectations. She’s wondering how many
men out there are taller than her and what the probability is that her
dates will be tall enough for her high standards.
So how can we work out the probability this time?
sole
height probabilities
you are here 4 339
using the normal distribution
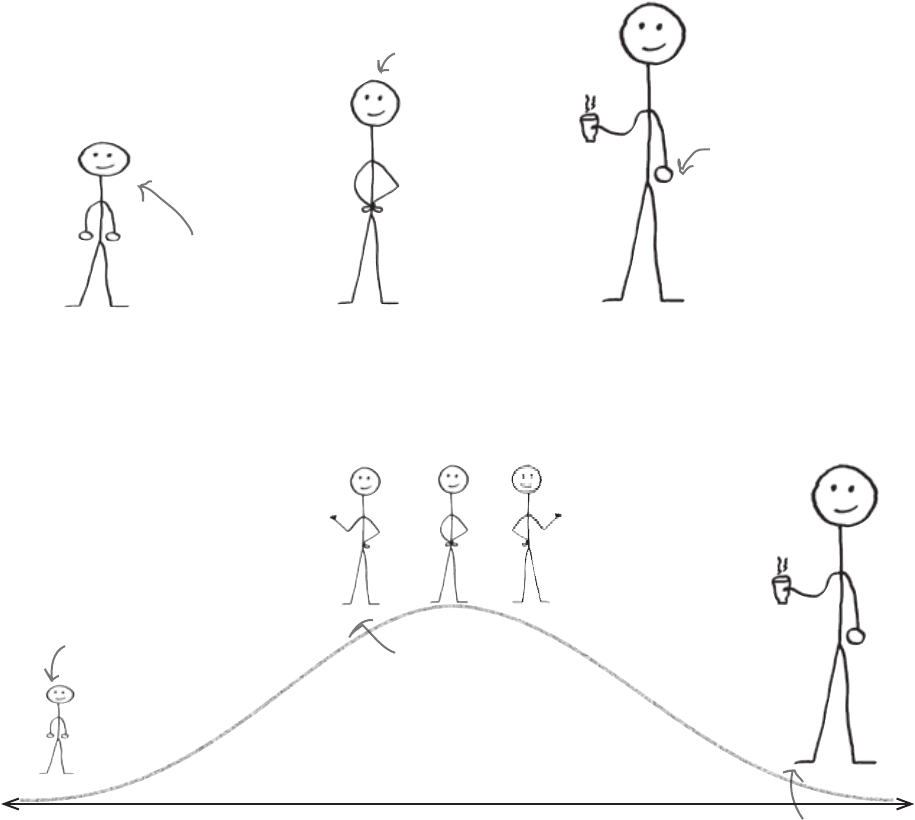
Male modelling
So far we’ve looked at very simple continuous distributions, but it’s
unlikely these will model the heights of the men Julie might be dating.
It’s likely we’ll have several men who are quite a bit shorter than average,
a few really tall ones, and a lot of men somewhere in between. We can
expect most of the men to be average height.
Most men will be
around average height.
There’ll be a few men
who are much shorter
than the average.
We can expect some
men to be extra tall.
Given this pattern, the probability density of the height of the men is likely
to look something like this.
There are fewer shorter
guys, so the probability
density is low.
Most men will be
average height.
There’ll be a smaller
number of tall guys.
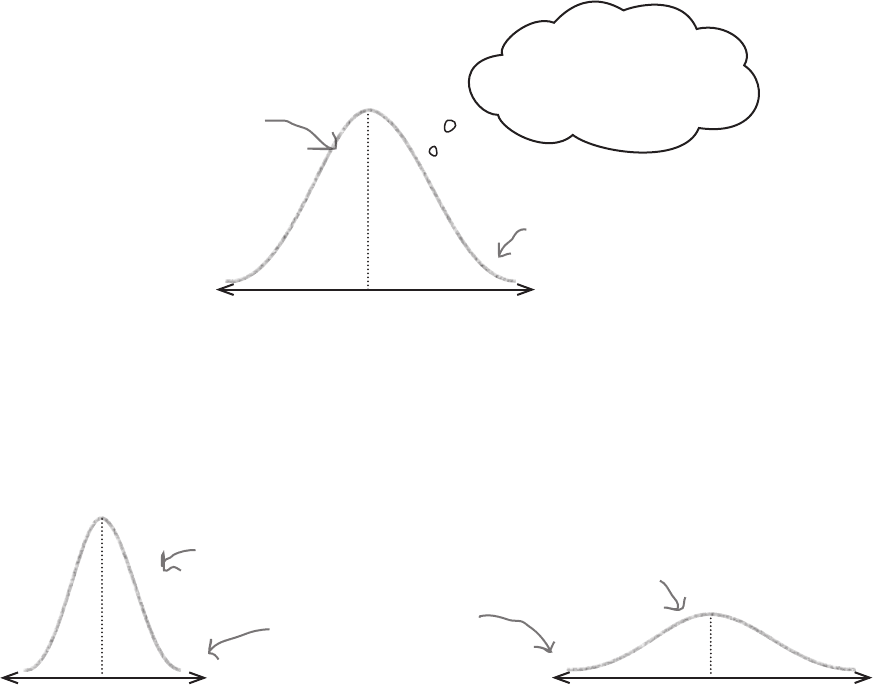
This shape of distribution is actually fairly common and can be
applied to lots of situations. It’s called the normal distribution.
340 Chapter 8
The normal distribution is called normal because it’s seen as an ideal. It’s
what you’d “normally” expect to see in real life for a lot of continuous data
such as measurements.
The normal distribution is in the shape of a bell curve. The curve is
symmetrical, with the highest probability density in the center of the curve.
The probability density decreases the further away you get from the mean.
Both the mean and median are at the center and have the highest probability
density.
The normal distribution is defined by two parameters, μ and σ
2
. μ tells you
where the center of the curve is, and σ gives you the spread. If a continuous
random variable X follows a normal distribution with mean μ and standard
deviation σ, this is generally written X ~ N(μ, σ
2
).
It’s great being
normal. In an ideal world,
everyone would be like me.
μ
σ
2
The greatest probability
density is around the
mean, so values around
here are most likely.
X ~ N(μ, σ
2
)
The further you get
from the mean, the lower
the probability density.
So what effect do μ and σ really have on the shape of the normal distribution?
We said that μ tells you where the center of the curve is, and σ
2
indicates the
spread of values. In practice, this means that as σ
2
gets larger, the flatter and
wider the normal curve becomes.
σ
2
is large.
σ
2
is small.
The larger σ
2
becomes,
the wider and flatter the
curve becomes.
μ
σ
2
μ
σ
2
The normal distribution is an “ideal” model for continuous data
introducing the normal distribution