Griffiths D. Head First Statistics
Подождите немного. Документ загружается.


you are here 4 341
using the normal distribution
As with any other continuous probability distribution, you find
probabilities by calculating the area under the curve of the
distribution. The curve gives the probability density, and the
probability is given by the area between particular ranges. If, for
instance, you wanted to find the probability that a variable X lies
between a and b, you’d need to find the area under the curve between
points a and b.
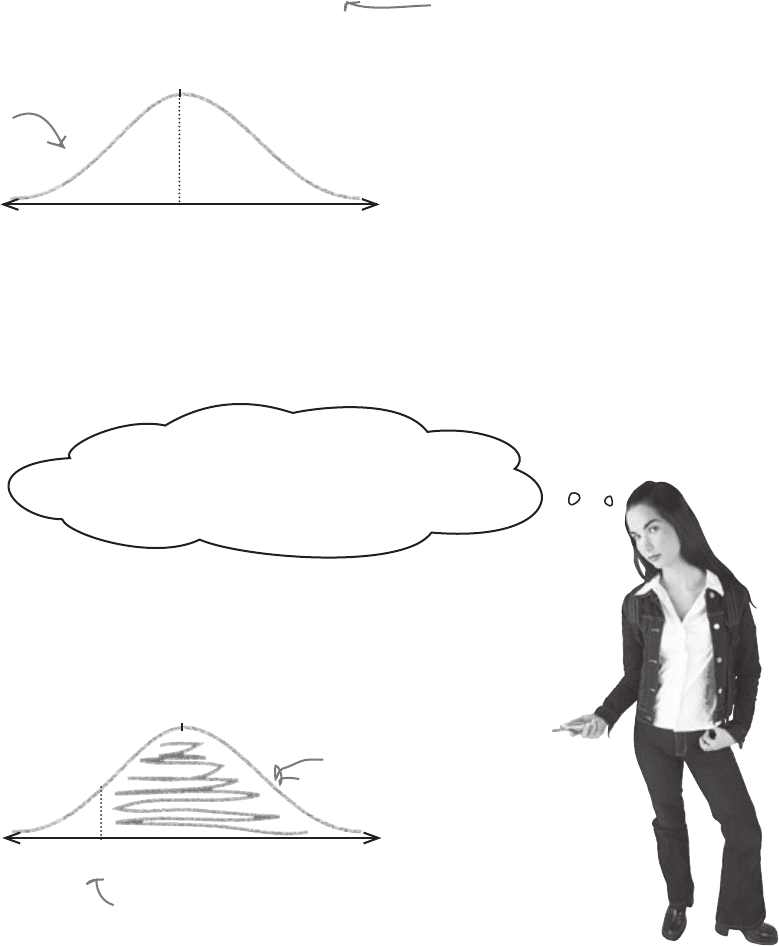
If the probability density
decreases the further you get
from μ, when does it reach 0?
No matter how far you go out on the graph, the
probability density never equals 0.
The probability density gets closer and closer to 0, but never quite
reaches it. If you looked at the probability density curve a very long
way from μ, you’d find that the curve just skims above 0.
Another way of looking at this is that events become more and more
unlikely to occur, but there’s always a tiny chance they might.
Sound complicated? Don’t worry, it’s easier than you might think.
Working out the area under the normal curve would be difficult if you had to
do it all by yourself, but fortunately you have a helping hand in the form of
probability tables. All you need to do is work out the range of the area you
want to find, and then look up the corresponding probability in the table.
So how do we find normal probabilities?
a b
The shaded area gives the
probability between that X is
between a and b.
342 Chapter 8
Grab your distribution and range
Standardize it
Look up the probabilities
There are a few steps you need to take in order to find normal
probabilities. We’ll guide you through the process, but for now here’s
a roadmap of where we’re headed.
If the normal distribution applies to
your situation, see if you can find what
the mean and standard deviation are.
You’ll need these before you can find
your probabilities. You also need to
figure out what area you need to find.
Don’t worry about this for now;
we’ll show you how to do this
really soon.
Once you’ve transformed your
normal curve, you can look
up probabilities using handy
probability tables. Job done!
Three steps to calculating normal probabilities
finding normal probabilities
1
2
3
you are here 4 343
using the normal distribution
Step 1: Determine your distribution
The first thing we need to do is determine the distribution of the data.
Julie has been given the mean and standard deviation of the heights of eligible
men in Statsville. The mean is 71 inches, and the variance is 20.25 inches. This
means that if X represents the heights of the men, X ~ N(71, 20.25).
We also need to know which range of values will give us the right probability
area. In this case, we need to find the probability that Julie’s blind date will be
sufficiently tall.
That’s easy. Julie wants her date to be taller
than her, so we can work out probabilities based
on her height.
Julie is 64 inches tall, so we’ll find the probability that her date is taller.
Here’s a sketch:
The probability of Julie’s
date being over 64 inches
tall is given by this area
here: P(X > 64).
σ
2
= 20.25
X ~ N(71, 20.25)
μ = 71
μ = 71
64
This is shorthand for “The variable
X follows a normal distribution, and
has a mean of 71 and a variance of
20.25.”
This is the graph of
X ~ N(71, 20.25).
Here’s where X = 64 inches.

344 Chapter 8
Step 2: Standardize to N(0, 1)
The next step is to standardize our variable X so that the mean becomes 0
and the standard deviation 1. This gives us a standardized normal variable
Z where Z ~ N(0, 1).
Is that your idea of fun?
Why would I want to do that?
Probability tables only give probabilities for N(0, 1).
Probability tables focus on giving the probabilities for N(0, 1) distributions, as
it would be impossible to produce probability tables for every single normal
distribution curve. There are an infinite number of possible values for μ and
σ
2
, and as the normal curve uses these as parameters to indicate the center
and spread of the curve, there are also an infinite number of possible normal
distribution curves.
There’s an infinite number of possible
values for μ and σ
2
, so there are an
infinite number of possible curves for
the normal distribution
Being able to use a standard normal distribution means that we can use the
same set of probability tables for all possible values of μ and σ
2
. There’s just
one question—how do we convert out normal distribution into a standard
form?
How do you think we might be able to standardize our normal distribution?
0.2
0.4
0.6
0.8
1.0
-3 -2 -1
0
1 2
3
µ = 0; σ
2
= 0.2
µ = 0, σ
2
= 5.0
µ = -2, σ
2
= 0.5
standardizing normal variables
you are here 4 345
using the normal distribution
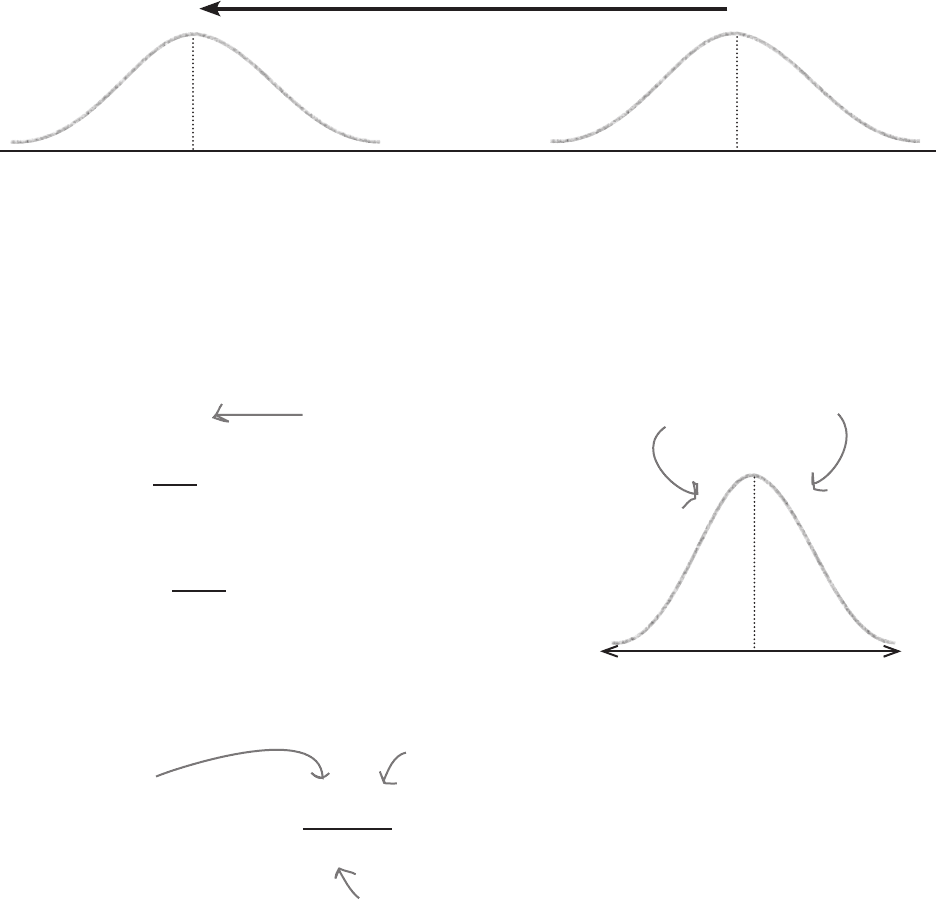
To standardize, first move the mean…
Let’s start off by transforming our normal distribution so that the mean
becomes 0 rather than 71. To do this, we move the curve to the left by 71.
Move to the left by 71
This gives us a new distribution of
X - 71 ~ N(0, 20.25)
…then squash the width
We also need to adjust the variance. To do this, we “squash” our distribution
by dividing by the standard deviation. We know the variance is 20.25, so the
standard deviation is 4.5.
Recall that the standard
deviation is the square root of
the variance.
“Squash” the distribution
by dividing by the
standard deviation.
Doing this gives us X - 71 ~ N(0, 1)
4.5
or Z ~ N(0, 1) where
Z = X - 71
4.5
Z = X - μ
σ
Look familiar? This is the standard score we encountered when
we first looked at the standard deviation in Chapter 3. In general,
you can find the standard score for any normal variable X using
μ = 0
μ = 71
μ = 0
σ = 1
The mean of X
X is the variable
we’re trying to find
probabilities for.
The standard deviation
of X
346 Chapter 8
Standard Score
To find the standard score
of a value, use
Z = X - μ
σ
Vital StatisticsVital Statistics
So far we’ve looked at how our probability distribution can be standardized to
get from X ~ N(μ, σ
2
) to Z ~ N(0, 1). What we’re most interested in is actual
probabilities. What we need to do is take the range of values we want to find
probabilities for, and find the standard score of the limit of this range. Then
we can look up the probability for our standard score using normal probability
tables.
In our situation, we want to find the probability that Julie’s date is taller than
her. Since Julie is 64 inches tall, we need to find P(X > 64). The limit of this
range is 64, so if we calculate the standard score z of 64, we’ll be able to use
this to find our probability.
z = x - μ
σ
= 64 - 71
4.5
= -1.56 (to 2 decimal places)
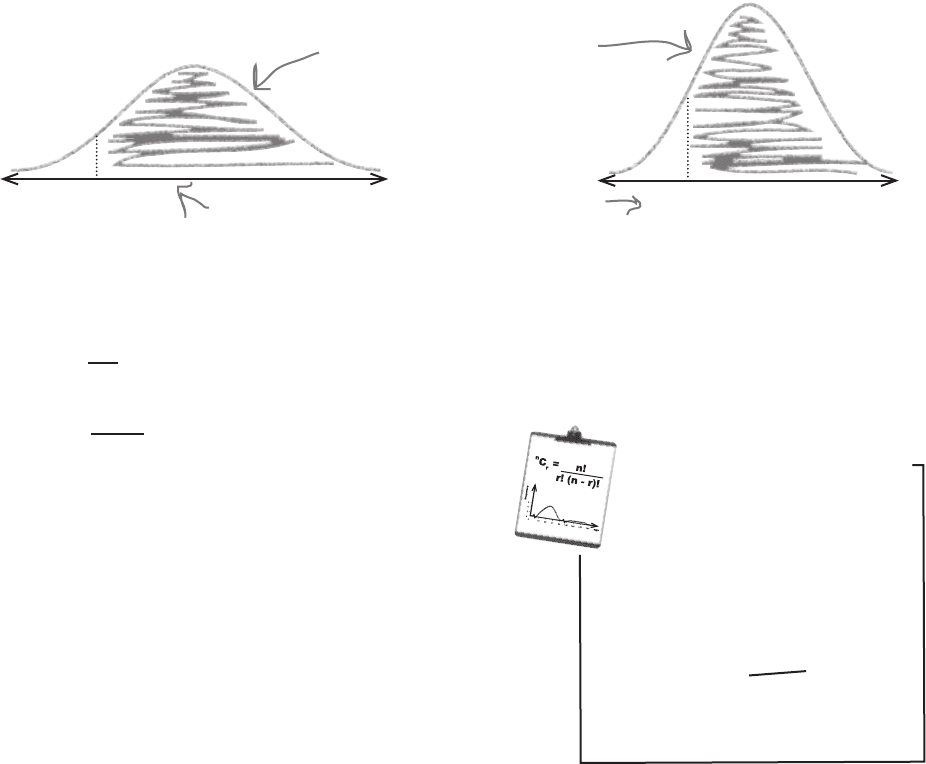
Let’s find the standard score of 64.
64
These areas are the same, but we
don’t know the value of z yet.
We can find it by calculating the
standard score of 64.
We need to convert this... ...to this
N(71, 20.25)
N(0, 1)
So -1.56 is the standard score of 64, using the mean and standard
deviation of the men’s heights in Statsville.
Now that we have this, we can move onto the final step, using
tables to look up the probability.
z
μ = 0
Now find Z for the specific value you want to find probability for
finding Z

you are here 4 347
using the normal distribution
It’s time to standardize. We’ll give you a distribution and value,
and you have to tell us what the standard score is.
Q:
Is this the same standard score that we saw before?
A: Yes it is. It has more uses than just the normal distribution, but
it’s particularly useful here as it allows us to use standard normal
probability tables.
Q:
Is the probability for my standardized range really the
same as for my original distribution? How does that work?
A: The probabilities work out the same, but using the probability
tables is a lot more convenient.
When we standardize our original normal distribution, everything
keeps the same proportion. The overall area doesn’t grow or shrink,
and as it’s area that gives the probability, the probability stays the
same too.
1. N(10, 4), value 6 2. N(6.3, 9), value 0.3
3. N(2, 4). If the standard score is 0.5, what’s the value?
4. The standard score of value 20 is 2. If the variance
is 16, what’s the mean?

348 Chapter 8
σ
It’s time to standardize. We’ll give you a distribution and value,
and you have to tell us what the standard score is.
1. N(10, 4), value 6 2. N(6.3, 9), value 0.3
3. N(2, 4). If the standard score is 0.5, what’s the value?
4. The standard score of value 20 is 2. If the
variance is 16, what’s the mean?
z = x - μ
= 6 - 10
2
= -2
z = x - μ
= 0.3 - 6.3
3
= -2
z = x - μ
0.5 = x - 2
2
0.5 x 2 = x - 2
x = 1 + 2
= 3
This is the reverse of previous problems. We’re
given the standard score, and we have to find the
original value. We can do this by substituting in the
values we know, and finding x.
z = x - μ
2 = 20 - μ
4
2 x 4 = 20 - μ
μ = 20 - 8
= 12
This is a similar problem to question 3. We have to
substitute in the values we know to find μ.
sharpen solution
So we’ve found our
distribution, standardized it,
and found Z. Now can we find
the probability of my blind date
being taller than me?
σ
σ
σ
you are here 4 349
using the normal distribution
Now that we have a standard score, we can use probability tables to find
our probability. Standard normal probability tables allow you to look up
any value z, and then read off the corresponding probability P(Z < z).
z
P(Z < z) is this area here.
z .00 .01 .02 .03 .04 .05 .06 .07 .08 .09
–3.4 .0003 .0003 .0003 .0003 .0003 .0003 .0003 .0003 .0003 .0002
–3.3 .0005 .0005 .0005 .0004 .0004 .0004 .0004 .0004 .0004 .0003
–3.2 .0007 .0007 .0006 .0006 .0006 .0006 .0006 .0005 .0005 .0005
–3.1 .0010 .0009 .0009 .0009 .0008 .0008 .0008 .0008 .0007 .0007
–3.0 .0013 .0013 .0013 .0012 .0012 .0011 .0011 .0011 .0010 .0010
–2.9 .0019 .0018 .0018 .0017 .0016 .0016 .0015 .0015 .0014 .0014
–2.8 .0026 .0025 .0024 .0023 .0023 .0022 .0021 .0021 .0020 .0019
–2.7 .0035 .0034 .0033 .0032 .0031 .0030 .0029 .0028 .0027 .0026
–2.6 .0047 .0045 .0044 .0043 .0041 .0040 .0039 .0038 .0037 .0036
–2.5 .0062 .0060 .0059 .0057 .0055 .0054 .0052 .0051 .0049 .0048
–2.4 .0082 .0080 .0078 .0075 .0073 .0071 .0069 .0068 .0066 .0064
Z ~ N(0, 1)
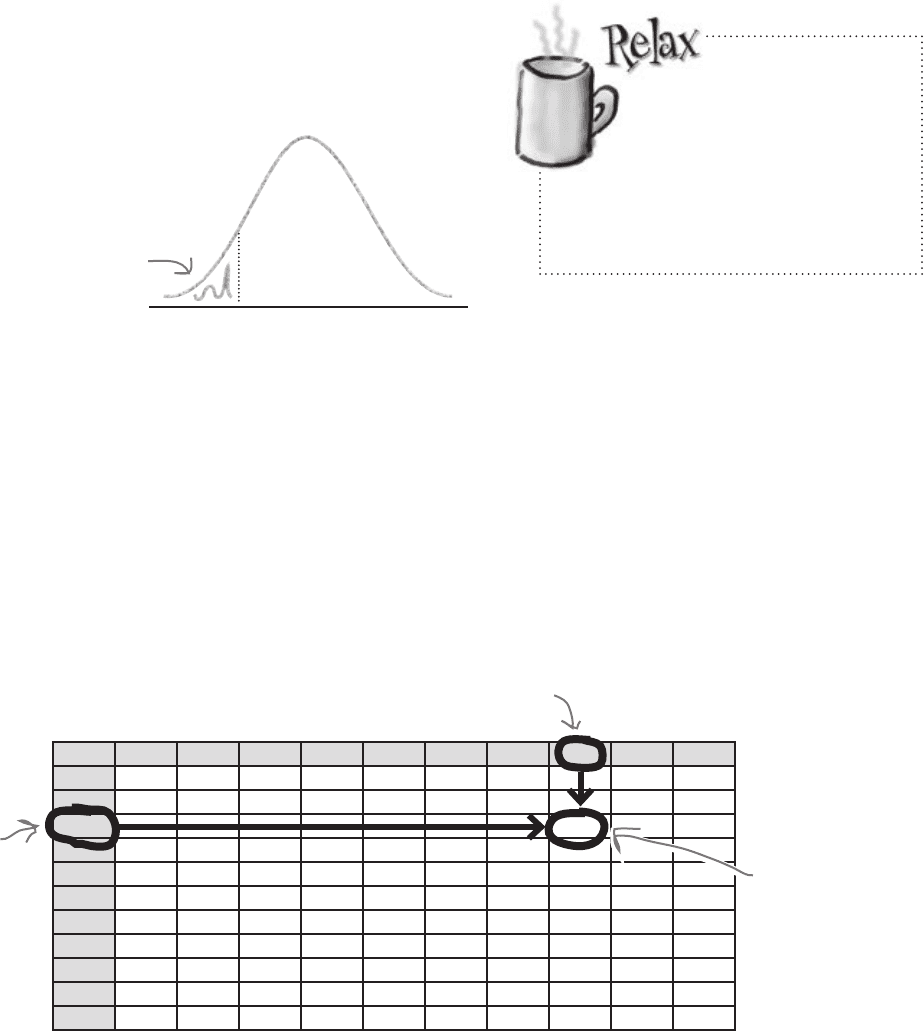
So how do you use probability tables?
Start off by calculating z to 2 decimal places. This is the value that you
will need to look up in the table.
To look up the probability, you need to use the first column and the top
row to find your value of z. The first column gives the value of z to
1 decimal place (without rounding), and the top row gives the second
decimal place. The probability is where the two intersect.
As an example, if you wanted to find P(Z < –3.27), you’d find –3.2
in the first column, .07 in the top row, and read off a probability of
0.0005.
Here’s the
row for
z = -3.2x,
where x is
some number.
Here’s the column for
.07, the second decimal
place for z.
This is where
-3.2 and .07
meet. It gives
the value of
P(Z < z).
Step 3: Look up the probability in your handy table
We’ve put all
the probability
tables you need in
Appendix ii of the
book.
Just flip to pages 658-659 for the normal
distribution tables you need to find
probabilities in this chapter.
350 Chapter 8
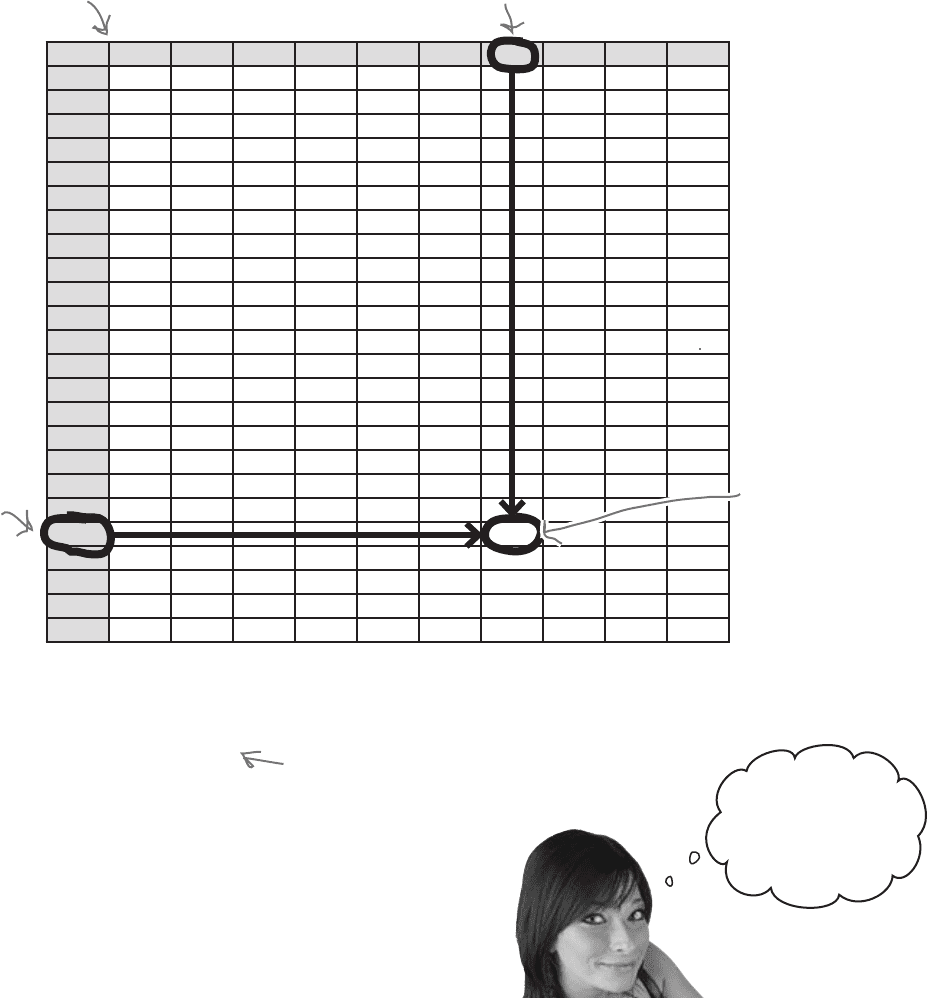
Julie’s probability is in the table
Let’s go back to our problem with Julie. We want to find P(Z > -1.56), so let’s
look up -1.56 in the probability table and see what this gives us.
So, looking up the value of –1.56 in the probability table gives us a probability of
0.0594. In other words, P(Z < –1.56) = 0.0594. This means that
P(Z > –1.56) = 1 - P(Z < –1.56)
= 1 – 0.0594
= 0.9406
In other words, the probability that Julie’s date is taller than her is 0.9406.
You can find normal probability
tables in the appendix at the
back of the book.
z .00 .01 .02 .03 .04 .05 .06 .07 .08 .09
–3.4 .0003 .0003 .0003 .0003 .0003 .0003 .0003 .0003 .0003 .0002
–3.3 .0005 .0005 .0005 .0004 .0004 .0004 .0004 .0004 .0004 .0003
–3.2 .0007 .0007 .0006 .0006 .0006 .0006 .0006 .0005 .0005 .0005
–3.1 .0010 .0009 .0009 .0009 .0008 .0008 .0008 .0008 .0007 .0007
–3.0 .0013 .0013 .0013 .0012 .0012 .0011 .0011 .0011 .0010 .0010
–2.9 .0019 .0018 .0018 .0017 .0016 .0016 .0015 .0015 .0014 .0014
–2.8 .0026 .0025 .0024 .0023 .0023 .0022 .0021 .0021 .0020 .0019
–2.7 .0035 .0034 .0033 .0032 .0031 .0030 .0029 .0028 .0027 .0026
–2.6 .0047 .0045 .0044 .0043 .0041 .0040 .0039 .0038 .0037 .0036
–2.5 .0062 .0060 .0059 .0057 .0055 .0054 .0052 .0051 .0049 .0048
–2.4 .0082 .0080 .0078 .0075 .0073 .0071 .0069 .0068 .0066 .0064
–2.3 .0107 .0104 .0102 .0099 .0096 .0094 .0091 .0089 .0087 .0084
–2.2 .0139 .0136 .0132 .0129 .0125 .0122 .0119 .0116 .0113 .0110
–2.1 .0179 .0174 .0170 .0166 .0162 .0158 .0154 .0150 .0146 .0143
–2.0 .0228 .0222 .0217 .0212 .0207 .0202 .0197 .0192 .0188 .0183
–1.9 .0287 .0281 .0274 .0268 .0262 .0256 .0250 .0244 .0239 .0233
–1.8 .0359 .0351 .0344 .0336 .0329 .0322 .0314 .0307 .0301 .0294
–1.7 .0446 .0436 .0427 .0418 .0409 .0401 .0392 .0384 .0375 .0367
–1.6 .0548 .0537 .0526 .0516 .0505 .0495 .0485 .0475 .0465 .0455
–1.5 .0668 .0655 .0643 .0630 .0618 .0606 .0594 .0582 .0571 .0559
–1.4 .0808 .0793 .0778 .0764 .0749 .0735 .0721 .0708 .0694 .0681
–1.3 .0968 .0951 .0934 .0918 .0901 .0885 .0869 .0853 .0838 .0823
–1.2 .1151 .1131 .1112 .1093 .1075 .1056 .1038 .1020 .1003 .0985
–1.1 .1357 .1335 .1314 .1292 .1271 .1251 .1230 .1210 .1190 .1170
Here’s the
row for
z = -1.5x,
where x is
some number.
Here’s the column for
.06, the second decimal
place for z.
This is where
-1.5 and .06
meet. It gives
the value of
P(Z < z).
The total probability is 1, so the total area under the curve is 1.
using probability tables
There’s a 94%
chance my date
will be taller than
me? I like those
odds!