Jones M., Fleming S.A. Organic Chemistry
Подождите немного. Документ загружается.

8.4 Rates of Chemical Reactions 339
Summary
Now we know something of the factors that affect equilibrium.Enthalpy change,
ΔH, is important. Basically, the side of the equilibrium with the stronger bonds
will be favored by enthalpy. Also important is the temperature-dependent entropy
change, ΔS, term. The two terms may act in concert or oppose each other.
We have said nothing so far of the factors influencing the rate of establishing
equilibrium.
8.4 Rates of Chemical Reactions
Just because a reaction is exothermic does not mean that it will be a rapid reaction
or even that it will proceed at all under normal conditions. First of all, an exother-
mic reaction can be endergonic if entropy plays an especially important role. Entropy
does not raise its ugly head in this way often, but there is another, much more fre-
quently encountered reason why an exergonic reaction might not be a fast reaction.
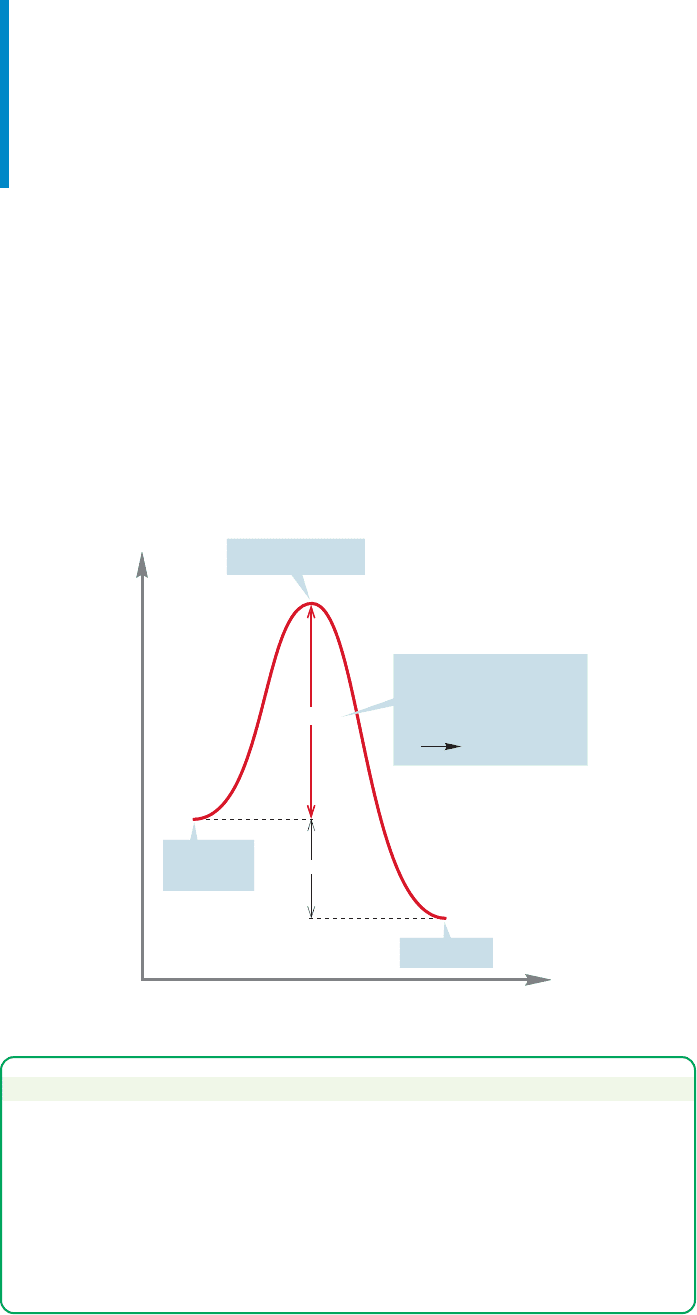
As we have seen, there are energy barriers to chemical reactions. In principle, a very
stable product can be separated from a much less stable starting material by a bar-
rier high enough to stop all reaction (Fig. 8.7).
Energy
Reaction pro
g
ress
ΔG⬚
Starting
material A
Barrier
Product B
Transition state
This barrier must be
surmounted in order to
produce product, even
though the reaction
A B is exergonic
FIGURE 8.7 Rates of reactions are
determined not by the ΔG° between
starting material and product, but by
the height of the energy barrier
separating starting material from
product. Some very unstable
materials are protected by high
barriers and thus can be isolated.
PROBLEM SOLVING
Whenever you see the word “rate” in a problem, or when you see words such as
“faster” that talk about rates, you are very likely to have to answer the question by
drawing the transition state for the reaction. Remember that the rate of a
reaction is determined by ΔG
‡
, the energy difference between starting material
and the transition state, and not by the energy difference between starting
material and product. You need a pull-down menu that says, “Think about the
transition state” when the word “rate”appears in a problem.
340 CHAPTER 8 Equilibria
Sometimes a reaction we expect to be second order appears not to be. The S
N
2
solvolysis reaction of methyl iodide with solvent (therefore in great excess) ammonia
is an example.This reaction is first order in substrate, methyl iodide,because the con-
centration of one of the reactants, ammonia, does not change appreciably during the
reaction. Such reactions are called pseudo-first-order reactions (Fig. 8.10).
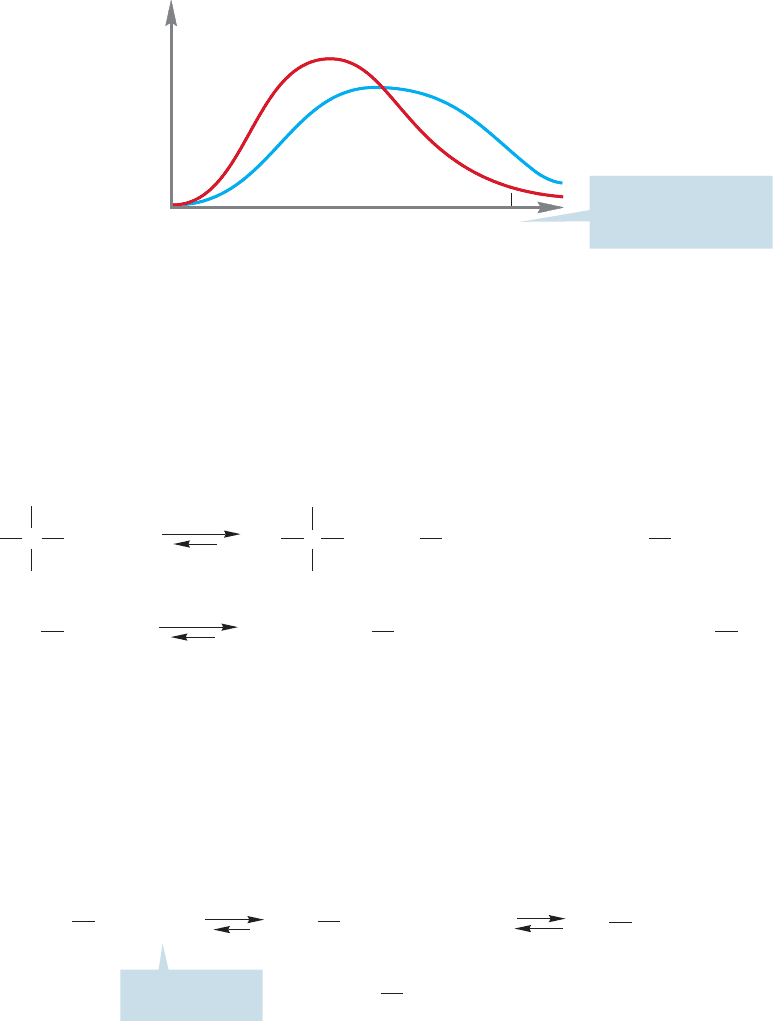
Number of molecules
Kinetic energy
X
X = energy necessary
to surmount the
activation barrier
FIGURE 8.8 Boltzmann distributions
of molecules at two temperatures.
The blue line is the distribution at
higher temperature, and the red line
is the distribution at lower
temperature.
H
3
C
H
CH
3
CH
3
C
OH
..
..
OH OH
..
..
+
+
+
+
H
3
C
Rate = k [(CH
3
)
3
C
Rate = k [CH
3
CH
2
CH
2
CH
2
I
][
–
OH]
CH
3
S
N
1
S
N
2
CH
3
CH
3
CH
2
CH
2
CH
2
C
..
CH
3
CH
2
CH
2
CH
2
..
..
–
I
..
..
..
I
]I
..
..
..
I
..
..
..
–
I
..
..
..
..
..
..
H
2
O
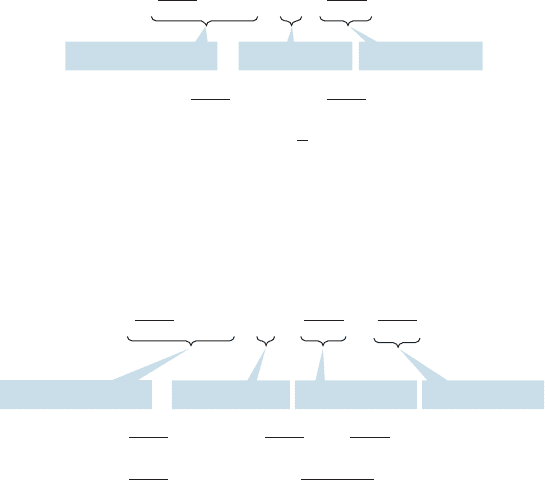
FIGURE 8.9 Rate laws for the S
N
1 and S
N
2 reactions.
+++++
Solvent (present
in great excess)
Rate = k [CH
3
I
]
..
..
CH
3
NH
3
S
N
2
..
NH
3
I CH
3
+
NH
3
+
NH
4
CH
3
NH
2
–
I
..
..
..
..
–
I
..
..
..
..
FIGURE 8.10 A pseudo-first-order
reaction.
As we already saw in our discussion of the S
N
2 and S
N
1 reactions,rates of chem-
ical reactions also depend on the concentrations of reactants. The rates of most
organic reactions depend either only on the concentration of a single reactant (S
N
1,
for example) and thus are first-order reactions or on the concentrations of two species
(S
N
2) and are second-order reactions (Fig. 8.9).There are examples of higher-order
reactions, but they are relatively rare.
At a given temperature, collections of molecules exist in ranges of energies called
Boltzmann distributions. In a Boltzmann distribution, the energies of most
molecules cluster about an average value. As energy is provided to the molecules,
usually through the application of heat, the average energy increases.Although there
is always a small number of highly energetic molecules present (the high-energy tail
of the Boltzmann distribution), in practice there may not be enough molecules of
sufficient energy to make the reaction proceed at an observable rate if the barrier
is high enough. The application of energy in the form of heat produces more
molecules with sufficient energy to traverse the barrier (Fig. 8.8). A reaction rate
approximately doubles for every increase in temperature of 10 °C.
8.5 Rate Constant 341
8.5 Rate Constant
In the rate laws mentioned so far, there has always been a proportionality constant,
the rate constant (k), which is a fundamental property of any given chemical reac-
tion. A rate must have the units of concentration per unit time,often moles per liter
per second. For a first-order process such as the S
N
1 reaction, the rate constant k
must have the units of reciprocal seconds (s
1
) (if we use the second as our time
unit, Fig. 8.11).
Rate = k [A]
concentration/time = (rate constant) (concentration)
(s)
–1
= k
Rate =
in units,
QR
L
mol
QR
L
mol
(s)
–1
–1
= k
rearranging we have:
QR
L
mol
QR
L
mol
(s)
–1
= k
= k
so, or
s
1
FIGURE 8.11 For a first-order
reaction, the rate constant (k) has the
units of time
1
s
1
.
For a second-order reaction, k must have units of reciprocal moles per liter per
second [(mol/L)
1
s
1
] (Fig. 8.12).
Rate = concentration/time = (rate constant) (concentration) (concentration)
(s)
–1
= k
in units,
QR
L
mol
QR
L
mol
QR
L
mol
(s)
–1
–1
–1
= k
= k = kor
rearranging we have:
QR
L
mol
(s)
–1
QR
L
mol
1mol s2
L
QR
L
mol
–1
QR
L
mol
so,
Rate = k[A][B]
FIGURE 8.12 For a second-order
reaction, the rate constant (k) has the
units of (mol/L)
1
s
1
.
We can determine the value of k by measuring how the reaction rate varies with
the concentration(s) of the reactants.
It is easy to confuse the rate of a reaction, which is simply how fast the concen-
trations of the reactants are changing, with the rate constant, which tells us how the
rate will change as a function of reactant concentration. The rate of a reaction will
vary with concentration.This variation is easy to see by imagining the limiting case
in which one reactant is used up. When its concentration goes to zero, the reaction
rate must also be zero. On the other hand, the rate constant is an intrinsic property
of the reaction. It will vary with temperature, pressure, and solvent, but does not
depend on the concentrations of reactants.
Only when the concentrations of all reactants are 1 M are the rate and the rate
constant the same. The rate constant is thus a measure of the rate under standard
conditions (Fig. 8.13).
Rate = k [A][B][C][D] … [X]
if all [ ] = 1 M
Rate = k [1][1][1][1] … [1]
and therefore, rate = k
FIGURE 8.13 If the concentrations
of the reactants are all 1 M, the rate
constant and the rate are the same.
342 CHAPTER 8 Equilibria
CONVENTION ALERT
PROBLEM 8.5 Draw an arrow to show the activation energy for the reverse of the
reaction in Figure 8.14, the formation of methane and oxygen from carbon diox-
ide and water.
8.6 Energy Barriers in Chemical Reactions:
The Transition State and Activation Energy
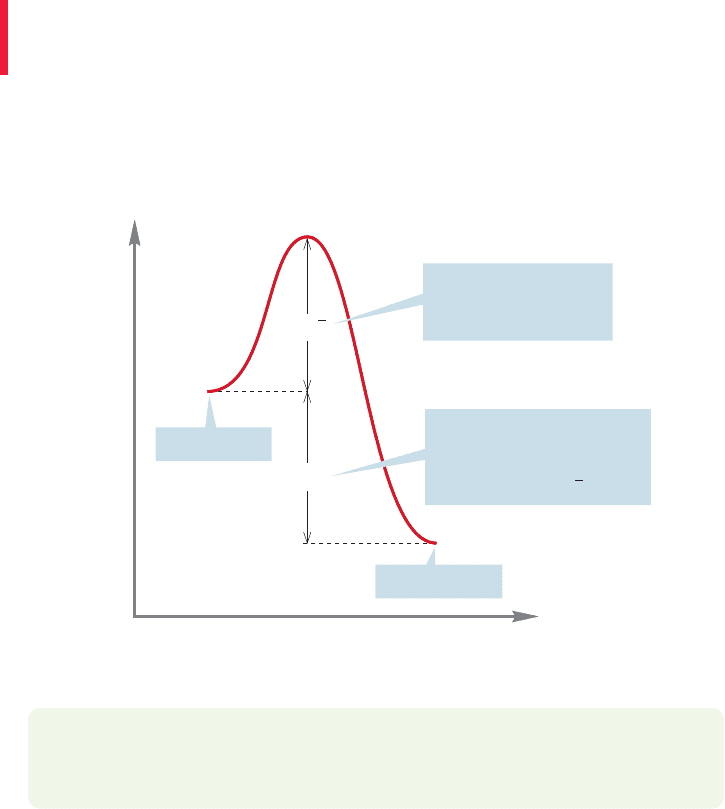
We have already mentioned that even exothermic reactions may be very slow,
indeed immeasurably slow. And it’s a good thing. Combustion is a very exothermic
chemical reaction, and yet we and our surroundings exist more or less tranquilly in
air without bursting into flame. Somehow we are protected by an energy barrier.
For example, methane and oxygen do not react unless energy, called activation
energy, is supplied. If we are considering free energy, the activation energy is
ΔG
‡
; if we are speaking of enthalpy, the activation energy is ΔH
‡
. The double
dagger (
‡
) is always used when we are referring to activation parameters involv-
ing the energy of a transition state. A match will suffice to provide the energy in
our methane plus oxygen example. This highly exothermic process (p. 68) then
provides its own energy as very stable molecules are produced from less stable
ones (Fig. 8.14).
Energy
Reaction progress
ΔG⬚
CO
2
+ 2 H
2
O
CH
4
+ 2 O
2
Very negative for this highly
exergonic reaction; the
energy given off can be
used to supply ΔG
!
This amount of energy
must be supplied to
start the reaction
ΔG
†
†
FIGURE 8.14 An exergonic reaction
can provide the energy necessary to
pass over an activation barrier. Once
such a reaction is started, it continues
until one reactant is used up.
We are protected from spontaneous combustion in the same way we are
protected from hungry bears and tigers during a visit to the zoo. At the zoo the
barrier is tangible and operates in a clear way to ensure our survival. Activation
barriers are less visible but no less necessary for the continuance of our lives.
In this important section, we will discuss these energy barriers to chemical
reactions.
In a process such as the S
N
1 reaction, a bond must be broken. Consider the ion-
ization of tert-butyl iodide.The first step in this reaction is the ionization of the sub-
strate, and surely this step will involve an energy cost in breaking the bond from
8.6 Energy Barriers in Chemical Reactions 343
This energy cost is partially offset by an increase in entropy as we form two particles
out of one. But we have to be careful when we estimate entropy changes because there
are invisible participants in most reactions,including this one.These invisible participants
are the solvent molecules.They will have to be disordered and reordered in any ionic reac-
tion in solution, and the net change in entropy may not be at all easy to estimate.
(CH
3
)
3
C (CH
3
)
3
C
+
S
N
1
+
–
I
..
..
..
..
..
I
..
..
..
WEB 3D WEB 3D
FIGURE 8.15 The enthalpy change
ΔH° (and ΔG°) is positive for this
endothermic reaction.
WORKED PROBLEM 8.6 (a) Construct an Energy versus Reaction progress dia-
gram for the reaction of tert-butyl iodide and water (see Fig. 8.2), showing
clearly the activation energies and transition states for all steps. A discussion of
this reaction is coming, but try to anticipate it here. (b) Show the activation ener-
gies for the reverse reactions involved in the formation of tert-butyl iodide from
tert-butyl alcohol and hydrogen iodide (HI).
ANSWER
PROBLEM 8.7 Show that at equilibrium the equilibrium constant (K ) is given by
the ratio of the rate constants (k) for the forward and reverse reactions. Hint:At
equilibrium the rates of the forward and reverse reactions are equal.
Energy
Reaction progress
Transition state 1 Transition state 2 Transition state 3
++
(CH
3
)
3
C
+
+
+
(CH
3
)
3
C
..
..
++
(CH
3
)
3
COH
+
(CH
3
)
3
C
Activation energies
for the forward
reactions
Activation energies
for the reverse
reactions
–
I
..
..
..
..
–
I
..
..
..
..
–
I
..
..
..
..
I
..
..
..
H
3
O
..
+
..
..
H
2
O
..
..
H
2
O
..
..
H
2
O
OH
2
..
+
The situation is a little different for the S
N
2 reaction. Here we must also break
the bond from carbon to the leaving group, but this energy cost is partially offset
by the formation of the bond from carbon to the entering nucleophile. We might
imagine that there must be a substantial entropy cost in this reaction as we must
carbon to the leaving group.The enthalpy change ΔH° (and ΔG°) is positive for this
reaction (Fig. 8.15).
344 CHAPTER 8 Equilibria
order the reactants in a special way for the reaction to proceed. The S
N
2 reaction
can occur only if the nucleophile attacks from the rear of the departing leaving group,
and this requirement demands a specific arrangement of the molecules and ions
involved in the reaction (Fig. 8.16).
Energy
Reaction progress
ΔG⬚
This amount of activation
energy must be supplied
to start the reaction
Very negative for this
highly exergonic reaction
(read left to right)
ΔG
+
K
+
–
..
NC
..
H
3
C
+
++
K
+
NC
..
CH
3
–
I
..
..
..
..
I
..
..
..
The transition state
for this S
N
2 reaction
–
NC
H
H
H
C
I
†
FIGURE 8.17
An energy diagram for
the S
N
2 displacement of iodide by
cyanide (and its reverse reaction, the
much less favorable displacement of
the strong nucleophile cyanide by
iodide).The activation energy for
the exergonic displacement of iodide
is shown.
S
N
2 with cyanide
WEB 3D WEB 3D
S
N
2
NC
..
..
–
H
H
H
C
NC
..
H
H
H
C
+
–
I
..
..
..
..
I
..
..
..
FIGURE 8.16 The transition state for
the S
N
2 reaction has severe ordering
requirements. Attack of the
nucleophile must be from the rear for
the reaction to succeed.
We can follow the course of both these reactions in diagrams that plot Energy
versus Reaction progress. We usually don’t specify reaction progress in detail because
there are many possible measures of this quantity, and for this kind of qualitative
discussion it doesn’t much matter what we pick. In the S
N
2 reaction, for example,
we might choose to plot energy versus the length of the bond between carbon and
the leaving group (which increases in the reaction), or the length of the bond between
carbon and the nucleophile, which decreases through much of the process.The over-
all picture is the same.
If we have enough energy for molecules to reach the transition state, to cross
the barrier in reasonable numbers, the reaction will run at a reasonable rate,
and the final mixture of starting materials and products will depend on the
ΔG° between starting materials and products. Figure 8.17 shows a diagram for
8.6 Energy Barriers in Chemical Reactions 345
Of course, this separation of the two reactions is absolutely artificial—we are
really describing a single equilibrium between methyl iodide and cyanide ion on one
side and methyl cyanide and iodide ion on the other (Fig. 8.19).
the exothermic formation of methyl cyanide (CH
3
CN) and potassium iodide
(KI) from methyl iodide (CH
3
I) and potassium cyanide (KCN). The activa-
tion energy is the height of the transition state above the starting material.
As there is enough energy to pass over the transition state in both direc-
tions, the ratio of product and starting material will depend on ΔG°, the
difference in free energy between starting material and product. The reaction
shown in Figure 8.17 has a negative ΔG°, and will be successful in producing
product.
In Figure 8.18, this same reaction is considered from the reverse point of
view: the endothermic formation of methyl iodide from methyl cyanide and
iodide ion. The activation energy ΔG
‡
is much higher than that for the
forward reaction, and ΔG° is positive for the endergonic formation of methyl
iodide. The transition state is exactly the same as that for the forward reaction.
This reaction will not be very successful. It not only requires overcoming a
high activation energy but is “fighting” an unfavorable equilibrium because ΔG°
is positive.
Energy
Reaction progress
ΔG⬚
ΔG
+
K
+
–
..
NC
..
H
3
C
+
++
K
+
NC
..
CH
3
–
I
..
..
..
..
I
..
..
..
The transition state
for this S
N
2 reaction
–
NC
H
H
H
C
I
This amount of activation
energy must be supplied
to start the reaction
Very positive for this
highly endergonic reaction
(read right to left)
†
FIGURE 8.18 This energy diagram
for the same reaction shown in
Figure 8.17 emphasizes the reversal.
Here the activation energy for
displacement of cyanide by iodide
is shown.
+
+
K
+
NC
..
CH
3
+
K
+
–
..
NC
..
H
3
C
+
I
..
..
..
–
I
..
..
..
..
FIGURE 8.19 The competition
between cyanide and iodide for a
Lewis acidic carbon.
The exergonic formation of methyl cyanide and the endergonic formation of
methyl iodide are one and the same reaction. The reactions share exactly the same
transition state; only the ease of reaching it is different (ΔG
‡
forward
ΔG
‡
reverse
).The
energy difference between the starting material and the product (ΔG°) is the differ-
ence between the two activation energies.
The rates of the forward and reverse reactions are determined by the magni-
tudes of the activation energies for the two halves of the reaction. They are inti-
mately related to the equilibrium constant for the reaction K, determined by ΔG°
[Eq. (8.7)].
ΔG
‡
reverse
ΔG
‡
forward
ΔG° RT ln K (8.7)
The principle of microscopic reversibility says that if we know the mechanism
of a forward reaction, we know the mechanism of the reverse reaction. One diagram
suffices to tell all about both forward and reverse reactions. Figures 8.17 and 8.18
are in reality a single diagram describing both reactions, in this case one “forward”
and exergonic, the other “reverse” and endergonic. There is no lower-energy route
from methyl cyanide and iodide ion back to methyl iodide and cyanide ion.The low-
est-energy path back is exactly the reverse of the path forward.
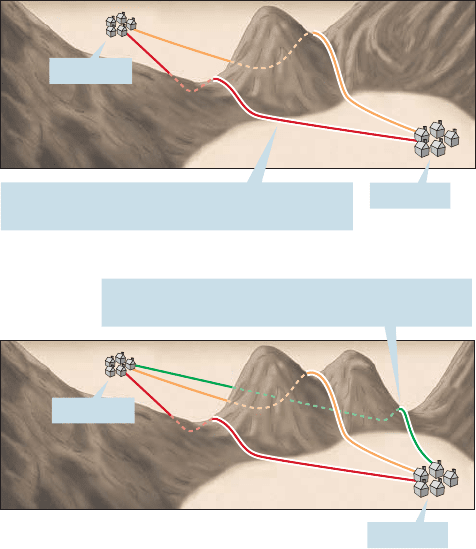
The classic analogy for this idea pictures the molecules as crossing a high moun-
tain pass.The best path (lowest energy, or lowest altitude) from village A to village B
is the best path (lowest energy, lowest altitude) back from village B to village A. If
there were a lower-energy route back from B to A, it would have been the better route
from A to B as well (Fig. 8.20).
346 CHAPTER 8 Equilibria
Village A
Village B
Had there been a lower-energy path (green)
it would still be the best path in both directions
Best = lowest-energy path from A to B. This
is also the best path back from B to A
Village A
Village B
FIGURE 8.20 Molecules, unlike
explorers, take the best (lowest-
energy) path. You might take the red
path from A to B and the orange
path back, but a molecule wouldn’t.
The Energy versus Reaction progress diagram for the S
N
1 reaction is more
complicated than that for the S
N
2 reaction, because there are more steps than in
the S
N
2 reaction. We dealt with the description of the S
N
1 reaction as a sequence
of equilibria earlier (Fig. 8.2). Let’s again take the reaction of tert-butyl iodide with
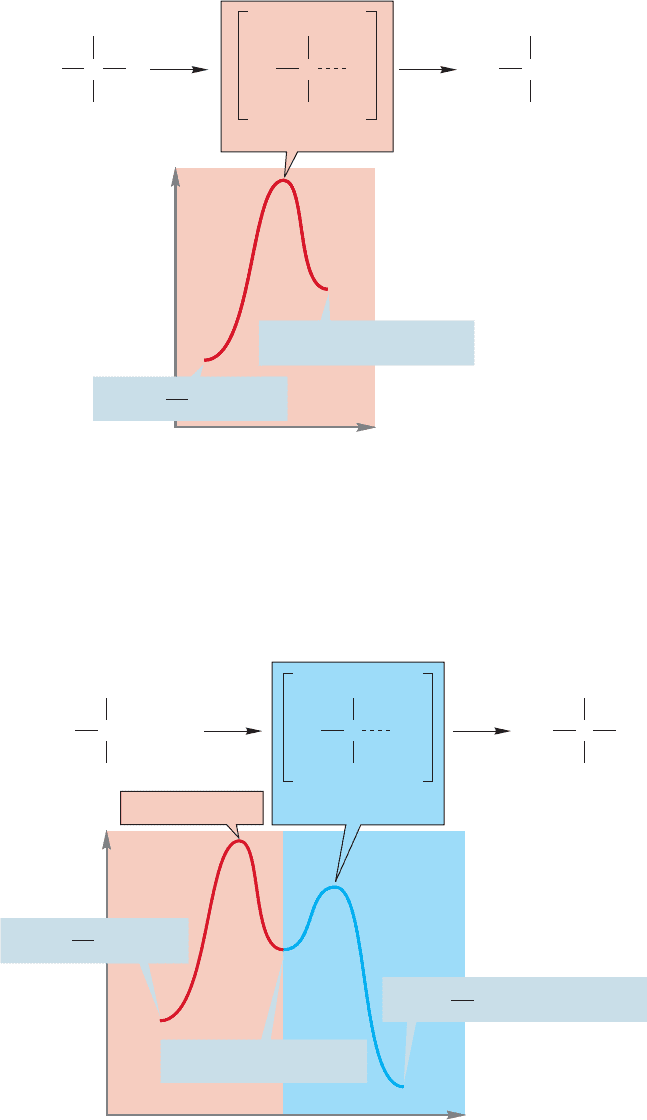
8.6 Energy Barriers in Chemical Reactions 347
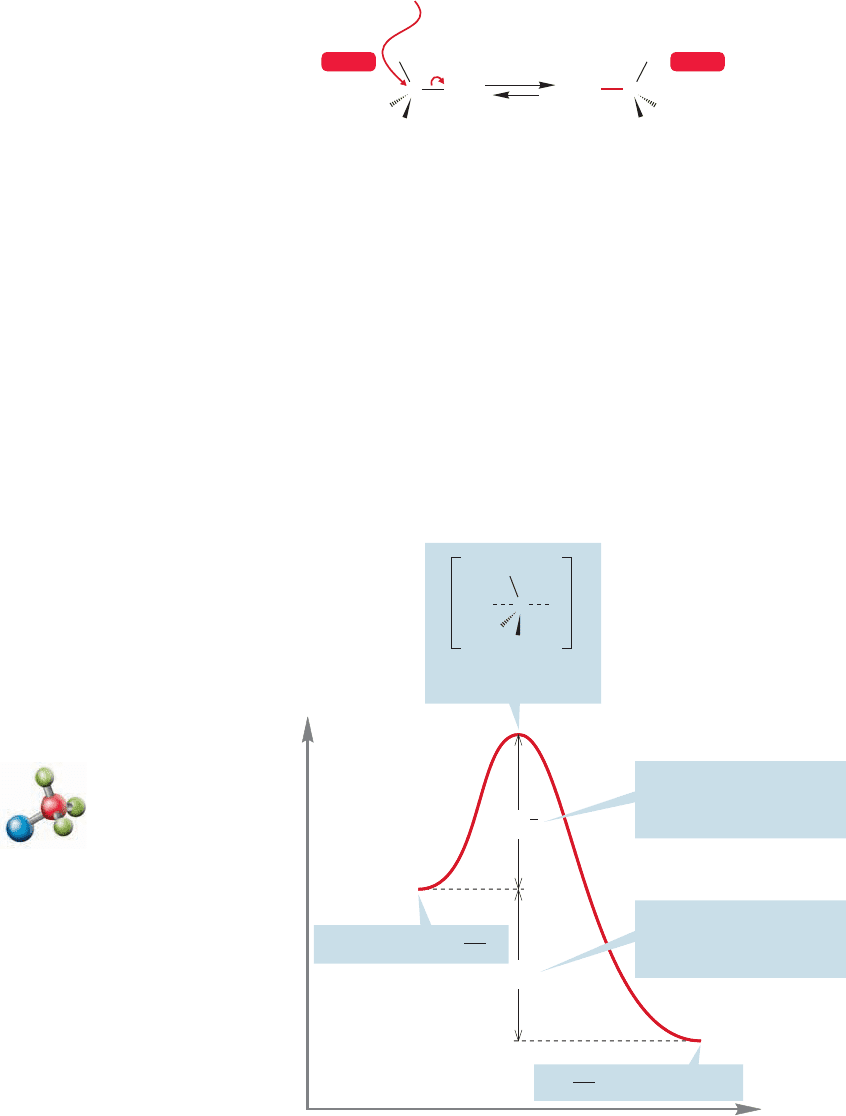
solvent water as an example.The first step is the formation of an intermediate car-
bocation. We expect this first reaction to be quite endothermic as a carbon–leav-
ing group bond must be broken and ions must be formed. The high-energy point
in this reaction, transition state 1, occurs as the carbon–iodine bond stretches
(Fig. 8.21).
Energy
Reaction progress
(CH
3
)
3
C
+
+
Transition state 1
H
3
C
CH
3
CH
3
I
δ
–
δ
+
C H
3
C
CH
3
CH
3
C
+
H
3
C
CH
3
CH
3
C
+
+
+
(CH
3
)
3
C
–
I
..
..
..
..
–
I
..
..
..
..
I
..
..
..
I
..
..
..
..
..
H
2
O
..
..
H
2
O
FIGURE 8.21 The first step in the
S
N
1 reaction of tert-butyl iodide in
water. The formation of the cation is
highly endothermic.
Energy
Reaction progress
H
3
C
CH
3
CH
3
OH
2
..
C
+
H
3
C
CH
3
CH
3
C
+
+
(CH
3
)
3
C
..
..
H
2
O
I
..
..
..
..
..
H
2
O
OH
2
..
++
(CH
3
)
3
C
–
I
..
..
..
..
..
..
H
2
O
Transition state 1
(CH
3
)
3
C
+
+
+
–
I
..
..
..
..
..
..
H
2
O
Transition state 2
OH
2
..
δ
+
+
δ
+
H
3
C
CH
3
CH
3
C
+
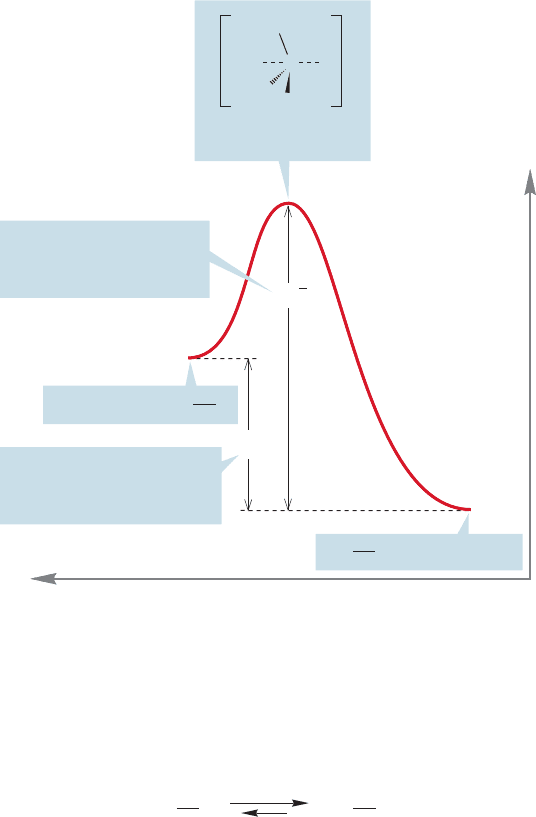
FIGURE 8.22 By contrast, the second
step in this S
N
1 reaction, the capture
of the cation by water, is highly
exothermic.Transition state 2 is
lower than transition state 1;
therefore, capture of the carbocation
by water is favored.
The second step involves the reaction of the nucleophilic solvent water with the
carbocation, and is highly exothermic because a bond is made and none is broken.
There is a second barrier, and therefore another transition state (2) for this second
step of the reaction (Fig. 8.22).
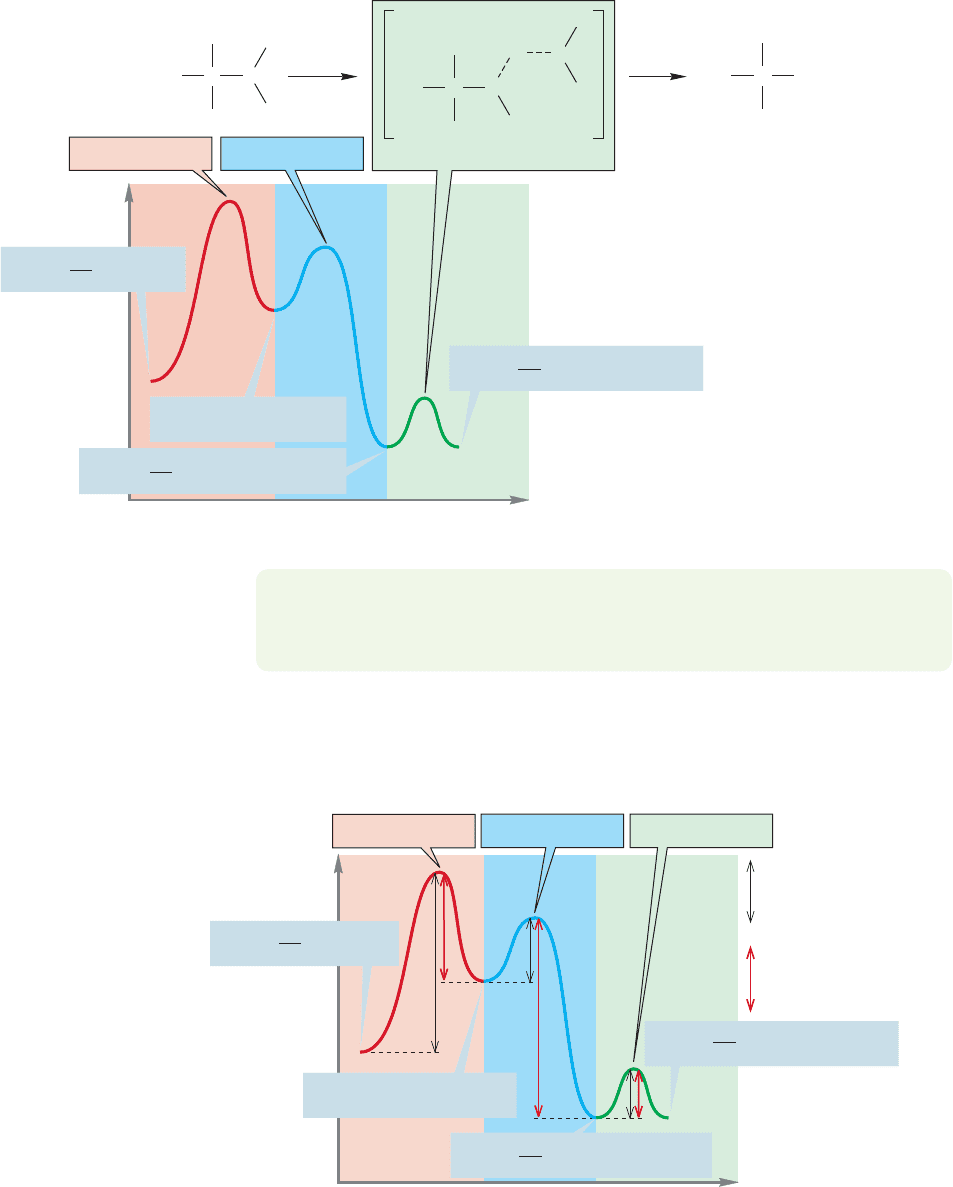
348 CHAPTER 8 Equilibria
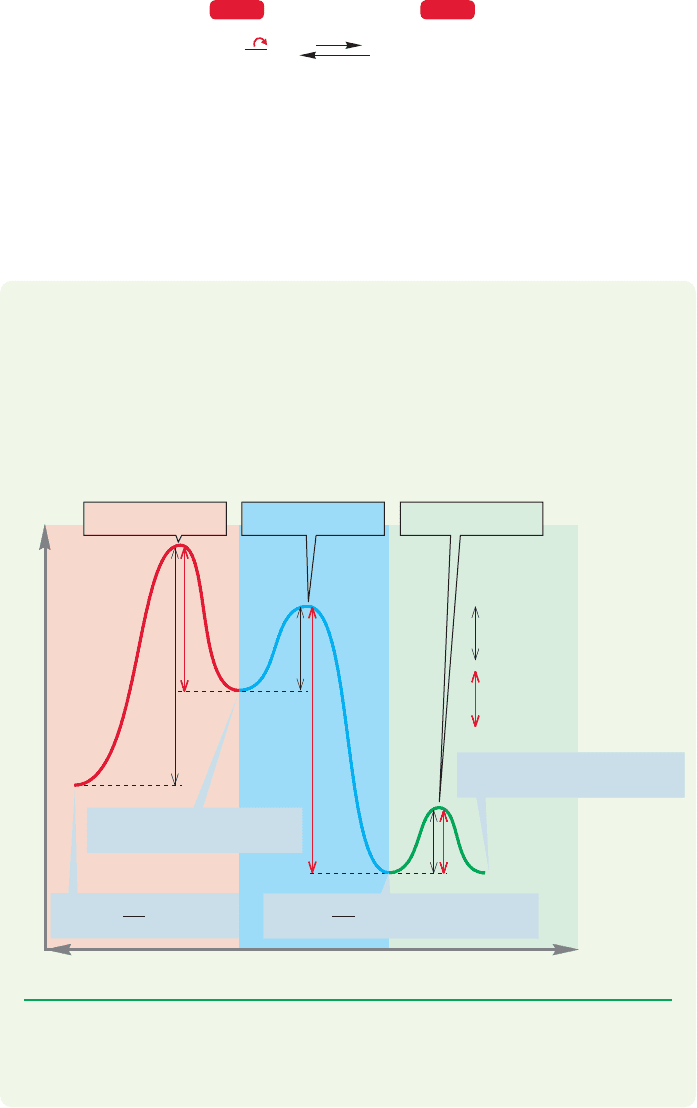
As you saw in Worked Problem 8.6,there are six activation energies in the com-
pleted diagram for this S
N
1 reaction, three for the forward reactions and three for
the reverse reactions (Fig. 8.24).
Energy
Reaction progress
Transition state 3Transition state 1 Transition state 2
H
3
C
CH
3
OH
2
CH
3
OH
2
..
δ
+
δ
+
C
H
H
H
3
C
CH
3
CH
3
C
H
3
C
CH
3
CH
3
C
O
..
H
H
O
..
++
(CH
3
)
3
C
+
++
H
2
O
..
(CH
3
)
3
C
OH
..
..
OH
..
..
++
(CH
3
)
3
C
+
(CH
3
)
3
C
+
H
H
O
..
..
..
..
..
–
I
..
..
..
..
..
–
I
..
..
..
..
I
..
..
..
–
I
..
..
..
..
H
3
O
..
+
++
–
I
..
..
..
..
H
3
O
..
+
H
2
O
..
..
H
2
O
+
FIGURE 8.23 Transition state for the
final step in this S
N
1 reaction.
PROBLEM 8.8 Draw an Energy versus Reaction progress diagram for the S
N
1 reac-
tion of tert-butyl iodide in H
2
O/KOH containing an additional nucleophile,
Note that the major product is not necessarily tert-butyl alcohol (Fig. 7.60, p. 295).
Nu
:
-
.
Activation energies for
the reverse reactions
Activation energies for
the forward reactions
Energy
Reaction progress
(CH
3
)
3
C
+
++
H
2
O
..
–
I
..
..
..
..
..
+
(CH
3
)
3
C
I
..
..
..
..
..
H
2
O
OH
2
..
++
(CH
3
)
3
C
..
..
–
I
..
..
..
..
H
2
O
+
OH
..
..
++
(CH
3
)
3
C
–
I
..
..
..
..
H
3
O
..
+
Transition state 1
Transition state 2
Transition state 3
FIGURE 8.24 The three black double-
headed arrows represent activation
energies for the forward reactions and
the three red double-headed arrows
represent activation energies for the
reverse reactions.
The third and final step in this particular S
N
1 reaction is removal of a proton
from the oxonium ion by a base to give the ultimate product, tert-butyl alcohol. So
there is a third barrier and a third transition state (Fig. 8.23).