Manning Ch. D., Raghavan P., Sch?tze H. Introduction to Information Retrieval - Введение в информационный поиск
Подождите немного. Документ загружается.

Online edition (c)2009 Cambridge UP
126 6 Scoring, term weighting and the vector space model
data structure, often implemented using a heap. Such a heap takes no more
than 2N comparisons to construct, following which each of the K top scores
can be extracted from the heap at a cost of O(log N) comparisons.
Note that the general algorithm of Figure
6.14 does not prescribe a specific
implementation of how we traverse the postings lists of the various query
terms; we may traverse them one term at a time as in the loop beginning
at Step 3, or we could in fact traverse them concurrently as in Figure
1.6. In
such a concurrent postings traversal we compute the scores of one document
at a time, so that it is sometimes called document-at-a-time scoring. We willDOCUMENT-AT-A-TIME
say more about this in Section
7.1.5.
?
Exercise 6.14
If we were to stem jealous and jealousy to a common stem before setting up the vector
space, detail how the definitions of tf and idf should be modified.
Exercise 6.15
Recall the tf-idf weights computed in Exercise 6.10. Compute the Euclidean nor-
malized document vectors for each of the documents, where each vector has four
components, one for each of the four terms.
Exercise 6.16
Verify that the sum of the squares of the components of each of the document vectors
in Exercise
6.15 is 1 (to within rounding error). Why is this the case?
Exercise 6.17
With term weights as computed in Exercise 6.15, rank the three documents by com-
puted score for the query car insurance, for each of the following cases of term weight-
ing in the query:
1. The weight of a term is 1 if present in the query, 0 otherwise.
2. Euclidean normalized idf.
6.4 Variant tf -idf functions
For assigning a weight for each term in each document, a number of alterna-
tives to tf and tf-idf have been considered. We discuss some of the principal
ones here; a more complete development is deferred to Chapter
11. We will
summarize these alternatives in Section 6.4.3 (page 128).
6.4.1 Sublinear tf scaling
It seems unlikely that twenty occurrences of a term in a document truly carry
twenty times the significance of a single occurrence. Accordingly, there has
been considerable research into variants of term frequency that go beyond
counting the number of occurrences of a term. A common modification is

Online edition (c)2009 Cambridge UP
6.4 Variant tf-idf functions 127
to use instead the logarithm of the term frequency, which assigns a weight
given by
wf
t,d
=
1 + log tf
t,d
if tf
t,d
> 0
0 otherwise
.
(6.13)
In this form, we may replace tf by some other function wf as in (6.13), to
obtain:
wf-idf
t,d
= wf
t,d
×idf
t
.(6.14)
Equation (6.9) can then be modified by replacing tf-idf by wf-idf as defined
in (6.14).
6.4.2 Maximum tf normalization
One well-studied technique is to normalize the tf weights of all terms occur-
ring in a document by the maximum tf in that document. For each document
d, let tf
max
(d) = max
τ∈d
tf
τ,d
, where τ ranges over all terms in d. Then, we
compute a normalized term frequency for each term t in document d by
ntf
t,d
= a + (1 − a)
tf
t,d
tf
max
(d)
,
(6.15)
where a is a value between 0 and 1 and is generally set to 0.4, although some
early work used the value 0.5. The term a in (
6.15) is a smoothing term whoseSMOOTHING
role is to damp the contribution of the second term – which may be viewed as
a scaling down of tf by the largest tf value in d. We will encounter smoothing
further in Chapter
13 when discussing classification; the basic idea is to avoid
a large swing in ntf
t,d
from modest changes in tf
t,d
(say from 1 to 2). The main
idea of maximum tf normalization is to mitigate the following anomaly: we
observe higher term frequencies in longer documents, merely because longer
documents tend to repeat the same words over and over again. To appreciate
this, consider the following extreme example: supposed we were to take a
document d and create a new document d
′
by simply appending a copy of d
to itself. While d
′
should be no more relevant to any query than d is, the use
of (
6.9) would assign it twice as high a score as d . Replacing tf-idf
t,d
in (6.9) by
ntf-idf
t,d
eliminates the anomaly in this example. Maximum tf normalization
does suffer from the following issues:
1. The method is unstable in the following sense: a change in the stop word
list can dramatically alter term weightings (and therefore ranking). Thus,
it is hard to tune.
2. A document may contain an outlier term with an unusually large num-
ber of occurrences of that term, not representative of the content of that
document.
Online edition (c)2009 Cambridge UP
128 6 Scoring, term weighting and the vector space model
Term frequency Document frequency Normalization
n (natural) tf
t,d
n (no) 1 n (none) 1
l (logarithm) 1 + log(tf
t,d
) t (idf) log
N
df
t
c (cosine)
1
√
w
2
1
+w
2
2
+...+w
2
M
a (augmented) 0.5 +
0.5×tf
t,d
max
t
(tf
t,d
)
p (prob idf) max{0, log
N−df
t
df
t
} u (pivoted
unique)
1/u (Section 6.4.4)
b (boolean)
1 if tf
t,d
> 0
0 otherwise
b (byte size) 1/CharLength
α
, α < 1
L (log ave)
1+log(tf
t,d
)
1+log(ave
t∈d
(tf
t,d
))
◮
Figure 6.15 SMART notation for tf-idf variants. Here CharLength is the number
of characters in the document.
3. More generally, a document in which the most frequent term appears
roughly as often as many other terms should be treated differently from
one with a more skewed distribution.
6.4.3 Document and query weighting schemes
Equation (
6.12) is fundamental to information retrieval systems that use any
form of vector space scoring. Variations from one vector space scoring method
to another hinge on the specific choices of weights in the vectors
~
V(d) and
~
V(q). Figure
6.15 lists some of the principal weighting schemes in use for
each of
~
V(d) and
~
V(q), together with a mnemonic for representing a spe-
cific combination of weights; this system of mnemonics is sometimes called
SMART notation, following the authors of an early text retrieval system. The
mnemonic for representing a combination of weights takes the form ddd. qqq
where the first triplet gives the term weighting of the document vector, while
the second triplet gives the weighting in the query vector. The first letter in
each triplet specifies the term frequency component of the weighting, the
second the document frequency component, and the third the form of nor-
malization used. It is quite common to apply different normalization func-
tions to
~
V(d) and
~
V(q). For example, a very standard weighting scheme
is lnc.ltc, where the document vector has log-weighted term frequency, no
idf (for both effectiveness and efficiency reasons), and cosine normalization,
while the query vector uses log-weighted term frequency, idf weighting, and
cosine normalization.
Online edition (c)2009 Cambridge UP
6.4 Variant tf-idf functions 129
✄
6.4.4 Pivoted normalized document length
In Section 6.3.1 we normalized each document vector by the Euclidean length
of the vector, so that all document vectors turned into unit vectors. In doing
so, we eliminated all information on the length of the original document;
this masks some subtleties about longer documents. First, longer documents
will – as a result of containing more terms – have higher tf values. Second,
longer documents contain more distinct terms. These factors can conspire to
raise the scores of longer documents, which (at least for some information
needs) is unnatural. Longer documents can broadly be lumped into two cat-
egories: (1) verbose documents that essentially repeat the same content – in
these, the length of the document does not alter the relative weights of dif-
ferent terms; (2) documents covering multiple different topics, in which the
search terms probably match small segments of the document but not all of
it – in this case, the relative weights of terms are quite different from a single
short document that matches the query terms. Compensating for this phe-
nomenon is a form of document length normalization that is independent of
term and document frequencies. To this end, we introduce a form of normal-
izing the vector representations of documents in the collection, so that the
resulting “normalized” documents are not necessarily of unit length. Then,
when we compute the dot product score between a (unit) query vector and
such a normalized document, the score is skewed to account for the effect
of document length on relevance. This form of compensation for document
length is known as pivoted document length normalization.PIVOTED DOCUMENT
LENGTH
NORMALIZATION
Consider a document collection together with an ensemble of queries for
that collection. Suppose that we were given, for each query q and for each
document d, a Boolean judgment of whether or not d is relevant to the query
q; in Chapter
8 we will see how to procure such a set of relevance judgments
for a query ensemble and a document collection. Given this set of relevance
judgments, we may compute a probability of relevance as a function of docu-
ment length, averaged over all queries in the ensemble. The resulting plot
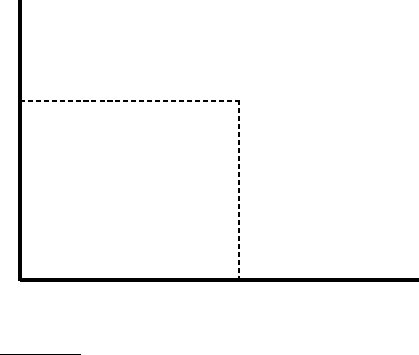
may look like the curve drawn in thick lines in Figure
6.16. To compute this
curve, we bucket documents by length and compute the fraction of relevant
documents in each bucket, then plot this fraction against the median docu-
ment length of each bucket. (Thus even though the “curve” in Figure
6.16
appears to be continuous, it is in fact a histogram of discrete buckets of doc-
ument length.)
On the other hand, the curve in thin lines shows what might happen with
the same documents and query ensemble if we were to use relevance as pre-
scribed by cosine normalization Equation (
6.12) – thus, cosine normalization
has a tendency to distort the computed relevance vis-à-vis the true relevance,
at the expense of longer documents. The thin and thick curves crossover at a
point p corresponding to document length ℓ
p
, which we refer to as the pivot
Online edition (c)2009 Cambridge UP
130 6 Scoring, term weighting and the vector space model
Document length
Relevance
ℓ
p
p
-
6
◮
Figure 6.16 Pivoted document length normalization.
length; dashed lines mark this point on the x− and y− axes. The idea of
pivoted document length normalization would then be to “rotate” the co-
sine normalization curve counter-clockwise about p so that it more closely
matches thick line representing the relevance vs. document length curve.
As mentioned at the beginning of this section, we do so by using in Equa-
tion (
6.12) a normalization factor for each document vector
~
V(d) that is not
the Euclidean length of that vector, but instead one that is larger than the Eu-
clidean length for documents of length less than ℓ
p
, and smaller for longer
documents.
To this end, we first note that the normalizing term for
~
V(d) in the de-
nominator of Equation (
6.12) is its Euclidean length, denoted |
~
V(d)|. In the
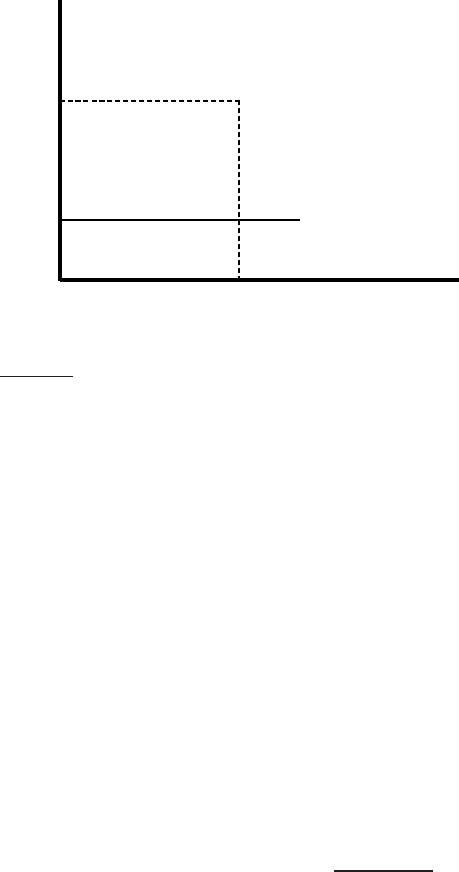
simplest implementation of pivoted document length normalization, we use
a normalization factor in the denominator that is linear in |
~
V(d)|, but one
of slope < 1 as in Figure 6.17. In this figure, the x− axis represents |
~
V(d)|,
while the y−axis represents possible normalization factors we can use. The
thin line y = x depicts the use of cosine normalization. Notice the following
aspects of the thick line representing pivoted length normalization:
1. It is linear in the document length and has the form
a |
~
V(d)|+ (1 − a)piv,
(6.16)
Online edition (c)2009 Cambridge UP
6.4 Variant tf-idf functions 131
|
~
V(d)|
Pivoted normalization
y = x; Cosine
Pivoted
piv
-
6
◮
Figure 6.17 Implementing pivoted document length normalization by linear scal-
ing.
where piv is the cosine normalization value at which the two curves in-
tersect.
2. Its slope is a < 1 and (3) it crosses the y = x line at piv.
It has been argued that in practice, Equation (
6.16) is well approximated by
a u
d
+ (1 − a)piv,
where u
d
is the number of unique terms in document d.
Of course, pivoted document length normalization is not appropriate for
all applications. For instance, in a collection of answers to frequently asked
questions (say, at a customer service website), relevance may have little to
do with document length. In other cases the dependency may be more com-
plex than can be accounted for by a simple linear pivoted normalization. In
such cases, document length can be used as a feature in the machine learning
based scoring approach of Section
6.1.2.
?
Exercise 6.18
One measure of the similarity of two vectors is the Euclidean distance (or L
2
distance)EUCLIDEAN DISTANCE
between them:
|~x −~y| =
v
u
u
t
M
∑
i=1
(x
i
−y
i
)
2
Online edition (c)2009 Cambridge UP
132 6 Scoring, term weighting and the vector space model
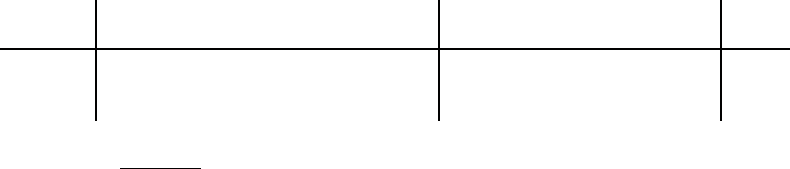
query document
word tf wf df idf q
i
= wf-idf tf wf d
i
= normalized wf q
i
·d
i
digital 10,000
video 100,000
cameras 50,000
◮
Table 6.1 Cosine computation for Exercise 6.19.
Given a query q and documents d
1
, d
2
, . . ., we may rank the documents d
i
in order
of increasing Euclidean distance from q. Show that if q and the d
i
are all normalized
to unit vectors, then the rank ordering produced by Euclidean distance is identical to
that produced by cosine similarities.
Exercise 6.19
Compute the vector space similarity between the query “digital cameras” and the
document “digital cameras and video cameras” by filling out the empty columns in
Table
6.1. Assume N = 10,000,000, logarithmic term weighting (wf columns) for
query and document, idf weighting for the query only and cosine normalization for
the document only. Treat and as a stop word. Enter term counts in the tf columns.
What is the final similarity score?
Exercise 6.20
Show that for the query affection, the relative ordering of the scores of the three doc-
uments in Figure
6.13 is the reverse of the ordering of the scores for the query jealous
gossip.
Exercise 6.21
In turning a query into a unit vector in Figure 6.13, we assigned equal weights to each
of the query terms. What other principled approaches are plausible?
Exercise 6.22
Consider the case of a query term that is not in the set of M indexed terms; thus our
standard construction of the query vector results in
~
V(q) not being in the vector space
created from the collection. How would one adapt the vector space representation to
handle this case?
Exercise 6.23
Refer to the tf and idf values for four terms and three documents in Exercise 6.10.
Compute the two top scoring documents on the query best car insurance for each of
the following weighing schemes: (i) nnn.atc; (ii) ntc.atc.
Exercise 6.24
Suppose that the word coyote does not occur in the collection used in Exercises 6.10
and 6.23. How would one compute ntc.atc scores for the query coyote insurance?
Online edition (c)2009 Cambridge UP
6.5 References and further reading 133
6.5 Refe rences and further reading
Chapter
7 develops the computational aspects of vector space scoring. Luhn
(1957; 1958) describes some of the earliest reported applications of term weight-
ing. His paper dwells on the importance of medium frequency terms (terms
that are neither too commonplace nor too rare) and may be thought of as an-
ticipating tf-idf and related weighting schemes. Spärck Jones (1972) builds
on this intuition through detailed experiments showing the use of inverse
document frequency in term weighting. A series of extensions and theoret-
ical justifications of idf are due to Salton and Buckley (1987) Robertson and
Jones (1976), Croft and Harper (1979) and Papineni (2001). Robertson main-
tains a web page (http://www.soi.city.ac.uk/˜ser/idf.html) containing the history
of idf, including soft copies of early papers that predated electronic versions
of journal article. Singhal et al. (1996a) develop pivoted document length
normalization. Probabilistic language models (Chapter
11) develop weight-
ing techniques that are more nuanced than tf-idf; the reader will find this
development in Section 11.4.3.
We observed that by assigning a weight for each term in a document, a
document may be viewed as a vector of term weights, one for each term in
the collection. The SMART information retrieval system at Cornell (Salton
1971b) due to Salton and colleagues was perhaps the first to view a doc-
ument as a vector of weights. The basic computation of cosine scores as
described in Section
6.3.3 is due to Zobel and Moffat (2006). The two query
evaluation strategies term-at-a-time and document-at-a-time are discussed
by Turtle and Flood (1995).
The SMART notation for tf-idf term weighting schemes in Figure
6.15 is
presented in (Salton and Buckley 1988, Singhal et al. 1995; 1996b). Not all
versions of the notation are consistent; we most closely follow (Singhal et al.
1996b). A more detailed and exhaustive notation was developed in Moffat
and Zobel (1998), considering a larger palette of schemes for term and doc-
ument frequency weighting. Beyond the notation, Moffat and Zobel (1998)
sought to set up a space of feasible weighting functions through which hill-
climbing approaches could be used to begin with weighting schemes that
performed well, then make local improvements to identify the best combi-
nations. However, they report that such hill-climbing methods failed to lead
to any conclusions on the best weighting schemes.
Online edition (c)2009 Cambridge UP
Online edition (c)2009 Cambridge UP
DRAFT! © April 1, 2009 Cambridge University Press. Feedback welcome. 135
7
Computing scores in a c omplete
search system
Chapter
6 developed the theory underlying term weighting in documents
for the purposes of scoring, leading up to vector space models and the basic
cosine scoring algorithm of Section
6.3.3 (page 124). In this chapter we be-
gin in Section 7.1 with heuristics for speeding up this computation; many of
these heuristics achieve their speed at the risk of not finding quite the top K
documents matching the query. Some of these heuristics generalize beyond
cosine scoring. With Section
7.1 in place, we have essentially all the compo-
nents needed for a complete search engine. We therefore take a step back
from cosine scoring, to the more general problem of computing scores in a
search engine. In Section
7.2 we outline a complete search engine, includ-
ing indexes and structures to support not only cosine scoring but also more
general ranking factors such as query term proximity. We describe how all
of the various pieces fit together in Section
7.2.4. We conclude this chapter
with Section 7.3, where we discuss how the vector space model for free text
queries interacts with common query operators.
7.1 Efficient scoring and ranking
We begin by recapping the algorithm of Figure
6.14. For a query such as q =
jealous gossip, two observations are immediate:
1. The unit vector ~v(q) has only two non-zero components.
2. In the absence of any weighting for query terms, these non-zero compo-
nents are equal – in this case, both equal 0.707.
For the purpose of ranking the documents matching this query, we are
really interested in the relative (rather than absolute) scores of the documents
in the collection. To this end, it suffices to compute the cosine similarity from
each document unit vector ~v(d) to
~
V(q) (in which all non-zero components
of the query vector are set to 1), rather than to the unit vector ~v(q). For any