Marder M.P. Condensed Matter Physics
Подождите немного. Документ загружается.

Microscopic Theory of Superconductivity
873
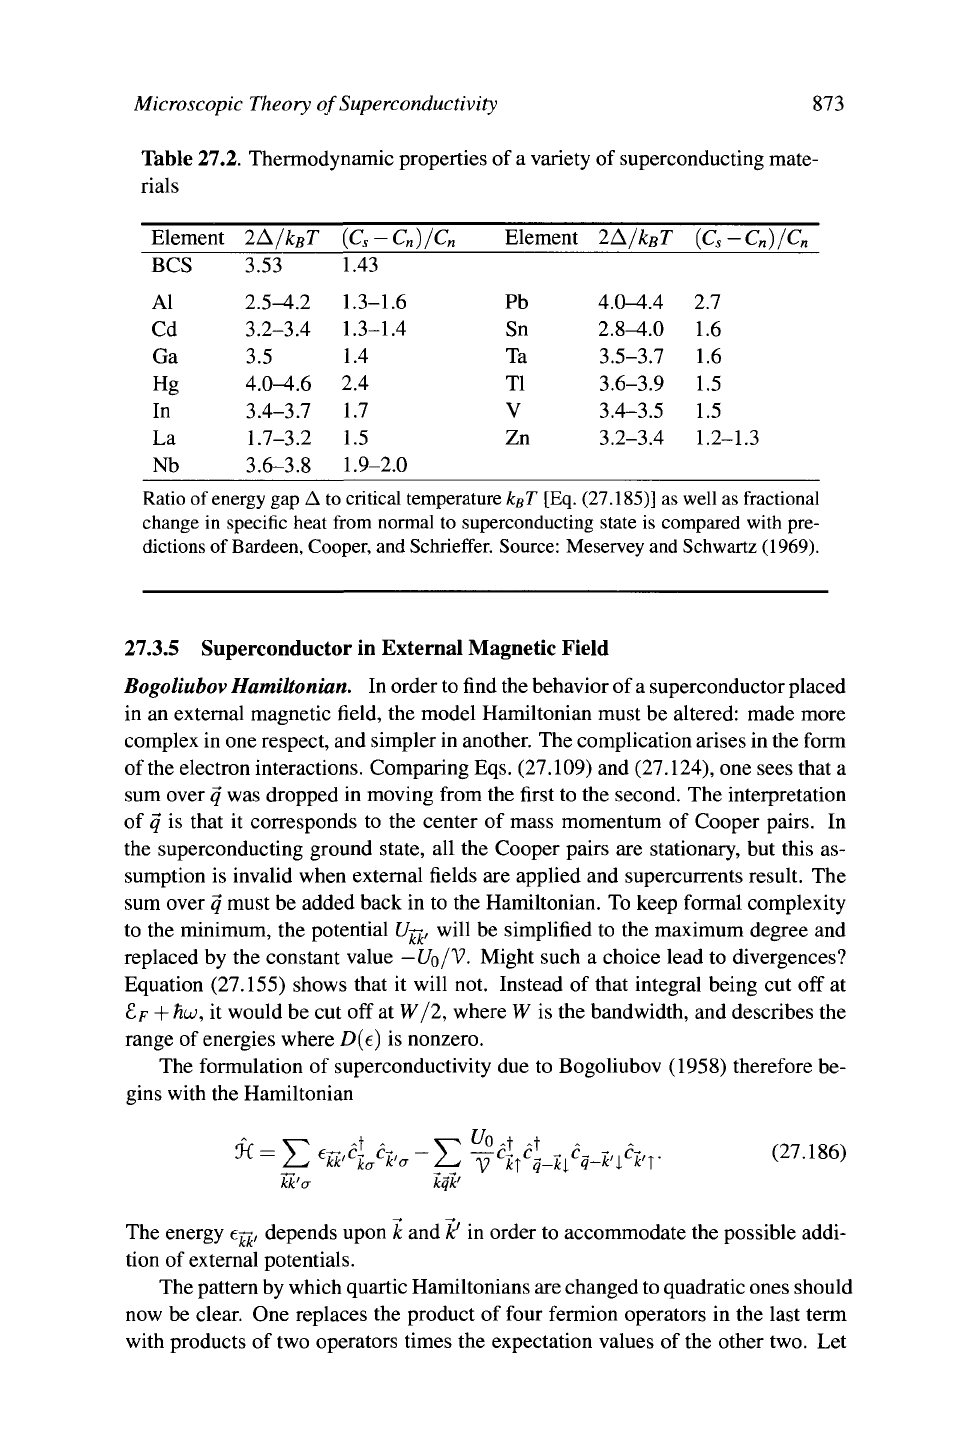
Table 27.2. Thermodynamic properties
of a
variety
of
superconducting mate-
rials
Element 2A/k
B
T (C
s
-C
n
)/C
n
Element 2A/k
B
T (C
s
-C
n
)/C
n
BCS
Al
Cd
Ga
Hg
In
La
Nb
3.53
2.5-4.2
3.2-3.4
3.5
4.0-4.6
3.4-3.7
1.7-3.2
3.6-3.8
1.43
1.3-1.6
1.3-1.4
1.4
2.4
1.7
1.5
1.9-2.0
Ratio
of
energy
gap
A
to critical temperature
k
B
T
[Eq. (27.185)] as well as fractional
change
in
specific heat from normal
to
superconducting state
is
compared with pre-
dictions
of
Bardeen,
Cooper, and Schrieffer. Source: Meservey and Schwartz (1969).
27.3.5 Superconductor
in
External Magnetic Field
Bogoliubov Hamiltonian. In order to find the behavior of a superconductor placed
in
an
external magnetic field,
the
model Hamiltonian must
be
altered: made more
complex
in
one respect,
and
simpler in another. The complication arises
in
the form
of the electron interactions. Comparing Eqs. (27.109)
and
(27.124),
one
sees that
a
sum over
q was
dropped
in
moving from
the
first
to the
second.
The
interpretation
of
q is
that
it
corresponds
to the
center
of
mass momentum
of
Cooper pairs.
In
the superconducting ground state,
all the
Cooper pairs
are
stationary,
but
this
as-
sumption
is
invalid when external fields
are
applied
and
supercurrents result.
The
sum over
q
must
be
added back
in to the
Hamiltonian. To keep formal complexity
to
the
minimum,
the
potential
U-^,
will
be
simplified
to the
maximum degree
and
replaced
by the
constant value
—Uo/V.
Might such
a
choice lead
to
divergences?
Equation (27.155) shows that
it
will
not.
Instead
of
that integral being
cut off at
£f
+
hu>,
it
would
be cut off at W/2,
where
W is the
bandwidth,
and
describes
the
range
of
energies where D(e)
is
nonzero.
The formulation
of
superconductivity
due to
Bogoliubov (1958) therefore
be-
gins with
the
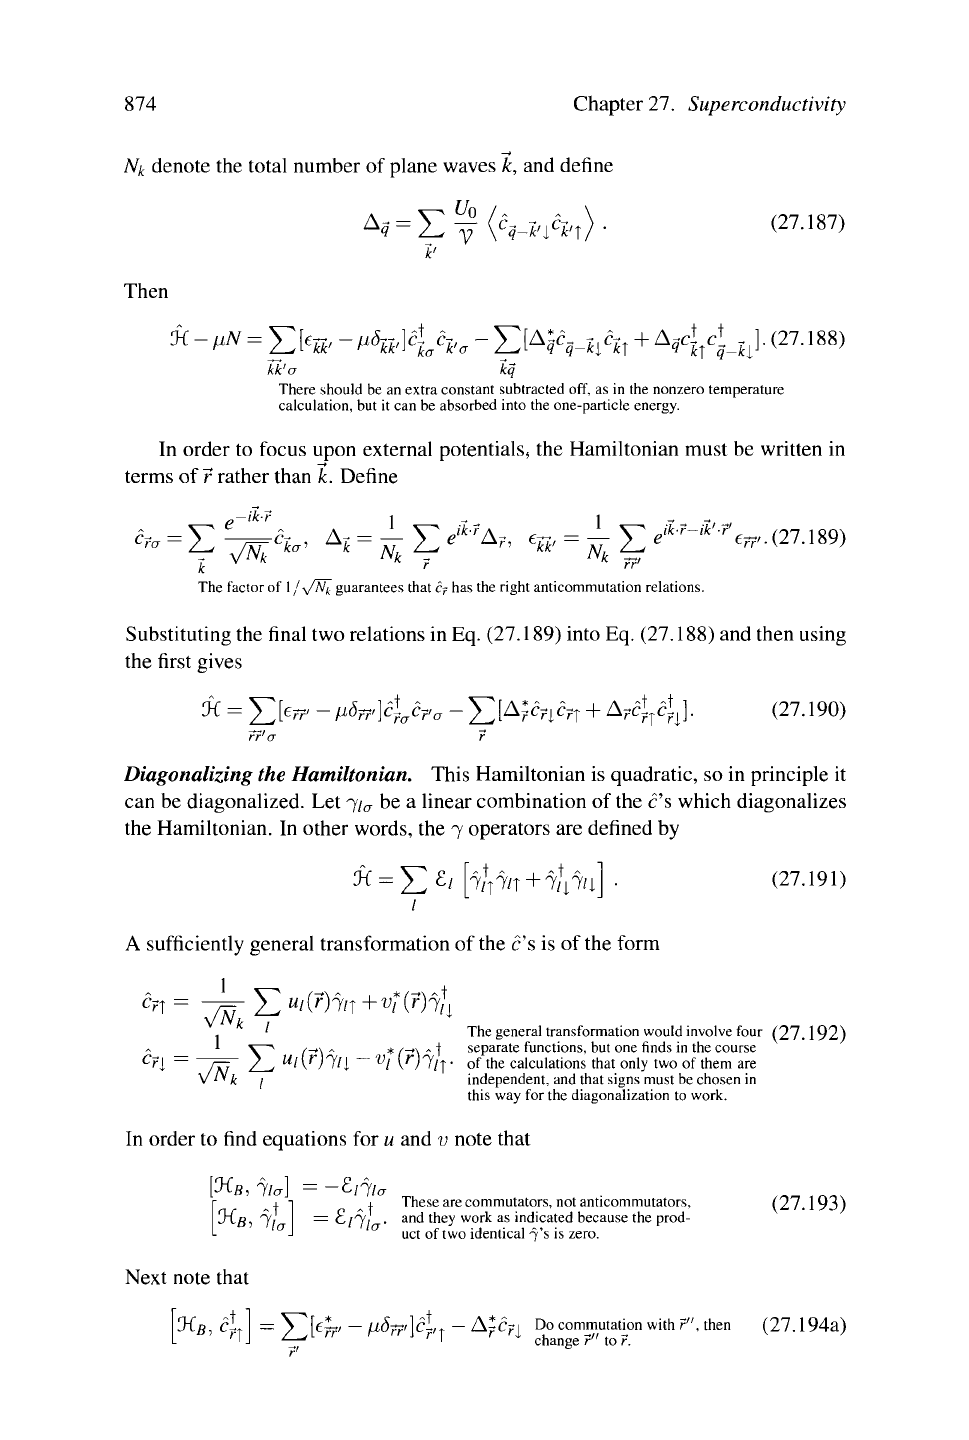
Hamiltonian
kk'a
kqk'
The energy
eg,
depends upon
k and
K
in
order
to
accommodate
the
possible addi-
tion
of
external potentials.
The pattern by which quartic Hamiltonians are changed to quadratic ones should
now
be
clear.
One
replaces
the
product
of
four fermion operators
in the
last term
with products
of
two operators times
the
expectation values
of the
other two.
Let
Pb
Sn
Ta
Tl
V
Zn
4.0-4.4
2.8^1.0
3.5-3.7
3.6-3.9
3.4-3.5
3.2-3.4
2.7
1.6
1.6
1.5
1.5
1.2-1.3
874
Chapter 27. Superconductivity
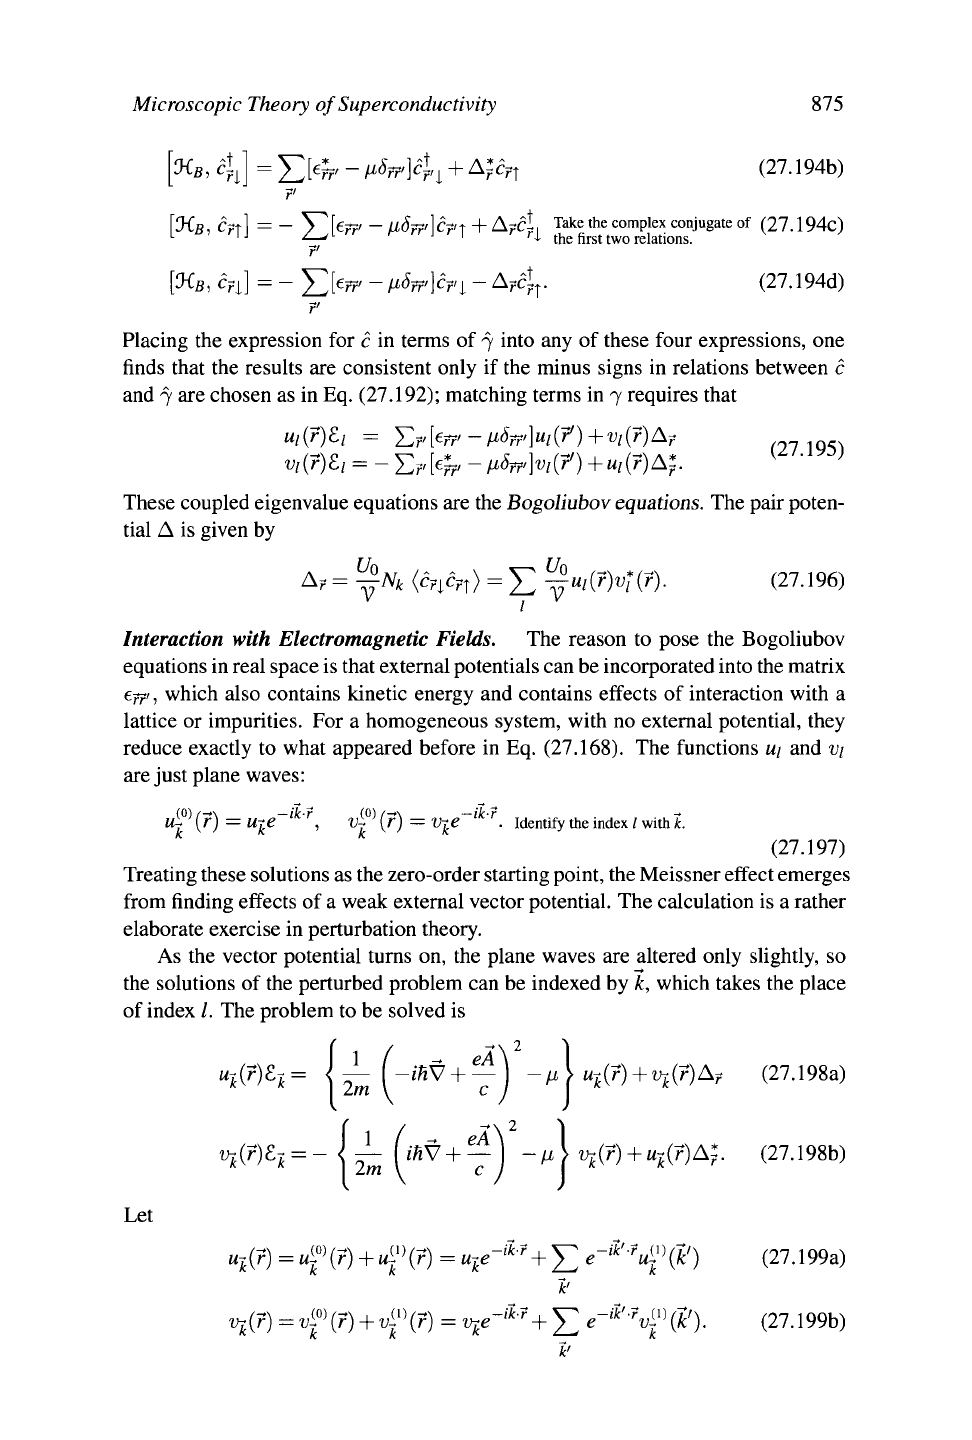
Nk denote
the
total number
of
plane waves
k, and
define
**
=
£
V \
C
q-k'i
C
k']
(27.187)
Then
Ä
-
UN
=
Y^[e
Tk
,
-
ßo
U/
}clc
lla
-
$>&-^T
+
A
4A-h
]
-
(27
-
188)
Wer
&g
There should
be an
extra constant subtracted
off, as in the
nonzero temperature
calculation,
but it can be
absorbed into
the
one-particle energy.
In order
to
focus upon external potentials,
the
Hamiltonian must
be
written
in
terms
of r
rather than
k.
Define
L- *VT
E
0
—ik-r
1
1
N~
k
E
^*
"w
=
if E
***-*-
J
V(27.189)
The factor
of
1
/y/N^
guarantees that
c-f
has the right anticommutation relations.
Substituting the final two relations
in
Eq. (27.189) into Eq. (27.188) and then using
the first gives
Ä
=
£[e??'
-
iiàrr\c\
a
c-fi
a
-
^[A£c^c?
T
+
A
?
ct
T
4j
(27.190)
Diagonalizing the Hamiltonian. This Hamiltonian
is
quadratic,
so in
principle
it
can
be
diagonalized.
Let
7/<j
be a
linear combination
of
the
c's
which diagonalizes
the Hamiltonian.
In
other words,
the 7
operators
are
defined
by
&
=
££/
T/TT/T+7^7/1
(27.191)
A sufficiently general transformation
of
the
c's is of
the form
1
c
n
£«/(r)7/T+<(r)7/j
1
k
I
n
C7
n
The general transformation would involve four (27.192)
-1 separate functions,
but
one finds
in
the course
[
are
E
/-,\
-
*,_,%„!
separate functions,
but
one finds
in
the cou:
u
l\
r
)lll
~~
v
l
l
r
J7/|
•
of
the calculations that only
two of
them
i
*
/
independent, and that signs must be chosen
in
this
way for
the diagonalization
to
work.
In order
to
find equations
for
u and
v
note that
"KB,
îic
''
_£
/7/cr
_
j.
-i j.
These are commutators, not anticommutators,
!Xß,
7. = £/7/ . and
they work
as
indicated because
the
prod-
a
-I
a
uct of
two identical
7's is
zero.
(27.193)
Next note that
[KB,
cLl = V[e~, -
lib-ffAcL*
-
AÎCpi Do commutation with
r",
then (27.194a)
'
i
z
—' '
change
r" to r.
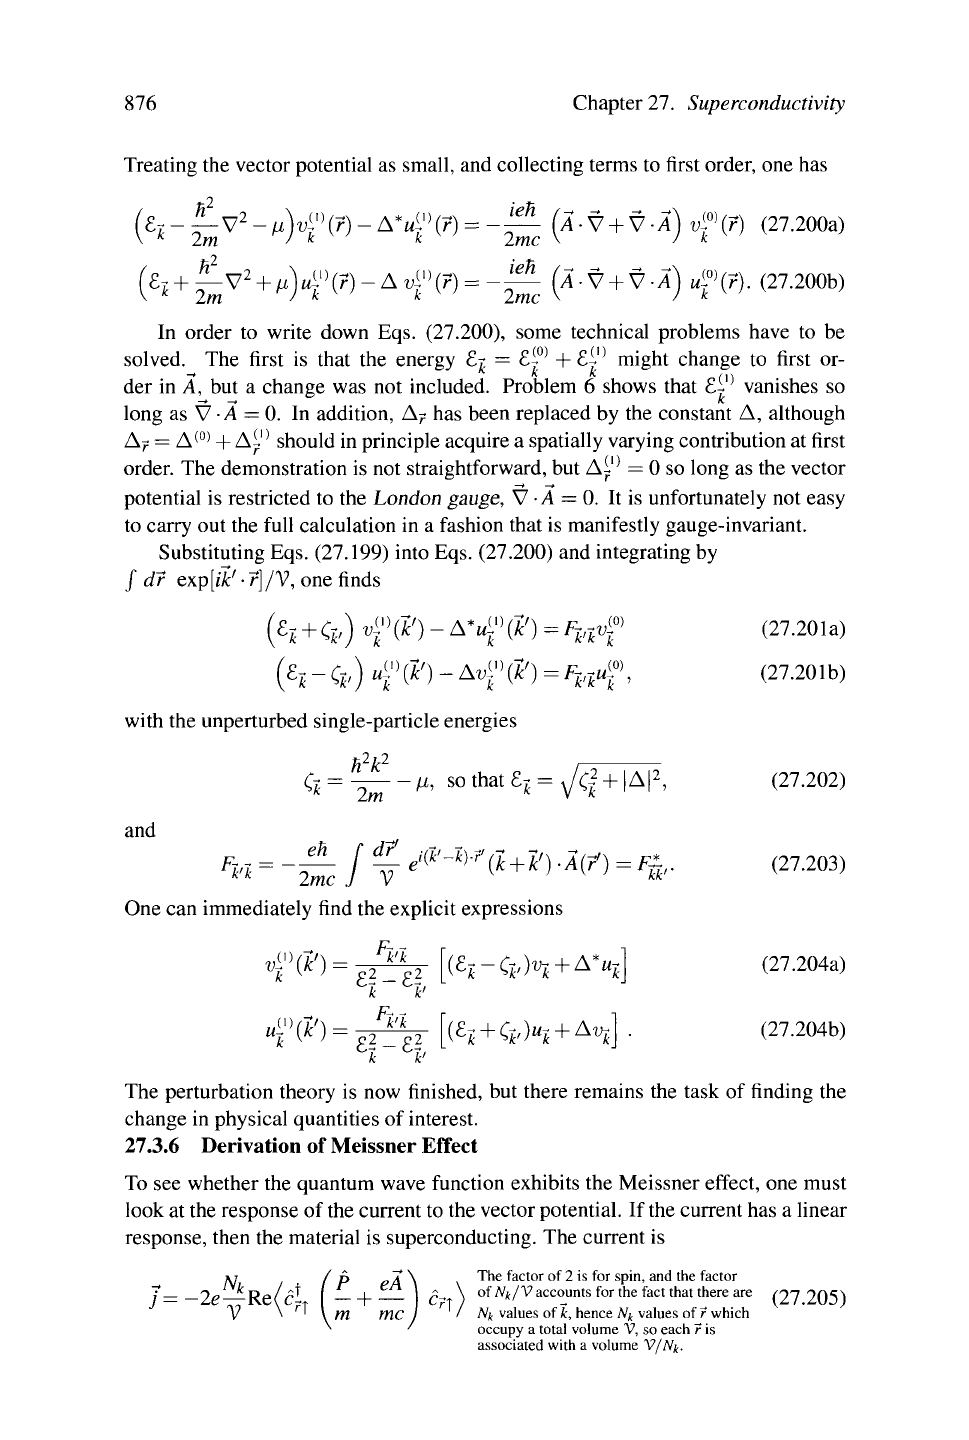
Microscopic Theory of Superconductivity 875
KB,
4|] = E^' -
^rr'H'i +
A
^
?T
(27.194b)
r'
[îKfl, Cjtr]
=
— y^fej7'
—
ii^'lcf/t
+
A-pcL Take the complex conjugate
of
(27.194c)
L
'
J
^—' '
r
J-
the first two relations.
r'
[MB,
c
n
] = - Y^Tf ~
^rAcri
-
A
?
4
r
(27.194d)
r
Placing
the
expression
for c in
terms
of 7
into
any of
these four expressions,
one
finds that
the
results
are
consistent only
if
the minus signs
in
relations between
c
and
7
are chosen
as in
Eq. (27.192); matching terms
in 7
requires that
«/(^i
=
-E
J
.^-/4h(?)
+
«i(i
!
)A;.
KZI
-™
}
These coupled eigenvalue equations are the Bogohubov
equations.
The pair poten-
tial
A is
given
by
A,
= ^N
k
(ê
n
ê
7î
)
= Y
^ui(7)vf(r). (27.196)
1
Interaction with Electromagnetic Fields.
The
reason
to
pose
the
Bogohubov
equations in real space is that external potentials can be incorporated into the matrix
tjfi, which also contains kinetic energy
and
contains effects
of
interaction with
a
lattice
or
impurities.
For a
homogeneous system, with
no
external potential, they
reduce exactly
to
what appeared before
in
Eq. (27.168).
The
functions w/
and vi
are just plane waves:
U
T
^
=
u
k
e
~'
k
'
r
>
V
T
(^)
= v
k
e
~
lk
r
■
Identif
y
the
index
'
with
*•
(27.197)
Treating these solutions as the zero-order starting point, the Meissner effect emerges
from finding effects
of
a weak external vector potential. The calculation is
a
rather
elaborate exercise
in
perturbation theory.
As
the
vector potential turns
on, the
plane waves
are
altered only slightly,
so
the solutions
of
the perturbed problem can
be
indexed
by k,
which takes
the
place
of index
/.
The problem
to be
solved
is
H{7)h=
\é,(-
iH
^
+ e
4)
-^}u
ï
(7)+v
l
(r)A
7
(27.198a)
Let
**&%
= -
<
im (^
+
T)
-^K(?)
+
"*(?)AÏ. (27.198b)
u
%
(r)
= uf{r) + if{r) =
up-** +
^ e~
ik
^ufik') (27.199a)
k'
vffl
= v?\r)
+
v£\r) =
^
k
e'
ilrr
+
Y
e~
il
''
7
v^(k'). (27.199b)
876 Chapter 27. Superconductivity
Treating
the
vector potential
as
small,
and
collecting terms
to
first order,
one has
(
£
*-ä
V2
-^(
?
)"
A
^VH-|^
(A-V +
V-Â),f(r) (27.200a)
(^
+
^V
2
+
M)
M
i
1)
(r)-A,f (r)
= -|^
(Â-V
+
V-A)
ufir).
(27.200b)
In order
to
write down
Eqs.
(27.200), some technical problems have
to be
solved.
The
first
is
that
the
energy
£^
=
£i
0)
+
£1°
might change
to
first
or-
der
in A, but
a
change
was not
included. Problem
6
shows that
£j '
vanishes
so
long
as V
-A
=
0. In
addition,
A? has
been replaced
by the
constant
A,
although
A?
=
A
(0)
+
Al° should
in
principle acquire
a
spatially varying contribution
at
first
order.
The
demonstration
is not
straightforward,
but Ai
0
=
0 so
long
as the
vector
potential
is
restricted
to the
London gauge,
V
• A
=
0. It is
unfortunately
not
easy
to carry
out the
full calculation
in a
fashion that
is
manifestly gauge-invariant.
Substituting Eqs. (27.199) into Eqs. (27.200)
and
integrating
by
/
dr
exp[ik'
•
r]/V, one
finds
(fiï
+
C*) v^Ck')-A*u^(k')
=
F
irk
vLV
(27.201a)
(£ï-C*)
u^(k')-Av^Ck')
=
F
n
uf,
(27.201b)
with
the
unperturbed single-particle energies
Ci
=
eh
h
2
k
2
2m
r
dr'
Jk
v
s
i
and
fi, sothat£r
=
,/C^
+
|A|
2
,
(27.202)
^
=
"^
/ T
^-
k)
*$ +
*)
-W)
=
F
h-
<
27
-
203
)
One
can
immediately find
the
explicit expressions
T^) = ?2f7r (k-Cï'H
+
^i
*î
(27.204a)
«Ï
(*
)
=
^i
[(k+d>H+
AV
Ï\
■
(
27
-
204b
)
The perturbation theory
is now
finished,
but
there remains
the
task
of
finding
the
change
in
physical quantities
of
interest.
27.3.6 Derivation
of
Meissner Effect
To
see
whether
the
quantum wave function exhibits
the
Meissner effect,
one
must
look
at
the response
of
the current
to
the vector potential.
If
the current has
a
linear
response, then
the
material
is
superconducting.
The
current
is
N
k
:
A IP eA
The factor
of
2
is for
spin,
and the
factor
9« -Re/c*
I I-— I r- \
ofNj/V accounts forthe fact that there
are (97 205^
V
\
r
'
\ m tnc I I
Nk
values
of
k, hence
JV*
values
of
7 which
occupy
a
total volume
V, so
each
r
is
associated with
a
volume
V/A^.
Microscopic Theory of Superconductivity
877
P eA*
V
kk'
+C.C.
E<
{wH,
+v
*m) L
+
-J
(
u
^%
+v
ml)
V
E^('
W eA
—
H
im mc
(27.206)
The only term that does not annihilate
V*{j)+C.C.
the ground state is 77t. (27.207)
Note that
1 £- -
C-
Y^ v^v* = - Y^ ——— = •
/v
/
2
>
Com
P
aie
with
E
i
s
-
(
27J45
>
and
(27-173).
(27.208)
* I '*
so the current becomes
ne
l
A
J =
J
mc
n is the total density of electrons.
where
71
V — im
K
k
(27.209)
(27.210)
j requires further evaluation. To first order in A,
f
eft.
Vm
Y,vi
v
l*^
C
k
+
*') ^-
%yf
+ v:
k
v^\V) (k + k')
e'^'-
%
>
7
.
kk'
(27.211)
Substituting the expression for vi
'
(Ic)
obtained in
Eq.
(27.204) and using
Eq.
(27.173)
gives that
A Jii-k'Yr
F
l'k
-^ —eft
•
s
—^
kk
1
+
-eft
(k + k') e«-^
(k + k')
-i(k-k')
£
2
-£
2
c
k
c
l<
:'W k'k
El-El
k
k>
Et-ÇA , A* A
Jc
^k
2£
l
+
2E
k
£t-Cï\ . AA*
+
•
^k J ih
(27.212)
V) Yl (*
+
*0
et{k
~
k
'
yrF
k'k
L
^V &)> Interchanging I and V in the (27.213)
m V _„ \ ' second half of the right-hand side
kk and doing a moderate amount of
algebra.
where
4Ci. CP) =
h%-<*<*-***
(27.214)
Because L depends upon the absolute value of k and k' only through the energies
C^,
one can do the angular integrals over k and k'. Define
^(C,C
,
,^
= ^(f)
2
i:*(Cï-C)^-0(*a+*'a)(*/
S
+ *'/
î
)^-
ï
'
)
-
A
.
kk'
(27.215)
878
Chapter 27. Superconductivity
Then expanding out
Fy-^
using Eq. (27.203) gives
The conductivity a can be evaluated by defining
1 _ .j. D{£.
F
)smJ2m(/H
2
r
V
Ikpr
(27.217)
Evaluate energy and wave vector at the Fermi surface, because this is the only
place where the coherence factor L(Ç, £') is much different from zero.
so that
2-KH
/eh\
2
S S
2=0
(C-CO*
hvp
2 \m J da
a
daß
sse
—DIEF)—T~
cos
2TT
K
' R
4
In taking the derivatives with respect to a
a
or aß, keep only the largest powers
of kpR, which is much larger than 1 for most important values of R.
Therefore, the first contribution to the current can now be written
(27.218)
(27.219)
AW = £ /
dfSlßC-^Aßtf),
(27.220)
with
S
aß(
R
)
3ne
2
R
a
Rß
J
dc,
dCL((,
c')
cos
(C-C')R
(27.221)
4TT
2
mchvF R
4
The coherence length £ is conventionally defined for the microscopic model as
Hvf
t
=
TTA'
(27.222)
Upon evaluating the final integral in Eq. (27.221) (Problem 7) and summing both
terms in Eq. (27.209) the current is
U7) = J2 fdr'S
aß
(r-r')Aß(r')
ß
J
with
and
s«ß(S) =
M
R
-^'(«)
TT
J-
A-Kmci
R
4
1 f°° dy'
cosh y
- exp
2R
cosh y'
(27.223a)
(27.223b)
(27.223c)
Microscopic Theory of Superconductivity 879
When A varies slowly on the scale of the coherence length £, it can be taken out of
the spatial integral, and one finds that
2
-» —ne ->
j(r) = A(r). (27.224)
mc
If A does not vary slowly, Eq. (27.223a) describes averages of A over a ball the size
of the coherence length £.
In either case, the microscopic theory predicts perfect diamagnetism. For ex-
ample, operating with 4-7r/cVx on both sides of
Eq.
(27.224) reproduces the Lon-
don equation Eq. (27.5). More generally, the relation between current and vector
potential in Eq. (27.223) meets the conditions laid down in Section 27.2.1 for pro-
duction of the Meissner effect. The microscopic theory has predicted that super-
conductors will be perfect diamagnets, and it also shows how the coherence length
£ is related to the gap parameter A.
27.3.7 Comparison with Experiment
According to Bardeen, "In working out the properties of our simplified model and
comparing with experimental results on real metals, the excellent agreement ob-
tained was a continual source of amazement.... Everything fitted together neatly
like the pieces of
a
jigsaw puzzle. Accordingly, the scepticism with which the the-
ory was greeted in some quarters was surprising." [Bardeen (1963), p. 7]. The
resistance was rapidly conquered by several comparisons with experiment, includ-
ing specific heat and nuclear spin relation. The predictions of how these two effects
should vary with temperature was computed by methods similar to those used for
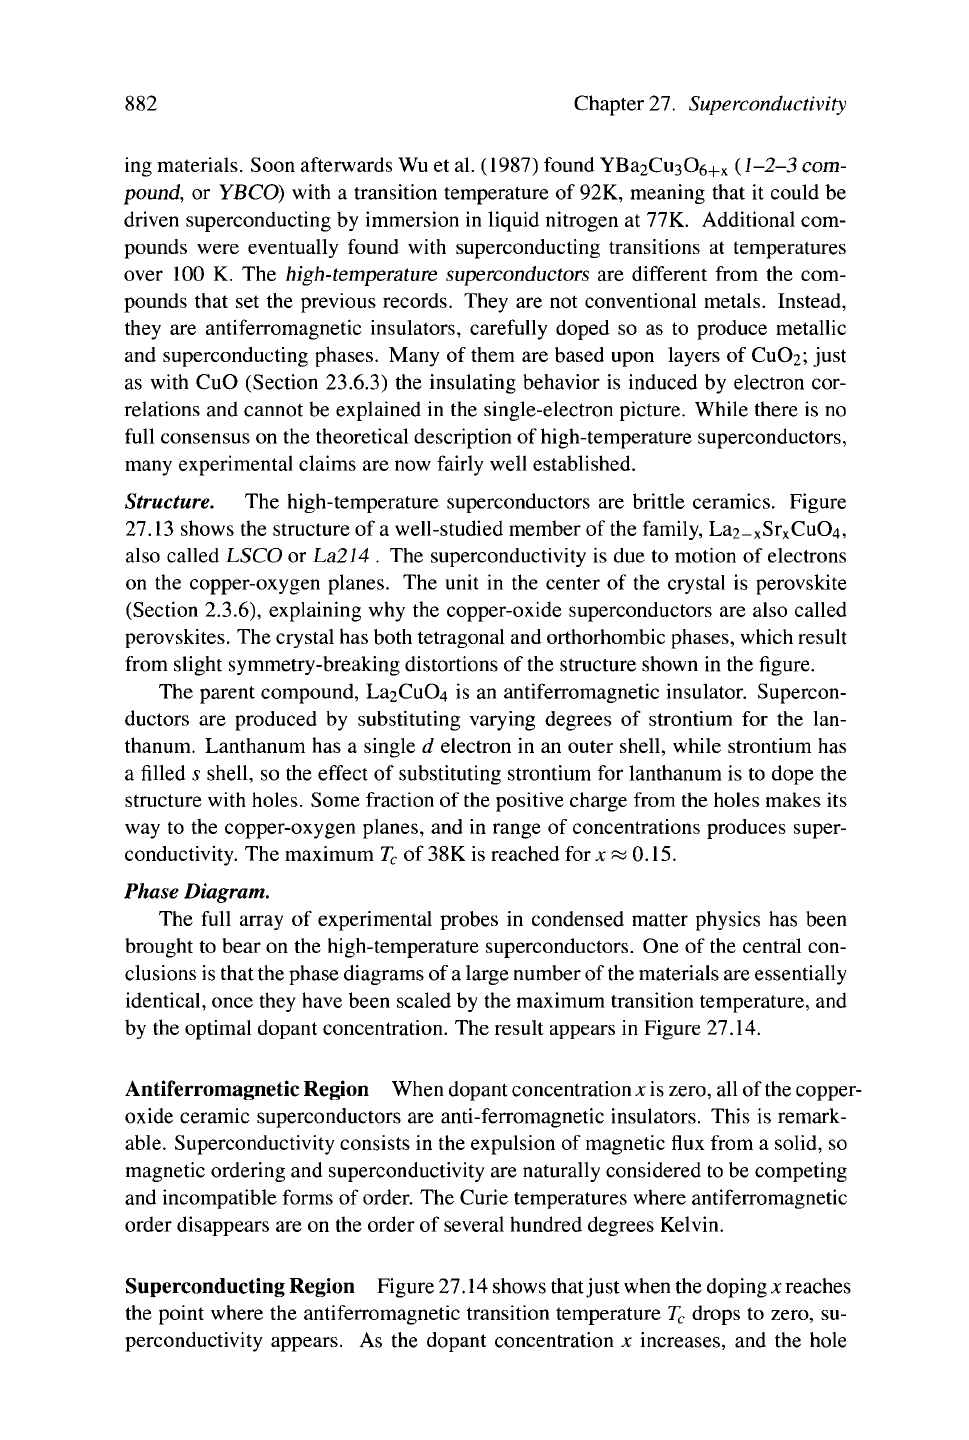
the Meissner effect. Specific heat is obtained by differentiating the expectation
value of the Hamiltonian with respect to temperature, while spin relaxation in-
volves the expectation value (ctcn. The forms of temperature dependence are
different below T
c
. Specific heat drops off rapidly as T drops below T
c
, while spin
relaxation at first rises when T goes down, eventually dropping to zero. These two
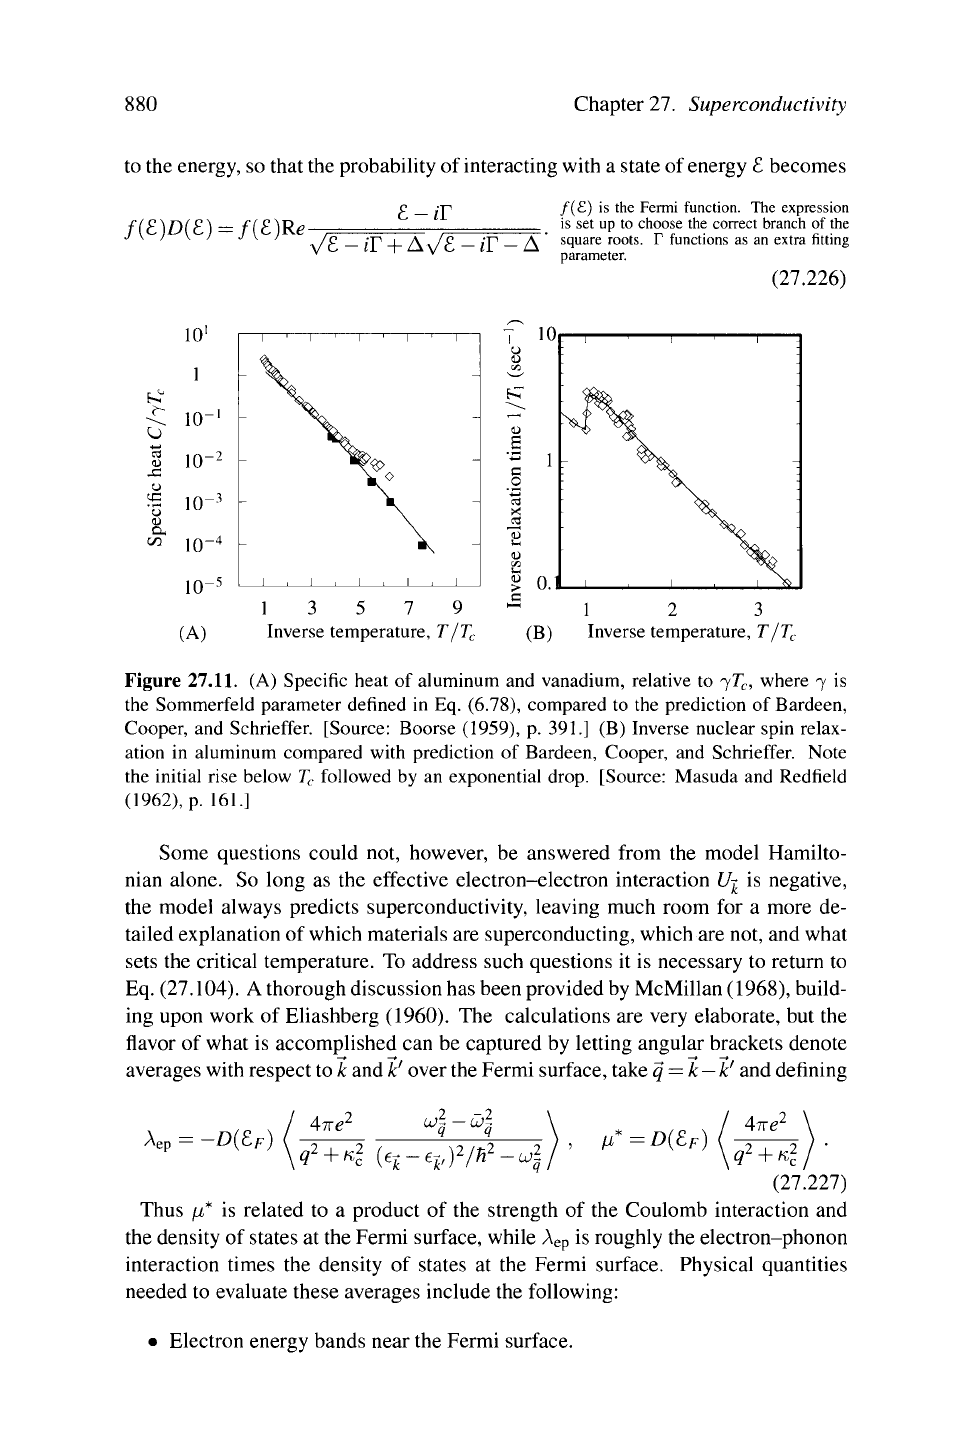
predictions were confirmed experimentally, as shown in Figure
27.11,
and played
a decisive role in confirming the correctness of the basic model.
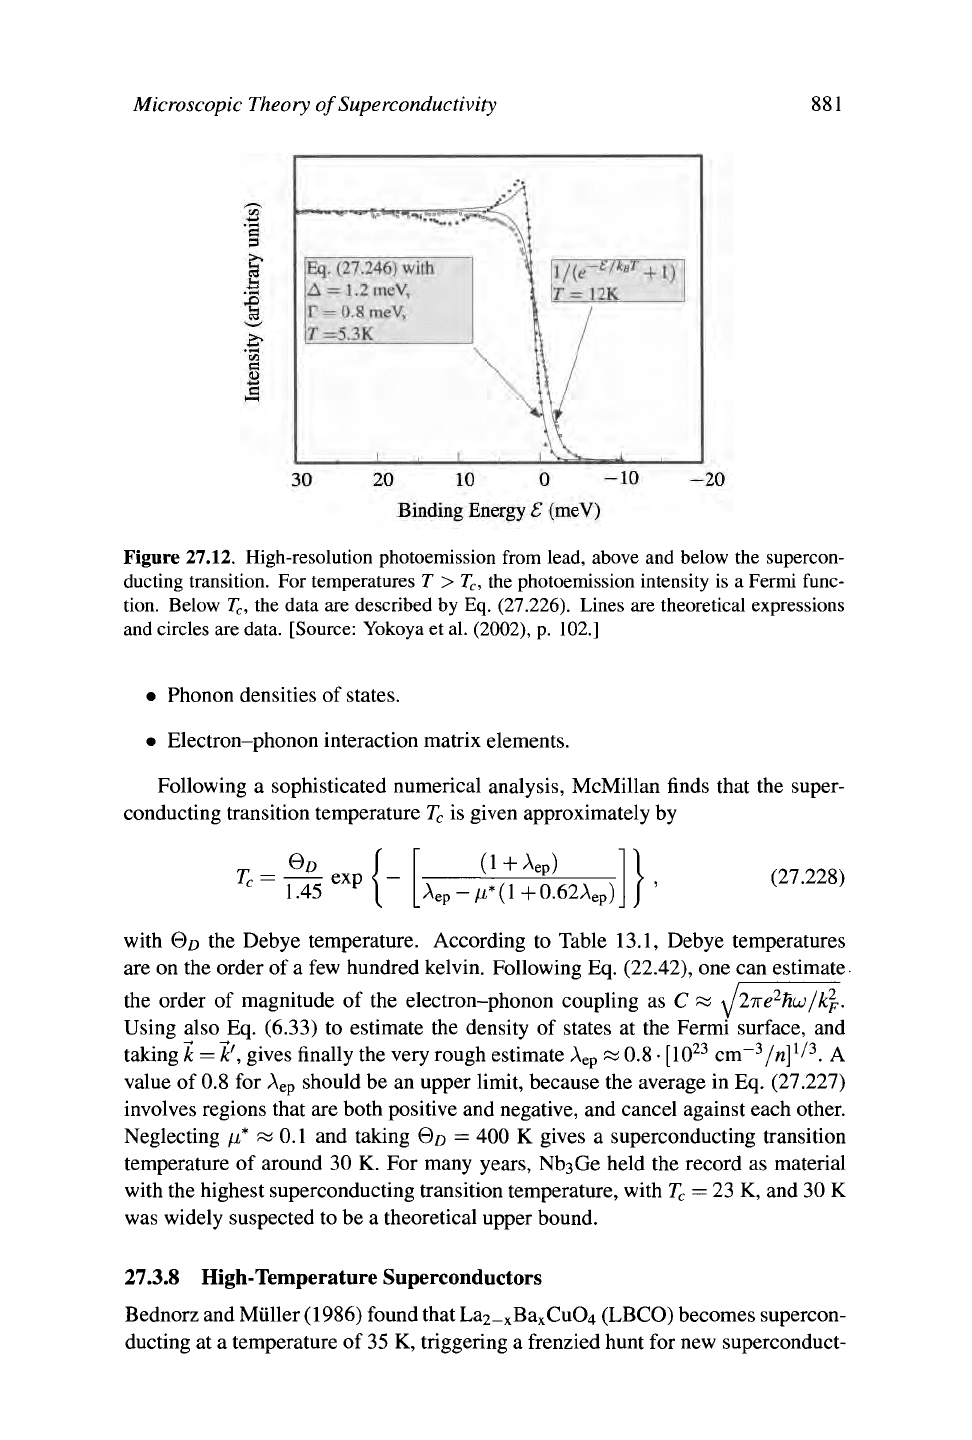
Improvements in photoemission have made it possible to observe directly changes
in the electron density of states due to the superconducting transition. The density
of electronic states in BCS theory should be
(27.225)
Eq. (27.225) predicts that the density of states vanishes completely within a range
±A around £
p.
This is not observed in photoemission experiments. Instead the
density of states is smeared out by the finite lifetime of excitations. Dynes et al.
(1978) proposed a simple modification of Eq. (27.225), adding an imaginary part
880 Chapter 27. Superconductivity
to the energy, so that the probability of interacting with a state of energy £ becomes
/(£)/>(£)=/(£)Re
£-iT
v/£-iT + AV£-»T-A'
/(£) is the Fermi function. The expression
is set up to choose the correct branch of the
square roots. T functions as an extra fitting
parameter.
(27.226)
«
10'
1
io-
S
io-
2
1-3
£
io-
C/5
10
-4
io~
5
(A)
j
i i i i i i i i
13 5 7 9
Inverse temperature, T/T
c
1 2 3
(B) Inverse temperature, T/T
c
Figure
27.11.
(A) Specific heat of aluminum and vanadium, relative to ^T
c
, where 7 is
the Sommerfeld parameter defined in Eq. (6.78), compared to the prediction of Bardeen,
Cooper, and Schrieffer. [Source: Boorse (1959), p. 391.] (B) Inverse nuclear spin relax-
ation in aluminum compared with prediction of Bardeen, Cooper, and Schrieffer. Note
the initial rise below T
c
followed by an exponential drop. [Source: Masuda and Redfield
(1962),
p. 161.]
Some questions could not, however, be answered from the model Hamilto-
nian alone. So long as the effective electron-electron interaction
U-^
is negative,
the model always predicts superconductivity, leaving much room for a more de-
tailed explanation of which materials are superconducting, which are not, and what
sets the critical temperature. To address such questions it is necessary to return to
Eq. (27.104). A thorough discussion has been provided by McMillan (1968), build-
ing upon work of Eliashberg (1960). The calculations are very elaborate, but the
flavor of what is accomplished can be captured by letting angular brackets denote
averages with respect to k and kf over the Fermi surface, take q = k
—
k' and defining
A
ep
-£>(£/
Ane
1
w^
-w~
*
2
+ «? (
e
--
ep
)2
/fi
2_ 2
/i*=D(£
F
)
Ane
1
rf
+
KÎ,
(27.227)
Thus //* is related to a product of the strength of the Coulomb interaction and
the density of states at the Fermi surface, while A
ep
is roughly the electron-phonon
interaction times the density of states at the Fermi surface. Physical quantities
needed to evaluate these averages include the following:
• Electron energy bands near the Fermi surface.
Microscopic Theory of Superconductivity 881
Figure 27.12. High-resolution photoemission from lead, above and below the supercon-
ducting transition. For temperatures T > T
c
, the photoemission intensity is a Fermi func-
tion. Below T
c
, the data are described by Eq. (27.226). Lines are theoretical expressions
and circles are data. [Source: Yokoya et
al.
(2002), p. 102.]
•
Phonon densities of states.
•
Electron-phonon interaction matrix elements.
Following a sophisticated numerical analysis, McMillan finds that the super-
conducting transition temperature T
c
is given approximately by
T °0 /
rc=
L45
eXP
{-
with
GD
the Debye temperature. According to Table 13.1, Debye temperatures
are on the order of a few hundred kelvin. Following Eq. (22.42), one can estimate
the order of magnitude of the electron-phonon coupling as C œ
J2-Ke
2
huj/kp.
Using also Eq. (6.33) to estimate the density of states at the Fermi surface, and
taking k = k!, gives finally the very rough estimate A
ep
~ 0.8
•
[10
23
cm
-3
/«]
1
/
3
.
A
value of 0.8 for A
ep
should be an upper limit, because the average in Eq. (27.227)
involves regions that are both positive and negative, and cancel against each other.
Neglecting p* f« 0.1 and taking Go = 400 K gives a superconducting transition
temperature of around 30 K. For many years, NbaGe held the record as material
with the highest superconducting transition temperature, with T
c
—
23 K, and 30 K
was widely suspected to be a theoretical upper bound.
27.3.8 High-Temperature Superconductors
Bednorz and Müller (1986) found that La2_
x
Ba
x
Cu04 (LBCO) becomes supercon-
ducting at a temperature of
35
K, triggering a frenzied hunt for new superconduct-
(1
+
A,
epy
Aep-M*(l+0.62A
e
p)
(27.228)
882 Chapter
27.
Superconductivity
ing materials. Soon afterwards Wu et al. (1987) found YBa2Cu306+
x
(1-2-3 com-
pound,
or YBCO) with a transition temperature of 92K, meaning that it could be
driven superconducting by immersion in liquid nitrogen at 77K. Additional com-
pounds were eventually found with superconducting transitions at temperatures
over 100 K. The high-temperature superconductors are different from the com-
pounds that set the previous records. They are not conventional metals. Instead,
they are antiferromagnetic insulators, carefully doped so as to produce metallic
and superconducting phases. Many of them are based upon layers of CuÛ2; just
as with CuO (Section 23.6.3) the insulating behavior is induced by electron cor-
relations and cannot be explained in the single-electron picture. While there is no
full consensus on the theoretical description of high-temperature superconductors,
many experimental claims are now fairly well established.
Structure. The high-temperature superconductors are brittle ceramics. Figure
27.13 shows the structure of a well-studied member of the family, La2-
x
Sr
x
CuC»4,
also called LSCO or La214 . The superconductivity is due to motion of electrons
on the copper-oxygen planes. The unit in the center of the crystal is perovskite
(Section 2.3.6), explaining why the copper-oxide superconductors are also called
perovskites. The crystal has both tetragonal and orthorhombic phases, which result
from slight symmetry-breaking distortions of the structure shown in the figure.
The parent compound, La2CuC>4 is an antiferromagnetic insulator. Supercon-
ductors are produced by substituting varying degrees of strontium for the lan-
thanum. Lanthanum has a single d electron in an outer shell, while strontium has
a filled s shell, so the effect of substituting strontium for lanthanum is to dope the
structure with holes. Some fraction of the positive charge from the holes makes its
way to the copper-oxygen planes, and in range of concentrations produces super-
conductivity. The maximum T
c
of 38K is reached for x ss 0.15.
Phase Diagram.
The full array of experimental probes in condensed matter physics has been
brought to bear on the high-temperature superconductors. One of the central con-
clusions is that the phase diagrams of
a
large number of
the
materials are essentially
identical, once they have been scaled by the maximum transition temperature, and
by the optimal dopant concentration. The result appears in Figure 27.14.
Antiferromagnetic Region When dopant concentration x is zero, all of the copper-
oxide ceramic superconductors are anti-ferromagnetic insulators. This is remark-
able.
Superconductivity consists in the expulsion of magnetic flux from a solid, so
magnetic ordering and superconductivity are naturally considered to be competing
and incompatible forms of order. The Curie temperatures where antiferromagnetic
order disappears are on the order of several hundred degrees Kelvin.
Superconducting Region Figure 27.14 shows that just when the doping x reaches
the point where the antiferromagnetic transition temperature T
c
drops to zero, su-
perconductivity appears. As the dopant concentration x increases, and the hole