Mench M.M. Fuel Cell Engines
Подождите немного. Документ загружается.

c06 JWPR067-Mench January 26, 2008 20:1 Char Count=
300 Polymer Electrolyte Fuel Cells
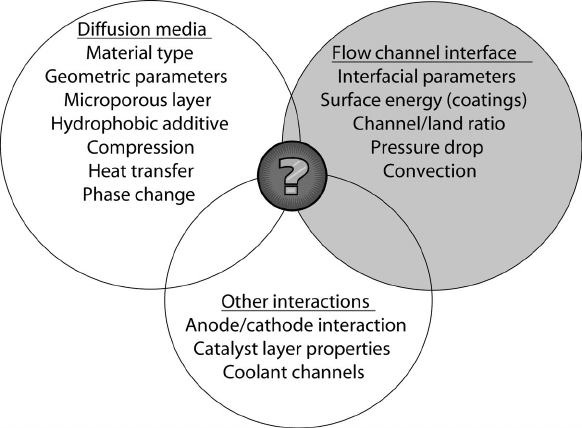
Figure 6.15 Schematic of complex interactions among fuel cell design, material, and operational
parameters that influence water distribution and flooding behavior. Flooding interactions and behavior
are not yet a complete science.
channels at low channel velocities. At higher current densities, where the gas-phase flow
in the channels is sufficiently high to remove most slug formations, flooding is more likely
to occur in the cathode catalyst layer or DM.
Flooding can be a result of channel design, operating conditions, or material properties.
In fact, a complex interaction between many design, operational, and material parameters
exists, as summarized in Figure 6.15. A fuel cell that floods at a given condition may not
flood with slightly different operating conditions, a different DM or microporous layer, or
a modification to the channel design.
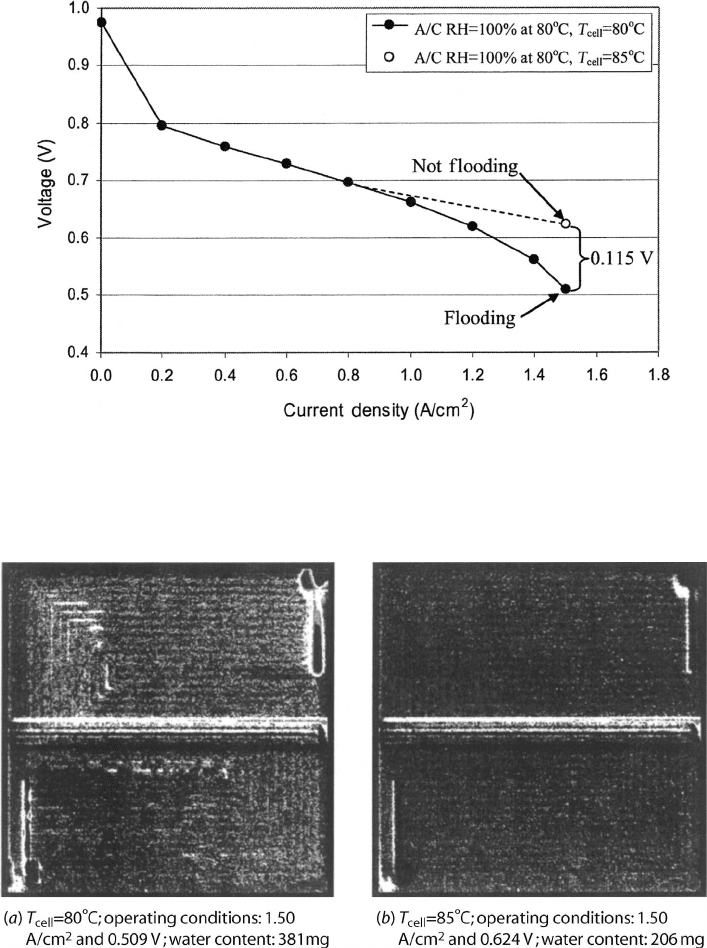
A fuel cell polarization curve, with and without flooding losses, is shown in Figure
6.16. In this figure, a polarization curve for a single 50-cm
2
fuel cell was taken at 80
◦
C,
where significant flooding losses were observed at 1.5 A/cm
2
. From this point, the operating
temperature of the fuel cell was increased to 85
◦
C to eliminate the flooding. The perfor-
mance at 80
◦
C was 141 mV lower than at 85
◦
C, where more of the water was vaporized.
The flooded cell had a total of 381 mg (∼7.6 mg/cm
2
) of liquid water, while the dry cell
had only 206 mg (∼4 mg/cm
2
) of liquid water [10].
A side-by-side comparison of the liquid water distribution in this fuel cell is shown
in Figure 6.17. Interestingly, a significant amount of water exists even in a nonflooded
state, stored in the pores of the DM, electrolyte, and catalyst layer and in the channels. The
difference of only a few milligrams of water per square centimeter active area can have
a significant impact of performance [10]. From a study of flooding and water content, it
has been deduced that simple pore flooding blockage in the DM is not alone responsible
for the voltage drop seen, and some film resistance is required to account for the observed
voltage loss.
c06 JWPR067-Mench January 26, 2008 20:1 Char Count=
6.2 Water Balance in PEFC 301
Figure 6.16 Polarization curve for PEFC with and without flooding losses; the only difference in
the operating conditions is the fuel cell temperature. Between 80 and 85
◦
C, there is 115 mV difference
in performance directly attributable to flooding. (Adapted from Ref. [10].)
Figure 6.17 Side-by-side comparison of (a) flooded and (b) unflooded liquid water distribution.
Images are taken using neutron imaging technology. The brighter areas represent liquid water ac-
cumulations. Upon close inspection, the flow pattern in the fuel cell is visible. This is a result
of accumulation of liquid water under the lands, where there is typically a high liquid saturation.
(Adapted from Ref. [10].)
c06 JWPR067-Mench January 26, 2008 20:1 Char Count=
302 Polymer Electrolyte Fuel Cells
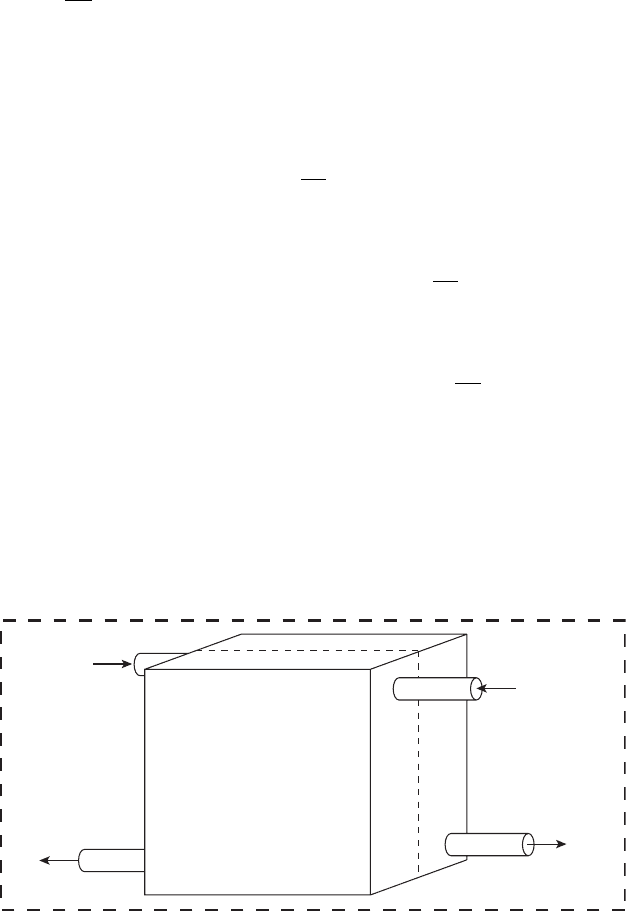
6.2.1 Overall Water Balance: Fuel Cell Mass Balance
Although flooding is a localized phenomenon, for a fuel cell to operate at steady state, an
overall state of water balance must be achieved. Consider a control volume mass balance
of the water in a single fuel cell, illustrated in Figure 6.18.
From a conservation of mass on the water, we can show that
dm
dt
cv
=
(
˙
m
in
−
˙
m
out
)
H
2
O,anode
+
(
˙
m
in
−
˙
m
out
)
H
2
O,cathode
+
˙
m
gen
(6.3)
The term on the left-hand side of Eq. (6.3) represents the time rate of change in the water
mass in the fuel cell. The two sets of terms in parentheses on the right-hand side of Eq.
(6.3) represent the net water flow out of the fuel cell on the anode and cathode, respectively.
The generation rate of water (from Faraday’s law) is given as
˙
m
gen
=
iA
2F
MW
H
2
O
(6.4)
Therefore, to achieve water balance in steady state,
(
˙
m
out
−
˙
m
in
)
H
2
O,a
+
(
˙
m
out
−
˙
m
in
)
H
2
O,c
=
iA
2F
MW
H
2
O
(6.5)
In terms of the steady-state molar mass balance,
(
˙
n
out
−
˙
n
in
)
H
2
O,a
+
(
˙
n
out
−
˙
n
in
)
H
2
O,c
=
iA
2F
(6.6)
The net outlet flow can contain slugs of liquid, flow of capillary films into the manifold and
humidified gas, that is,
˙
n
out,H
2
O
=
˙
n
out,a
+
˙
n
out,c
liquid
+
˙
n
out,a
+
˙
n
out,c
gas
(6.7)
If we assume the slugs and capillary flow of liquid water at the exit are insignificant (which
may not be the case in a flooded condition), we can solve for the steady-state water balance.
Anode in
Cathode out
Anode out
Cathode in
CV
Figure 6.18 Basic control volume of fuel cell.

c06 JWPR067-Mench January 26, 2008 20:1 Char Count=
6.2 Water Balance in PEFC 303
From the material in Chapter 3, we can derive an expression for water vapor carried by the
flow:
RH =
y
H
2
O
P
P
sat
(T )
=
P
v
P
sat
(T )
(6.8)
P
v,H
2
O
= y
v,H
2
O
P =
n
v,H
2
O
n
v,H
2
O
+ n
others
P =
˙
n
v,H
2
O
˙
n
v,H
2
O
+
˙
n
others
P (6.9)
where
˙
n
others
represents the molar flow rate of anything but vapor (reactant and inert gas)
and P is the total gas-phase pressure. For the incoming flow,
˙
n
others,in
=
λ
reactant,in
y
reactant,in,dry
iA
nF
(6.10)
Here, y
reactant,in,dry
is the mole fraction of reactant in the incoming flow on a dry, nonhumid-
ified basis. For air, y
O
2
,in,dry
= 0.21. After humidification, the mole fraction of oxygen in
the air will be something less, but the dry value is used in Eq. (6.10). The consumption of
reactant is simply iA/nF. If we neglect the crossover and leakage, which are typically small
relative to the overall flow rate, the outgoing flow of nonwater species is
˙
n
others,out
=
iA
nF
λ
reactant,in
y
reactant,in,dry
− 1
(6.11)
Rearranging Eqs. (6.8) and (6.9):
˙
n
v,H
2
O
=
˙
n
others
[RH · P
sat
(T )/P]
1 − RH · P
sat
(T )/P
(6.12)
which is appropriate for inlet and exit flows, providing the RH and total pressures at the
appropriate locations are used. Solving for the net water out of the anode and cathode sides
and including liquid water slugs and film flow out of the cell, the net molar flow rate of
water out of the cathode is
˙
n
out,c
−
˙
n
in,c
H
2
O
=
˙
n
slugs,out,c
+
iA
4F
λ
O
2
y
O
2
,in,dry
− 1
RH
out,c
·P
sat
(
T
out
)
P
out,c
1 −
RH
out,c
·P
sat
(
T
out
)
P
out,c
−
λ
O
2
y
O
2
,in,dry
iA
4F
RH
in,c
·P
sat
(
T
in
)
P
in,c
1 −
RH
in,c
·P
sat
(
T
in
)
P
in,c
(6.13)
and for the anode, the net water flux out is
˙
n
out,a
−
˙
n
in,a
H
2
O
=
˙
n
slugs,out,a
+
iA
2F
λ
H
2
y
H
2
,in,dry
− 1
RH
out,a
·P
sat
(
T
out
)
P
out,a
1 −
RH
out,a
·P
sat
(
T
out
)
P
out,a
−
λ
H
2
y
H
2
,in,dry
iA
2F
RH
in,a
·P
sat
(
T
in
)
P
in,a
1 −
RH
in,a
·P
sat
(
T
in
)
P
in,a
(6.14)

c06 JWPR067-Mench January 26, 2008 20:1 Char Count=
304 Polymer Electrolyte Fuel Cells
Letting χ = RH · P
sat
(T )/P we can show that
iA
4F
λ
O
2
y
O
2
,in,dry
− 1
χ
out,c
1 − χ
out,c
−
λ
O
2
y
O
2
,in,dry
iA
4F
χ
in,c
1 − χ
in,c
+
iA
2F
λ
H
2
y
H
2
,in,dry
− 1
χ
out,a
1 − χ
out,a
−
λ
H
2
y
H
2
,in,dry
iA
2F
χ
in,a
1 − χ
in,a
+
˙
n
slugs,out,a
+
˙
n
slugs,out,c
=
iA
2F
(6.15)
Surprisingly, if the stoichiometry is constant and there are no liquid slugs out of the cell, we
can cancel out iA/2F from each term, eliminating current from the overall gas-phase water
balance. This is because the water generation and the stoichiometry both scale directly with
current. For the general case with liquid water slugs, we can show that in steady state
λ
O
2
y
O
2
,in,dry
− 1
χ
out,c
2
1 − χ
out,c
−
λ
O
2
y
O
2
,in,dry
χ
in,c
2
1 − χ
in,c
+
λ
H
2
y
H
2
,in,dry
− 1
χ
out,a
1 − χ
out,a
−
λ
H
2
y
H
2
,in,dry
χ
in,a
1 − χ
in,a
+
˙
n
slugs,out,a
+
˙
n
slugs,out,c
iA
2F
= 1 (6.16)
and without liquid flow that
λ
O
2
y
O
2
,in,dry
− 1
χ
out,c
2
1 − χ
out,c
−
λ
O
2
y
O
2
,in,dry
χ
in,c
2
1 − χ
in,c
+
λ
H
2
y
H
2
,in,dry
− 1
χ
out,a
1 − χ
out,a
−
λ
H
2
y
H
2
,in,dry
χ
in,a
1 − χ
in,a
= 1
(6.17)
This convenient reduction occurs for constant-stoichiometry operation only, since the flow
rate and generation are both linearly proportional to current and thus cancel each other out.
In a general transient case, there would also be a mass storage/depletion term in Eq. (6.17).
There are some possible simplifications to Eq. (6.16):
1. Zero Liquid Water Out This is appropriate for relatively dry conditions with little
or no continuous flooding, where there will not be any liquid slugs liquid films, or
liquid entrained as a mist in the reactant flow. Equation (6.16) reduces to Eq. (6.17),
eliminating the current dependency and the liquid water term.
2. Zero Net Drag This assumes there is no net flux of water from the anode to
cathode. The modes of water transport in the electrolyte are discussed in detail later
in this chapter. This assumption uncouples the anode and cathode flows and is most
appropriate for very thin electrolytes with a fully humidified anode and isothermal
conditions. In this case, all the water uptake to balance the generated water must
come from the cathode flow.
3. Isothermal This assumes the inlet and outlets are at the same temperature and thus
the saturation pressure is constant. This approximation is most valid at low power
or with a very high coolant flow rate.
4. Viscous Drag Dominates Pressure Loss In lieu of experimental data, the
Hagen–Poiseuille relationship in Chapter 5 can be used to estimate anticipated
pressure drop from inlet to outlet, although minor losses, species consumption, and
water uptake will also affect the pressure drop.

c06 JWPR067-Mench January 26, 2008 20:1 Char Count=
6.2 Water Balance in PEFC 305
5. Full Humidity Saturation at Exit Although the flow at the exit of a flow channel is
not necessarily fully humidified, if the flow field is long and the initial conditions are
not overly dry, an exit RH = 1 can be used as a simplifying assumption in the initial
analysis.
An overall water balance can be achieved in practice through a variety of methods.
Looking at the parameters we can control in Eq. (6.16), there are several possibilities:
1. Control of the inlet RH and stoichiometry of the reactants to exactly remove the
water generated by reaction. This approach can lead to local drying at the inlet and
potentially accelerate degradation, however [11].
2. Engineer the temperature gradient through the fuel cell by coolant flow rate and
channel design. If the coolant flow rate and channel design are such that the flow
channel temperature increases from the inlet to the outlet, the increase in temperature
can be used to absorb the excess moisture generated into the gas phase by the
increasing saturation pressure. This is a common method of moisture control in
larger stacks, where around 10–15
◦
C variation in coolant temperature from inlet to
outlet is achievable at high current just from excess heat removal requirements.
3. Engineering the pressure gradient through the fuel cell flow field design. From Eq.
(6.8), as the total pressure is decreased at a given temperature, the mole fraction of
vapor allowable in the gas phase at a given RH increases. That is, lower pressure
flow holds a greater amount of water. This approach is more difficult to achieve
in practice than temperature gradient or RH control and generally only works at a
given operating point, since the velocity and pressure drop will change as a function
of current. Also, intentionally engineering a high pressure drop in the flow channels
results in undesirable parasitic losses.
While achieving an overall water balance in a PEFC will generally improve performance
compared to a highly flooded or dry condition, the liquid water distribution in a PEFC
is generally highly nonuniform, and small accumulations or areas of drying can result in
substantially reduced performance and durability.
Example 6.2 Calculating the Global Water Balance
(a) Calculate the net rate of water vapor uptake into an air cathode flow at the given
conditions for a 250-cm
2
fuel cell operating at 1.2 A/cm
2
. Compare the cathode
uptake to the water generation. What drying rate would the anode have to share to
obtain a steady-state global balance?
(b) Determine the cathode exit temperature that would achieve a global balance, as-
suming all uptake occurs in the cathode and there are no water slugs at this balanced
condition.
Cathode Condition Inlet Outlet
RH 0.25 1.0
Temperature 78
◦
C80
◦
C
Pressure 3.2 atm 2.7 atm
Stoichiometry 2.0 —

c06 JWPR067-Mench January 26, 2008 20:1 Char Count=
306 Polymer Electrolyte Fuel Cells
SOLUTION
(a) Since we are assuming all uptake at the cathode,
˙
n
out,c
−
˙
n
in,c
H
2
O
=
iA
4F
λ
O
2
y
O
2
,in,dry
− 1
RH
out,c
·P
sat
(
T
out
)
P
out,c
1 −
RH
out,c
·P
sat
(
T
out
)
P
out,c
−
λ
O
2
y
O
2
,in,dry
iA
4F
RH
in,c
·P
sat
(
T
in
)
P
in,c
1 −
RH
in,c
·P
sat
(
T
in
)
P
in,c
From Chapter 3 P
sat
(T)(Pa)=−2846.4 + 411.24 T(
◦
C) − 10.554 T(
◦
C)
2
+
0.16636 T(
◦
C)
3
. Plugging in P
sat
(78) = 43,966 Pa and P
sat
(80) = 47,684 Pa
results in
˙
n
out,c
−
˙
n
in,c
H
2
O
=
1.2×250
4×96,485
2.0
0.21
− 1
1×47,684
273,577
1 −
1.0×47,684
273,577
−
2.0
0.21
1.2×250
4×96,485
0.25×43,966
324,240
1 −
0.25×43,966
324,240
= 0.001399 mol/s
The water generation rate at these conditions is
˙
n
H
2
O
=
iA
2F
= 0.00155 mol/s
So in order to reach a steady-state gas-phase water balance, the anode would have
to uptake 0.00151 mol/s of water, or the cell would accumulate water with time.
(b) To determine the cathode exit temperature that would exactly balance the water
generated, we rearrange Eq. (6.17), assuming no net uptake from the anode side
and no liquid ejection:
λ
O
2
y
O
2
,in,dry
− 1
χ
out,c
2
1 − χ
out,c
−
λ
O
2
y
O
2
,in,dry
χ
in,c
2
1 − χ
in,c
= 1
where χ = RH · P
sat
(T )/P.
All of the conditions are known except the P
sat
(T) at the exit. To solve this
problem by hand, solve for the exit saturation pressure from this equation as the
only unknown and then use the saturation pressure relationship to solve for the
proper temperature. Otherwise, a computer program can easily be generated to
iteratively solve for the solution. When the exit temperature is ∼ 85.4
◦
C, the
steady-state water balance is approximately achieved.
COMMENTS: Although we assume all the water uptake occurs at the cathode, there can
be some net transport of water across the membrane, as discussed later in this section. There
will be some pressure drop in the anode due to viscous losses and reactant consumption
which will result in uptake into the anode flow.
Transient Operation It should now be obvious to the reader that, to obtain perfect water
balance, very precise temperature, flow rate, pressure, and humidity control are needed.
During normal operation, the transient term in Eq. (6.3) is usually nonnegligible. In molar

c06 JWPR067-Mench January 26, 2008 20:1 Char Count=
6.2 Water Balance in PEFC 307
terms, the mass balance becomes
dn
dt
cv
=
˙
n
in,a
−
˙
n
out,a
H
2
O
+
˙
n
in,c
−
˙
n
out,c
H
2
O
+
I
(
t
)
2F
(6.18)
In this expression, the total cell current is left as a function of time, and the water out of the
anode and cathode represents the gas- and liquid-phase contributions. During operational
transients, the stored water in the porous DM, catalysts, and flow channels is depleted or
increased and a new equilibrium is reached.
Overall, during operation we can have three possible global water balance conditions:
dn
dt
cv
> 0
This represents an accumulation of water mass in the fuel cell media and flow channels.
Eventually, this excess must be removed or performance will suffer via flooding. A drying
condition is reached when
dn
dt
cv
< 0
This is a state of water depletion, or drying of the fuel cell. Liquid stored in the electrolyte,
DM, catalyst layer, and channels will be depleted with time. Eventually, this condition will
result in a dryout of the membrane and greatly reduced performance. A net balance is, of
course,
dn
dt
cv
= 0
This is the ideal state of a water balance represented by Eq. (6.16). If the fuel cell is
operating in a net flooded or drying condition, the fuel cell will adjust over time until a
new global balance is reached. During operation or after load changes, it is actually rare to
be at an exact water balance condition, and the fuel cell is generally operated in a slightly
flooding or drying condition until a new equilibrium adjustment is reached.
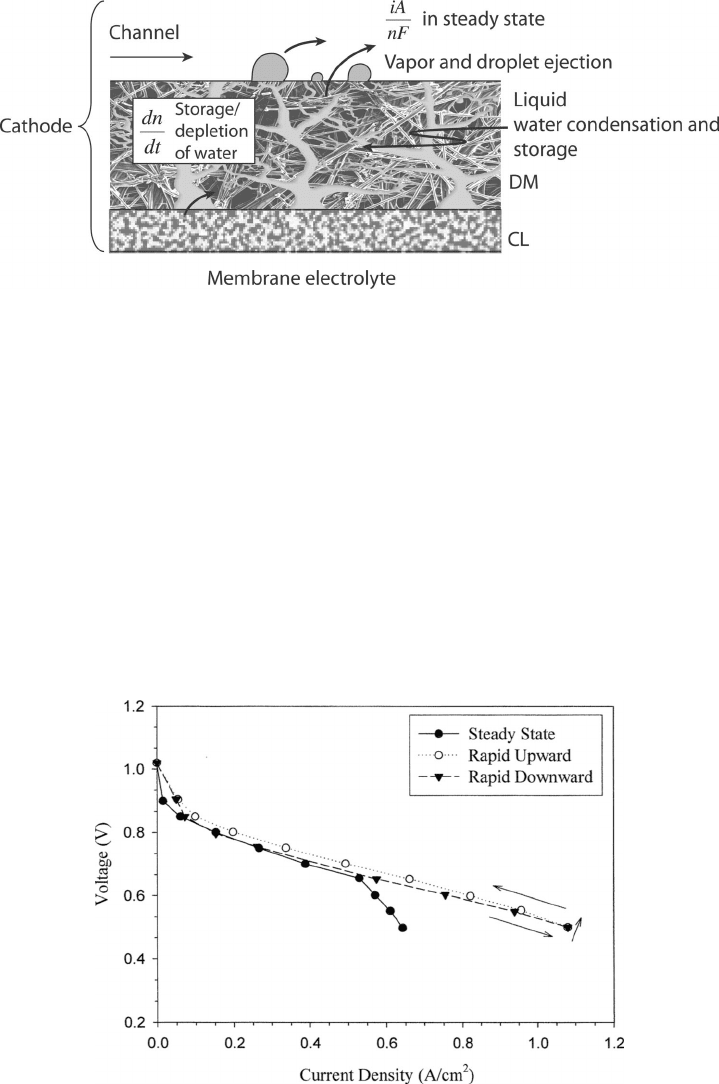
Flooding Condition Adjustment When the water balance is accumulating liquid water
mass, a periodic ejection of droplets can maintain the water balance in the fuel cell since
the liquid droplers are so dense compared to gas phase ejection. An illustration of the
process of water buildup and ejection from the DM is shown in Figure 6.19. In the steady
state, the water from generation must be exactly balanced by that removed. Although water
droplet ejection is a periodic process, a H
2
PEFC can be operated in a net flooding condition
and still achieve relatively stable performance with periodic ejection. If the liquid water
accumulation restricts gas-phase flow to the catalyst surface, performance instability will
occur, however, until a new equilibrium is achieved.
Drying Condition Adjustment When the fuel cell is operated in a net drying condition,
the stored water content in the membrane, porous media, and channels will decrease until
a new balance is achieved. In general, the outlet relative humidity of the low streams will
adjust themselves, and any dryout of the membrane will result in reduced performance.
c06 JWPR067-Mench January 26, 2008 20:1 Char Count=
308 Polymer Electrolyte Fuel Cells
Figure 6.19 Process of water buildup and ejection from diffusion media during operation.
Memory Effect The process of water balance adjustment involves liquid water accumu-
lation or depletion in pores, capillary flow through the DM, condensation, evaporation, and
gas-phase mass transfer. The liquid-phase adjustment has a much longer time scale than
gas-phase flow adjustment. This mixed time scale can result in a so-called memory effect.
Figure 6.20 is an example of this—a polarization curve that was taken for conditions of an
underhumidified anode and cathode inlet flow. The rapid downward polarization curve was
obtained by starting at open-circuit conditions and reducing voltage in 0.05-V increments
at 10-s intervals. After 20 s dwell time at 0.5 V, the rapid upward polarization curve was
obtained by increasing the voltage in 0.05-V increments at 10-s intervals. The upward po-
larization performance is slightly better than the downward scan, since the water generated
at the 0.5-V conditions self-humidified the membrane before the upward polarization scan.
The steady-state polarization curve was obtained by waiting until sufficient time had passed
Figure 6.20 Polarization curves taken for H
2
PEFC. Anode/cathode: RH is 0/50% at 80
◦
C, pressure
3/3 atm, λ
a
/λ
c
= 1.2/2.5.

c06 JWPR067-Mench January 26, 2008 20:1 Char Count=
6.2 Water Balance in PEFC 309
for a true steady state to be achieved at each voltage (sometimes >30 min per data point).
At high voltage, the three performance curves are very similar. But at lower voltages, due
to some liquid accumulation, the steady-state polarization curve is much lower than the
other two. Because the time scale of liquid water accumulation and motion is on the order
of minutes while that of gas-phase transport is on the order of seconds, the performance
at a given state is a function of the previous recent history of the fuel cell. This effect can
complicate transient performance and control in stacks.
As discussed, one of the matters complicating operation and control of PEFCs is the
time-scale difference between liquid- and gas-phase water accumulation and motion. While
observed liquid slug velocities in the channel are lower than gas-phase velocities, they are
usually of similar magnitudes. However, the time scale for liquid buildup and drying from
the gas DM and of water uptake and loss from the electrolyte can be very slow. Consider
the time scale for 1 mg/cm
2
to accumulate in the DM, an amount of liquid likely to begin
to restrict flow and reduce performance [10]. The time the fuel cell takes to generate that
amount of water can be found from Faraday’s law. For 1 A/cm
2
, it takes around 11 s to
accumulate this amount of water; for 0.2 A/cm
2
, it takes nearly a minute (see Example 6.3).
Thus, the time scale of liquid accumulation is on the order of a minute, while the time scale
of gas-phase transport can be calculated as
τ =
l
2
D
≈
(
0.04
)
2
0.1
cm
2
cm
2
/s
= 16 ms (6.19)
where a typical gas-phase diffusion coefficient of 0.1 cm
2
/s was used and 400 µm represents
a typical distance from the gas channel to the catalyst layer. From this result, the gas-phase
transport is extremely rapid.
Water uptake into the electrolyte also has a relatively long time scale that depends on
the temperature, partial vapor pressure, and initial membrane state but can also be on the
order of minutes or even hours. Ionic conductivity, water diffusivity in the electrolyte, and
electro-osmotic drag are directly related to the electrolyte water uptake, which can also
contribute to the observed performance memory effect and hysteresis.
Example 6.3 Time Scale for Liquid Water Accumulation in PEFC Calculate the ap-
proximate time required for 1 mg/cm
2
liquid water to accumulate in a fuel cell at 0.2 and
1.0 A/cm
2
, assuming all the water generated remains in the liquid phase.
SOLUTION A rough calculation can be done to show the time scale needed to see a
buildup from water generation of a significant amount of water in the cell from Faraday’s
law:
t =
n
H
2
O
˙
n
H
2
O
=
m
H
2
O
MW
H
2
O
nF
iA
t
i = 0.2A/cm
2
=
1mg/cm
2
18 g/mol
2e
−
eq/mol
96,485 C/e
−
eq
0.2A/cm
2
(
1g/1000 mg
)
≈ 53
s
t
i = 1.0A/cm
2
=
1mg/cm
2
18 g/mol
2e
−
eq/mol
96,485 C/e
−
eq
1.0A/cm
2
(
1g/1000 mg
)
≈ 11
s
Only on the order-of-minutes time frame allows liquid water accumulation.