Schmuller J. Statistical Analysis with Excel For Dummies
Подождите немного. Документ загружается.

209
Chapter 11: Two-Sample Hypothesis Testing
Suppose FarKlempt Robotics produces 10 parts with Machine 1 and finds a
sample variance of .60 square inches. They produce 15 parts with Machine 2
and find a sample variance of .44 square inches. Can they reject H
0
?
Calculating the test statistic,
The df’s are 9 and 14: The variance estimate in the numerator of the F ratio is
based on 10 cases, and the variance estimate in the denominator is based on
15 cases.
When the df’s are 9 and 14 and it’s a two-tailed test at α = .05, the critical
value of F is 3.21. (In a moment, I’ll show you an Excel function that finds that
value for you.) The calculated value is less than the critical value, so the deci-
sion is to not reject H
0
.
It makes a difference which df is in the numerator and which df is in the
denominator. The F-distribution for df=9 and df=14 is different from the
F-distribution for df=14 and df=9. For example, the critical value in the latter
case is 3.98, not 3.21.
Using F in conjunction with t
One use of the F-distribution is in conjunction with the t-test for indepen-
dent samples. Before you do the t-test, you use F to help decide whether to
assume equal variances or unequal variances in the samples.
In the equal variances t-test example I showed you earlier, the standard devi-
ations are 2.71 and 2.79. The variances are 7.34 and 7.78. The F-ratio of these
variances is
Each sample is based on 10 observations, so df=9 for each sample variance.
An F-ratio of 1.06 cuts off the upper 47 percent of the F-distribution whose
df are 9 and 9, so it’s safe to use the equal variances version of the t-test for
these data.
In the sidebar at the end of Chapter 10, I mention that on rare occasions a
high α is a good thing. When H
0
is a desirable outcome and you’d rather not
reject it, you stack the deck against rejecting by setting α at a high level so
that small differences cause you to reject H
0
.
17 454060-ch11.indd 20917 454060-ch11.indd 209 4/21/09 7:30:23 PM4/21/09 7:30:23 PM
210
Part III: Drawing Conclusions from Data
This is one of those rare occasions. It’s more desirable to use the equal vari-
ances t-test, which typically provides more degrees of freedom than the
unequal variances t-test. Setting a high value of α (.20 is a good one) for the
F-test enables you to be confident when you assume equal variances.
FTEST
The worksheet function FTEST calculates an F-ratio on the data from two
samples. It doesn’t return the F-ratio. Instead, it provides the two-tailed prob-
ability of the calculated F-ratio under H
0
. This means that the answer is the
proportion of area to the right of the F-ratio, and to the left of the reciprocal
of the F-ratio (1 divided by the F-ratio).
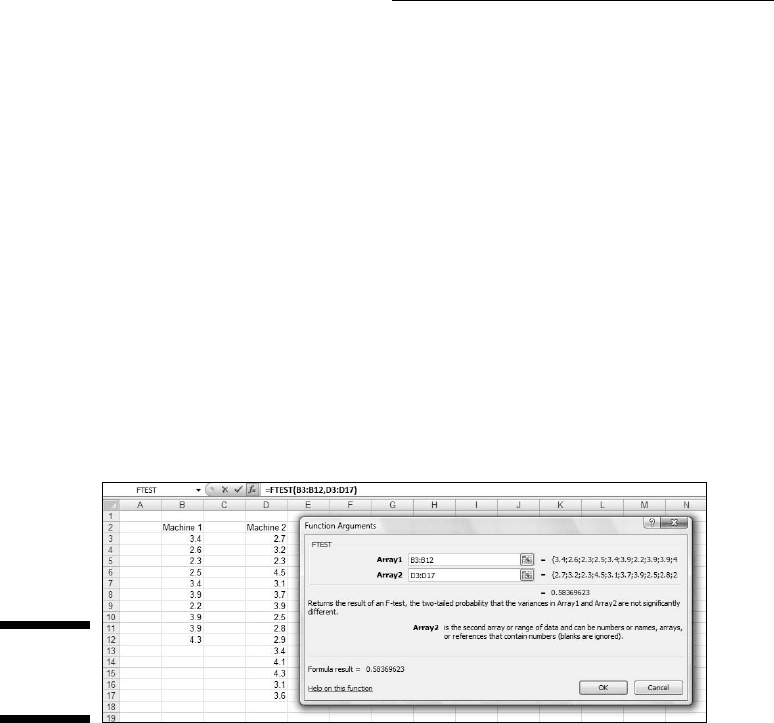
Figure 11-14 presents the data for the FarKlempt machines example I just
summarized for you. The Figure also shows the Function Arguments dialog
box for FTEST.
Figure 11-14:
Working
With FTEST.
Follow these steps:
1. Enter the data for each sample into a separate data array and select a
cell for the answer.
For this example, the data for the Machine 1 sample are in column B and
the data for the Machine 2 sample are in column D.
2. From the Statistical Functions menu, select FTEST to open the
Function Arguments dialog box for FTEST.
3. In the Function Arguments dialog box, enter the appropriate values
for the arguments.
17 454060-ch11.indd 21017 454060-ch11.indd 210 4/21/09 7:30:24 PM4/21/09 7:30:24 PM
211
Chapter 11: Two-Sample Hypothesis Testing
In the Array1 box, enter the sequence of cells that holds the data for the
sample with the larger variance. In this example, the Machine 1 data are
in B3:B12.
In the Array2 box, enter the sequence of cells that holds the data for the
other sample. The Machine 2 data are in D3:D17.
With values entered for all the arguments, the answer appears in the
dialog box.
4. Click OK to put the answer in the selected cell.
The value in the dialog box in Figure 11-14 is greater than .05, so the decision
is to not reject H
0
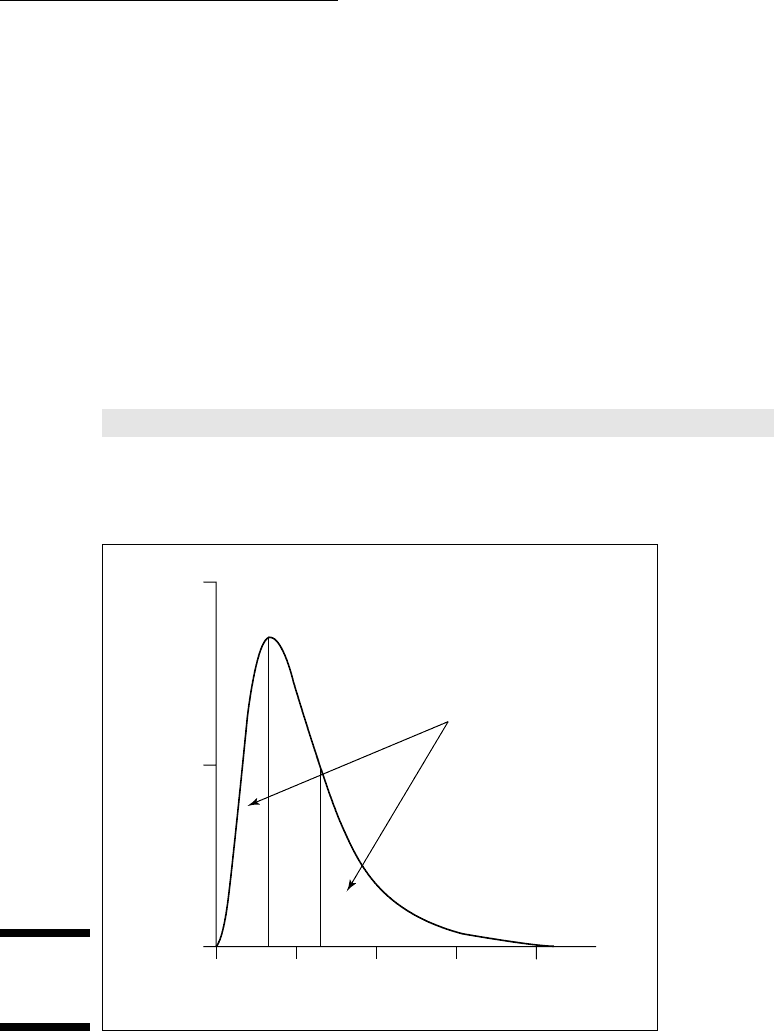
. Figure 11-15 shows the area that the answer represents.
Had I assigned names to those two arrays, the formula in the Formula bar
could have been:
=FTEST(Machine_1,Machine_2)
If you don’t know how to assign names to arrays, see Chapter 2. In that chap-
ter, you also find out why I inserted an underscore into each name.
Figure 11-15:
FTEST’s
result.
f(F)
1.0
0.5
0.0
0
F
1 2
FTEST returns the sum
of these two areas
3 4
17 454060-ch11.indd 21117 454060-ch11.indd 211 4/21/09 7:30:24 PM4/21/09 7:30:24 PM
212
Part III: Drawing Conclusions from Data
FDIST
You use the worksheet function FDIST to decide whether or not your calcu-
lated F-ratio is in the region of rejection. You supply a value for F, a value for
each df, and whether the test is one-tailed or two-tailed. FDIST returns the
probability of obtaining an F-ratio at least as high as yours if H
0
is true. If that
probability is less than your α, you reject H
0
.
Here, I apply FDIST to the example I just used. The F-ratio is 1.36, with 9 and
14 df.
The steps are:
1. Select a cell for the answer.
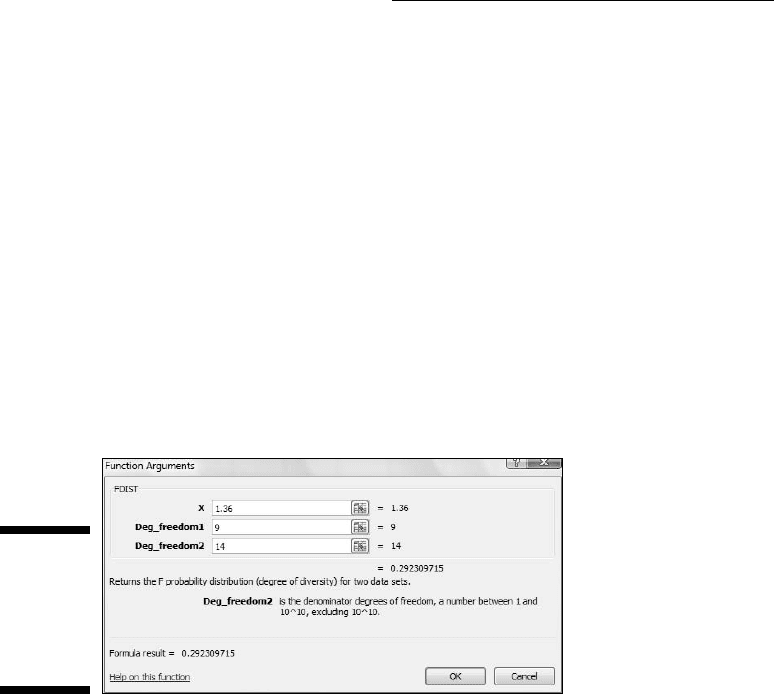
2. From the Statistical Functions menu, select FDIST to open the Function
Arguments dialog box for FDIST. (See Figure 11-16.)
Figure 11-16:
The
Function
Arguments
dialog box
for FDIST.
3. In the Function Arguments dialog box, enter the appropriate values
for the arguments.
In the X box, type the calculated F. For this example, the calculated F
is 1.36.
In the Deg_freedom1 box, I type the degrees of freedom for the vari-
ance estimate in the numerator of the F. The degrees of freedom for the
numerator in this example is 9 (10 scores - 1).
In the Deg_freedom2 box, I type the degrees of freedom for the variance
estimate in the denominator of the F. The degrees of freedom for the
denominator in this example is 14 (15 scores - 1).
With values entered for all the arguments, the answer appears in the
dialog box.
17 454060-ch11.indd 21217 454060-ch11.indd 212 4/21/09 7:30:24 PM4/21/09 7:30:24 PM
213
Chapter 11: Two-Sample Hypothesis Testing
4. Click OK to close the dialog box and put the answer in the selected cell.
The value in the dialog box in Figure 11-16 is greater than .05, so the decision
is to not reject H
0
.
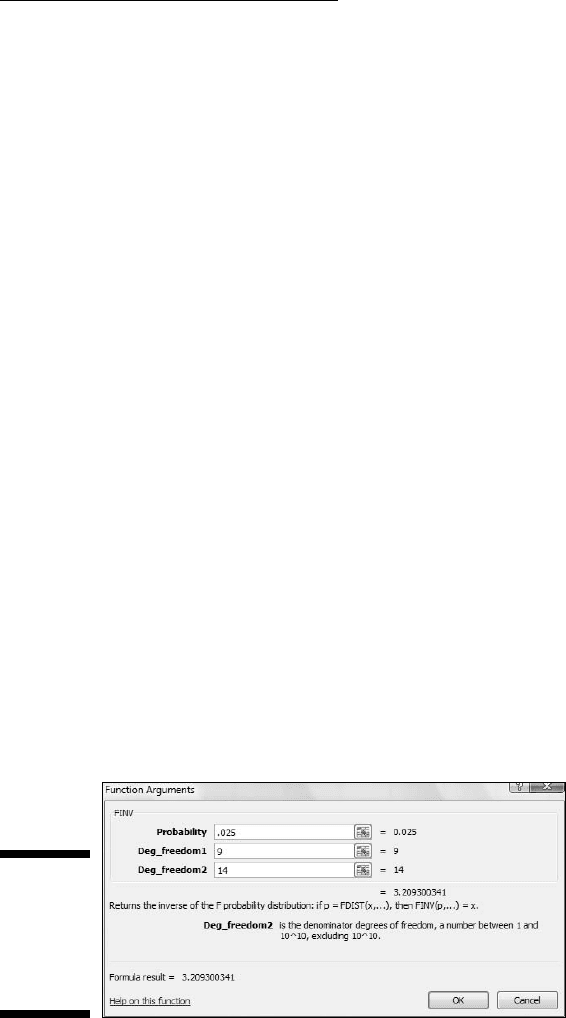
FINV
Excel’s FINV worksheet function finds the value in the F-distribution that cuts
off a given proportion of the area in the upper (right-side) tail. You can use
it to find the critical value of F. Here, I use it to find the critical value for the
two-tailed test in the FarKlempt machines example.
1. Select a cell for the answer.
2. From the Statistical Functions menu, select FINV to open the Function
Arguments dialog box for FINV.
3. In the Function Arguments dialog box, enter the appropriate values
for the arguments.
In the Probability box, I enter the proportion of area in the upper tail. In
this example, that’s .025 because it’s a two-tailed test with α = .05.
In the Deg_freedom1 box, I type the degrees of freedom for the numera-
tor. For this example, df for the numerator = 9.
In the Deg_freedom2 box, I type the degrees of freedom for the denomi-
nator. For this example, df for the denominator = 9.
With values entered for all the arguments, the answer appears in the
dialog box. (See Figure 11-17.)
4. Click OK to put the answer into the selected cell.
Figure 11-17:
The
Function
Arguments
dialog box
for FINV.
17 454060-ch11.indd 21317 454060-ch11.indd 213 4/21/09 7:30:24 PM4/21/09 7:30:24 PM
214
Part III: Drawing Conclusions from Data
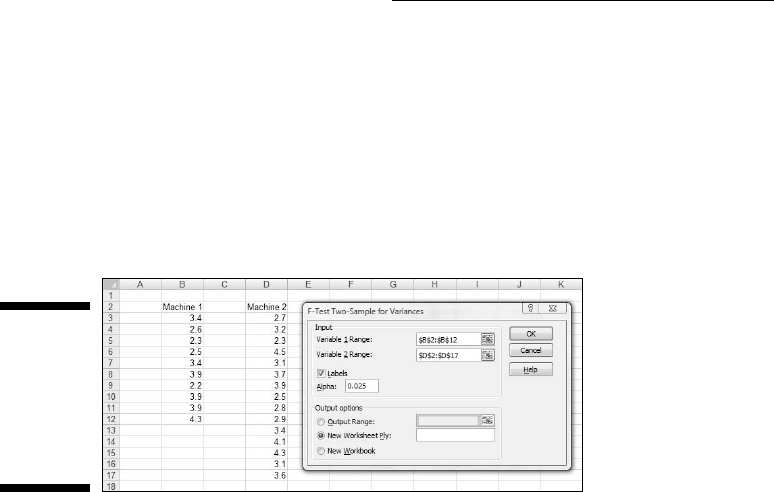
Data Analysis Tool: F-test Two Sample
for Variances
Excel provides a data analysis tool for carrying out an F-test on two sample
variances. I apply it here to the sample variances example I’ve been using.
Figure 11-18 shows the data, along with the dialog box for F-Test: Two-Sample
for Variances.
Figure 11-18:
The F-Test
data
analysis tool
and data
from two
samples.
To use this tool, follow these steps:
1. Enter the data for each sample into a separate data array.
For this example, the data in the Machine 1 sample are in column B and
the data for the Machine 2 sample are in column D.
2. Select Data | Data Analysis to open the Data Analysis dialog box.
3. In the Data Analysis dialog box, scroll down the Analysis Tools list
and select F-Test Two Sample For Variances. Click OK to open this
tool’s dialog box.
This is the dialog box in Figure 11-18.
4. In the Variable 1 Range box, enter the cell range that holds the data
for the first sample.
For the example, the Machine 1 data are in $B$2:$B$12. (Note the $-signs
for absolute referencing.)
5. In the Variable 2 Range box, enter the cell range that holds the data
for the second sample.
The Machine 2 data are in $D$2:$D$17.
17 454060-ch11.indd 21417 454060-ch11.indd 214 4/21/09 7:30:24 PM4/21/09 7:30:24 PM
215
Chapter 11: Two-Sample Hypothesis Testing
6. If the cell ranges include column headings, check the Labels checkbox.
I included the headings in the ranges, so I checked the box.
7. The Alpha box has 0.05 as a default. Change that value for a different α.
The Alpha box provides a one-tailed alpha. I want a two-tailed test, so I
changed this value to .025
8. In the Output Options, select a radio button to indicate where you
want the results.
I selected New Worksheet Ply to put the results on a new page in the
worksheet.
9. Click OK.
Because I selected New Worksheet Ply, a newly created page opens with
the results.
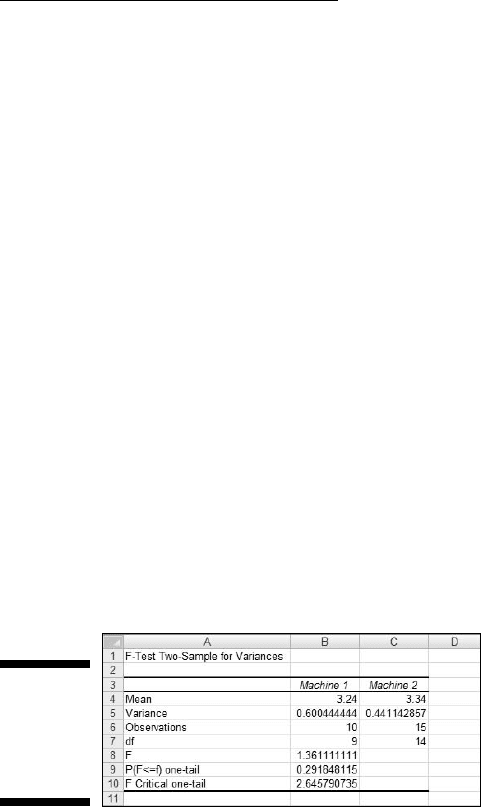
Figure 11-19 shows the tool’s results, after I expanded the columns. Rows 4
through 6 hold sample statistics. Cell B7 shows the degrees of freedom.
The remaining rows present F-related information. The calculated value of F
is in B8. Cell B9 gives the proportion of area the calculated F cuts off in the
upper tail of the F-distribution. This is the right-side area in Figure 11-15. Cell
B10 gives the critical value for a one-tailed test: That’s the value that cuts off
the proportion of the area in the upper tail equal to the value in the Alpha box.
Figure 11-19:
Results of
The F-Test
data analy-
sis tool.
17 454060-ch11.indd 21517 454060-ch11.indd 215 4/21/09 7:30:24 PM4/21/09 7:30:24 PM

216
Part III: Drawing Conclusions from Data
17 454060-ch11.indd 21617 454060-ch11.indd 216 4/21/09 7:30:25 PM4/21/09 7:30:25 PM

Chapter 12
Testing More Than Two Samples
In This Chapter
▶ Why multiple t-tests won’t work
▶ Introducing ANOVA
▶ What to do after an ANOVA
▶ Working with repeated measures
▶ Performing a trend analysis
S
tatistics would be limited if you could only make inferences about one
or two samples. In this chapter, I discuss the procedures for testing
hypotheses about three or more samples. I show what to do when samples
are independent of one another, and what to do when they’re not. In both
cases, I discuss what to do after you test the hypotheses.
I also introduce Excel data analysis tools that do the work for you. Although
these tools aren’t at the level you’d find in a dedicated statistical package,
you can combine them with Excel’s standard features to produce some
sophisticated analyses.
Testing More Than Two
Imagine this situation. Your company asks you to evaluate three different
methods for training its employees to do a particular job. You randomly
assign 30 employees to one of the three methods. Your plan is to train them,
test them, tabulate the results, and make some conclusions. Before you can
finish the study, three people leave the company — one from the Method 1
group, and two from the Method 3 group.
Table 12-1 shows the data.
18 454060-ch12.indd 21718 454060-ch12.indd 217 4/21/09 7:31:34 PM4/21/09 7:31:34 PM

218
Part III: Drawing Conclusions from Data
Table 12-1 Data from Three Training Methods
Method 1 Method 2 Method 3
95 83 68
91 89 75
89 85 79
90 89 74
99 81 75
88 89 81
96 90 73
98 82 77
95 84
80
Mean 93.44 85.20 75.25
Variance 16.28 14.18 15.64
Standard Deviation 4.03 3.77 3.96
Do the three methods provide different results, or are they so similar that
you can’t distinguish among them? To decide, you have to carry out a
hypothesis test:
H
0
: μ
1
= μ
2
= μ
3
H
1
: Not H
0
with α = .05.
A thorny problem
Sounds pretty easy, particularly if you’ve read Chapter 11. Take the mean
of the scores from Method 1, the mean of the scores from Method 2, and do
a t-test to see if they’re different. Follow the same procedure for Method 1
versus Method 3, and for Method 2 versus Method 3. If at least one of those
t-tests shows a significant difference, reject H
0
. Nothing to it, right?
Wrong. If your α is .05 for each t-test, you’re setting yourself up for a Type I
error with a probability higher than you planned on. The probability that at
least one of the three t-test results in a significant difference is way above .05.
18 454060-ch12.indd 21818 454060-ch12.indd 218 4/21/09 7:31:34 PM4/21/09 7:31:34 PM