Schmuller J. Statistical Analysis with Excel For Dummies
Подождите немного. Документ загружается.


299
Chapter 15: Correlation: The Rise and Fall of Relationships
H
0
: ρ
Sahusket
= ρ
Farshimmelt
H
1
: ρ
Sahusket
≠ ρ
Farshimmelt
Again, α = .05.
For highly technical reasons, you can’t set up a t-test for this one. In fact, you
can’t even work with .817 and .752, the two correlation coefficients.
Instead, what you do is transform each correlation coefficient into something
else and then work with the two something elses in a formula that gives
you — believe it or not — a z-test.
The transformation is called Fisher’s r to z transformation. Fisher is the statisti-
cian who’s remembered as the “F” in the F-test. He transforms the r into a z by
doing this:
If you know what loge means, fine. If not, don’t worry about it. (I explain it in
Chapter 20.) Excel takes care of all of this for you, as you see in a moment.
After you transform r to z, the formula is
The denominator turns out to be easier than you might think. It’s:
For this example,
21 454060-ch15.indd 29921 454060-ch15.indd 299 4/21/09 7:34:48 PM4/21/09 7:34:48 PM
300
Part III: Drawing Conclusions from Data
The whole formula is
The next step is to compare the calculated value to a standard normal dis-
tribution. For a two-tailed test with α = .05 the critical values in a standard
normal distribution are 1.96 in the upper tail and -1.96 in the lower tail. The
calculated value falls in between those two, so the decision is to not reject H
0
.
Worksheet Functions for Correlation
Excel provides two worksheet functions for calculating correlation — and,
they do exactly the same thing in exactly the same way! Why Excel offers
both CORREL and PEARSON I do not know, but there you have it. Those are
the two main correlation functions.
The others are RSQ and COVAR. RSQ calculates the coefficient of determina-
tion (the square of the correlation coefficient), and COVAR calculates the
covariance, sort of.
CORREL and PEARSON
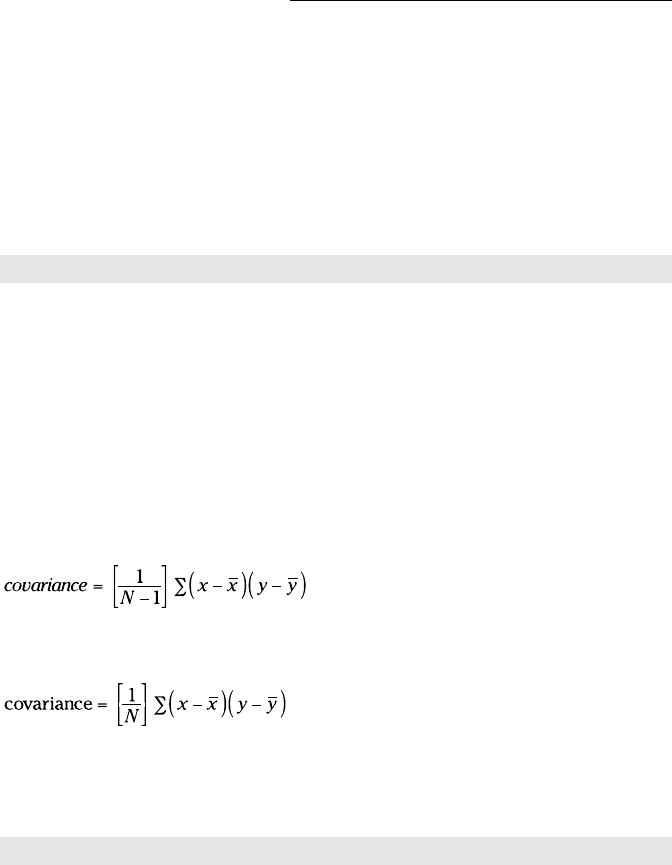
Figure 15-4 shows the data for the Sahusket SAT-GPA example, along with the
Function Arguments dialog box for CORREL.
Figure 15-4:
The
Function
Arguments
dialog box
for CORREL,
along with
data.
21 454060-ch15.indd 30021 454060-ch15.indd 300 4/21/09 7:34:48 PM4/21/09 7:34:48 PM

301
Chapter 15: Correlation: The Rise and Fall of Relationships
To use this function, the steps are:
1. Type the data into cell arrays and select a cell for CORREL’s answer.
I’ve entered the SAT data into C3:C22 and the GPA data into D3:D22, and
selected F15. I’ve defined SAT as the name of C3:C22 and GPA as the
name of D3:D22. (Reread Chapter 2 to see how to do this.)
2. From the Statistical Functions menu, select CORREL to open its
Function Arguments dialog box.
3. In the Function Arguments dialog box, enter the appropriate values
for the arguments.
In the Array 1 box, I entered SAT — the name I assigned to the cell range
(C3:C22) that holds the scores for one of the variables.
In the Array 2 box, I entered GPA — the name I assigned the cell range
(D3:D22) that holds the scores for the other variable.
With values entered for each argument, the answer, 0.81662505, appears
in the dialog box.
4. Click OK to put the answer into the selected cell.
Selecting PEARSON instead of CORREL gives you exactly the same
answer, and you use it exactly the same way.
Item analysis: A useful application of correlation
Instructors often want to know how perfor-
mance on a particular exam question is related
to overall performance on the exam. Ideally,
someone who knows the material answers
the question correctly; someone who doesn’t
answers it incorrectly. If everyone answers it
correctly — or if no one does — it’s a useless
question. This evaluation is called item analysis.
Suppose it’s possible to answer the exam
question either correctly or incorrectly, and
it’s possible to score from 0 to 100 on the exam.
Arbitrarily, you can assign a score of 0 for an
incorrect answer to the question, and 1 for a
correct answer, and then calculate a correla-
tion coefficient where each pair of scores is
either 0 or 1 for the question and a number from
0 to 100 for the exam. The score on the exam
question is called a dichotomous variable, and
this type of correlation is called point biserial
correlation.
If the point biserial correlation is high for an
exam question, it’s a good idea to retain that
question. If the correlation is low, the question
probably serves no purpose.
Because one of the variables can only be 0 or
1, the formula for the biserial correlation coef-
ficient is a bit different from the formula for the
regular correlation coefficient. If you use Excel
for the calculations, however, that doesn’t
matter. Just use CORREL (or PEARSON) in the
way I outline.
21 454060-ch15.indd 30121 454060-ch15.indd 301 4/21/09 7:34:49 PM4/21/09 7:34:49 PM
302
Part III: Drawing Conclusions from Data
RSQ
If you have to quickly calculate the coefficient of determination (r
2
), RSQ is
the function for you. I see no particular need for this function because it’s
easy enough to use CORREL and then square the answer.
Here’s what the EXCEL Formula Bar looks like after you fill in the RSQ
Function Arguments dialog box for this example:
=RSQ(GPA,SAT)
In terms of the dialog box, the only difference between this one and CORREL
(and PEARSON) is that the boxes you fill in are called Known_y’s and
Known_x’s rather than Array 1 and Array 2.
COVAR
This is another function for which I see no burning need. A minute ago I said
COVAR calculates covariance “sort of.” I said that because the covariance I
introduced earlier (as the numerator of the correlation coefficient) is
COVAR, however, calculates
You use this function the same way you use CORREL. After you fill in its
Function Arguments dialog box for this example, the formula in the formula
bar is
=COVAR(SAT,GPA)
If you want to use this function to calculate r, you divide the answer by the
product of STDEVP(SAT) and STDEVP(GPA). I don’t know why you’d bother
with all of this when you can just use CORREL.
21 454060-ch15.indd 30221 454060-ch15.indd 302 4/21/09 7:34:49 PM4/21/09 7:34:49 PM
303
Chapter 15: Correlation: The Rise and Fall of Relationships
Data Analysis Tool: Correlation
If you have to calculate a single correlation coefficient, you’ll find that Excel’s
Correlation data analysis tool does the same thing CORREL does, although
the output is in tabular form. This tool becomes useful when you have to cal-
culate multiple correlations on a set of data.
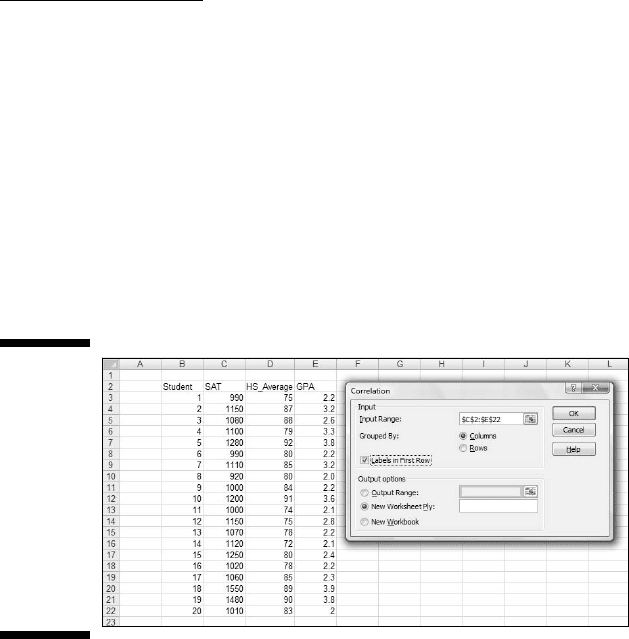
For example, Figure 15-5 shows SAT, High School Average, and GPA for 20
Sahusket University students, along with the dialog box for the Correlation
data analysis tool.
Figure 15-5:
The
Correlation
data
analysis
tool dialog
box, along
with data
for SAT,
High School
Average,
and GPA.
The steps for using this tool are:
1. Type the data into the worksheet and include labels for the columns.
In this example, the data (including labels) are in C2:E22.
2. Select Data | Data Analysis to open the Data Analysis dialog box.
3. In the Data Analysis dialog box, scroll down the Analysis Tools list
and select Correlation. Click OK to open the Correlation dialog box.
This is the dialog box in Figure 15-5.
4. In the Input Range box, enter the cell range that holds all the data.
I entered $C$2:$E$22. Note the $-signs for absolute referencing.
5. To the right of Grouped By, select a radio button to indicate if the data
are organized in columns or rows.
I chose the Columns radio button.
21 454060-ch15.indd 30321 454060-ch15.indd 303 4/21/09 7:34:49 PM4/21/09 7:34:49 PM
304
Part III: Drawing Conclusions from Data
6. If the cell ranges include column headings, check the Labels checkbox.
I included the headings in the ranges, so I checked the box.
7. In the Output Options, select a radio button to indicate where you
want the results.
I selected New Worksheet Ply to put the results on a new page in the
worksheet.
8. Click OK.
Because I selected New Worksheet Ply, a newly created page opens with
the results.
Tabled output
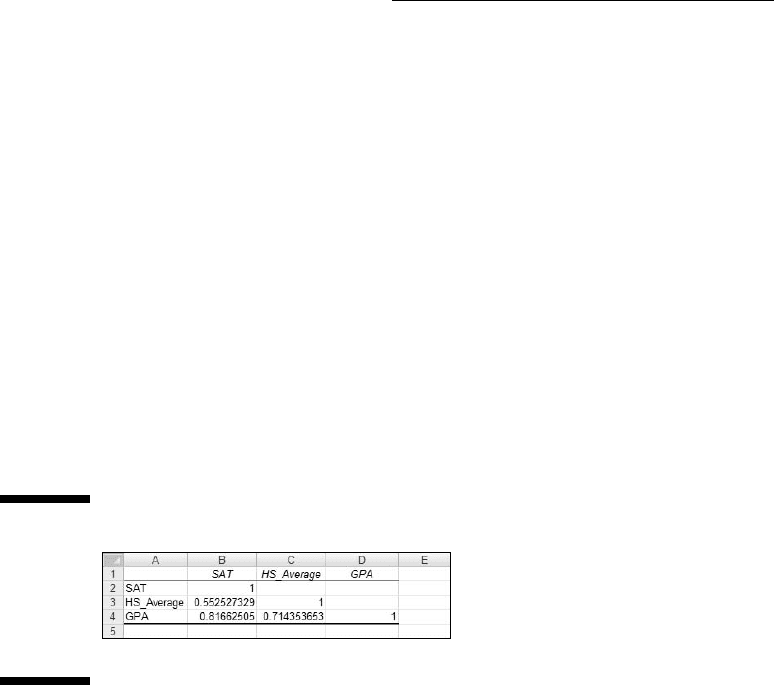
Figure 15-6 shows the tool’s tabled output, after I expanded the columns. The
table is a correlation matrix.
Figure 15-6:
The
Correlation
data analy-
sis tool’s
tabled
output.
Each cell in the matrix represents the correlation of the variable in the row
with the variable in the column. Cell B3 presents the correlation of SAT with
High School Average, for example. Each cell in the main diagonal contains 1.
This is because each main diagonal cell represents the correlation of a vari-
able with itself.
It’s only necessary to fill in half the matrix. The cells above the main diagonal
would contain the same values as the cells below the main diagonal.
What does this table tell you, exactly? Read on. . . .
Multiple correlation
The correlation coefficients in this matrix combine to produce a multiple
correlation coefficient. This is a number that summarizes the relationship
21 454060-ch15.indd 30421 454060-ch15.indd 304 4/21/09 7:34:49 PM4/21/09 7:34:49 PM
305
Chapter 15: Correlation: The Rise and Fall of Relationships
between the dependent variable — GPA in this example — and the two inde-
pendent variables (SAT and High School Average).
To show you how these correlation coefficients combine, I abbreviate GPA
as G, SAT as S, and High School Average as H. So rGS is the correlation coef-
ficient for GPA and SAT, rGH is the correlation coefficient for GPA and High
School Average, and rSH is the correlation coefficient for SAT and High
School Average.
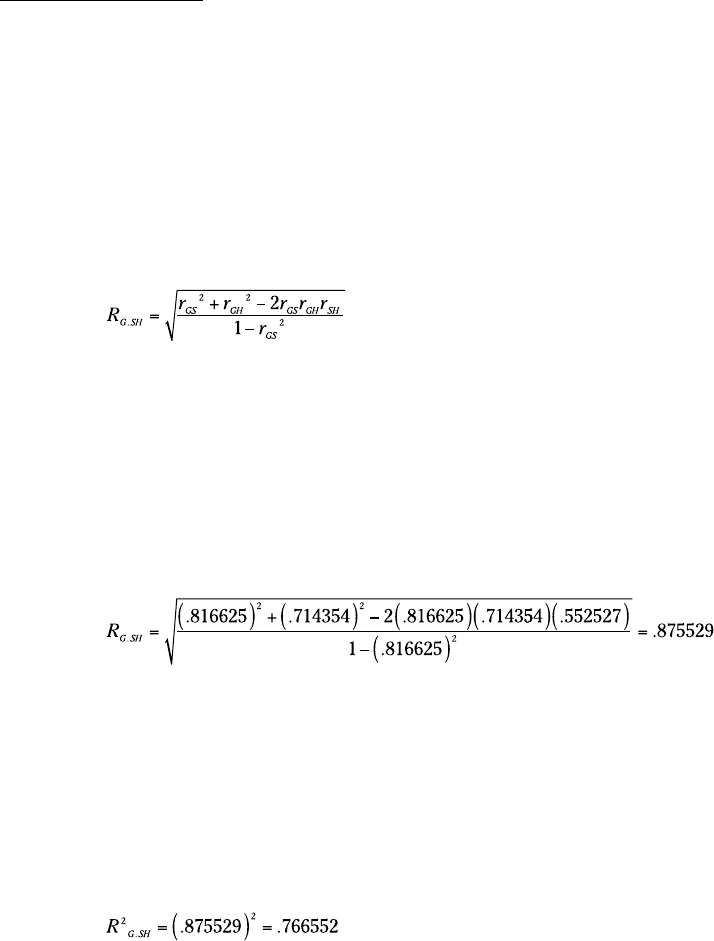
Here’s the formula that puts them all together:
The uppercase R on the left indicates that this is a multiple correlation coeffi-
cient, as opposed to the lowercase r that indicates a correlation between two
variables. The subscript G.SH means that the multiple correlation is between
GPA and the combination of SAT and High School Average.
This is the calculation that produces Multiple R in the Regression Statistics
section of the Regression data analysis tool’s results. (See Chapter 14.)
For this example,
Because I use the same data to show you multiple regression in Chapter 14,
this value (with some additional decimal places) is in Figure 14-25, in cell B4.
If you square this number, you get the multiple coefficient of determination. In
Chapter 14, I tell you about R Square, and that’s what this is. It’s another item
in the Regression Statistics that the Regression data analysis tool calculates.
You also find it in LINEST’s results, although it’s not labeled.
For this example, that result is:
You can go back and see this number in Figure 14-24 in cell H5 (the LINEST
results). You can also see it in Figure 14-25, cell B5 (the Regression data anal-
ysis tool report).
21 454060-ch15.indd 30521 454060-ch15.indd 305 4/21/09 7:34:49 PM4/21/09 7:34:49 PM
306
Part III: Drawing Conclusions from Data
Partial correlation
GPA and SAT are associated with High School Average (in the example). Each
one’s association with High School Average might somehow hide the true
correlation between them.
What would their correlation be if you could remove that association?
Another way to say this: What would be the GPA-SAT correlation if you could
hold High School Average constant?
One way to hold High School Average constant is to find the GPA-SAT cor-
relation for a sample of students who have one High School Average — 87,
for example. In a sample like that, the correlation of each variable with High
School Average is zero. This usually isn’t feasible in the real world, however.
Another way is to find the partial correlation between GPA and SAT. This is
a statistical way of removing each variable’s association with High School
Average in your sample. You use the correlation coefficients in the correla-
tion matrix to do this:
Adjusting R
2
Here’s some more information about R
2
as it
relates to Excel. In addition to R
2
— or as Excel
likes to write it, R Square — the Regression data
analysis tool calculates Adjusted R Square. In
Figure 14-21, it’s in cell B6. Why is it necessary
to “adjust” R Square?
In multiple regression, adding independent vari-
ables (like High School Average) sometimes
makes the regression equation less accurate.
The multiple coefficient of determination, R
Square, doesn’t reflect this. Its denomina-
tor is SS
Total
(for the dependent variable) and
that never changes. The numerator can only
increase or stay the same. So any decline in
accuracy doesn’t result in a lower R Square.
Taking degrees of freedom into account fixes
the flaw. Every time you add an independent
variable, you change the degrees of freedom
and that makes all the difference. Just so you
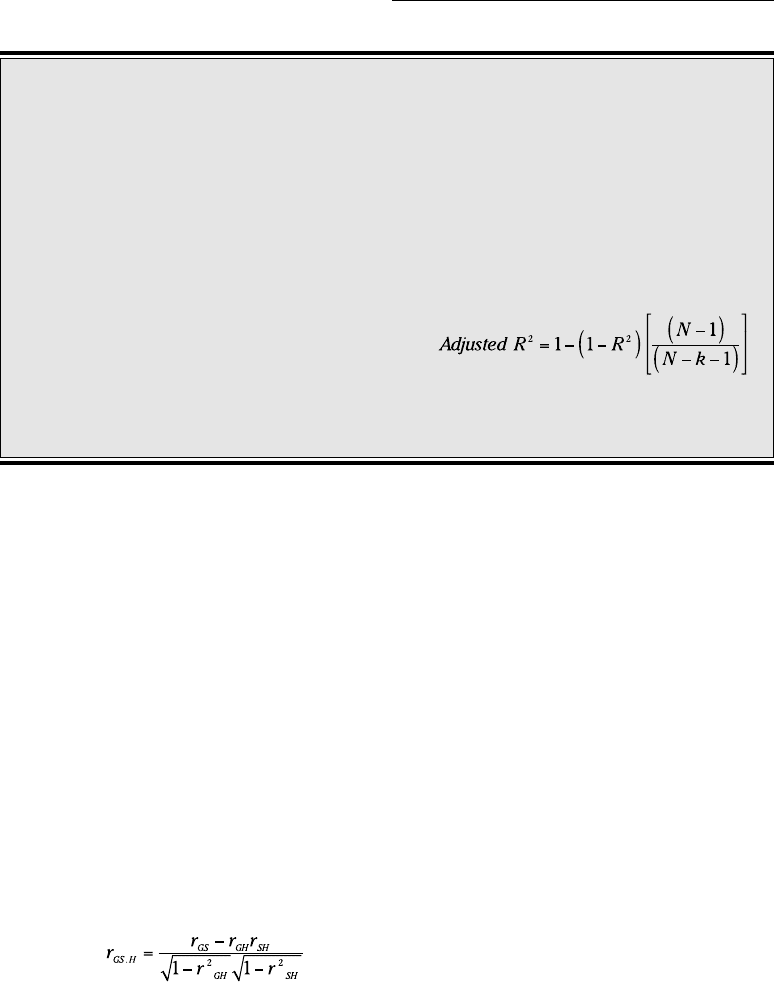
know, here’s the adjustment:
The k in the denominator is the number of inde-
pendent variables.
21 454060-ch15.indd 30621 454060-ch15.indd 306 4/21/09 7:34:49 PM4/21/09 7:34:49 PM
307
Chapter 15: Correlation: The Rise and Fall of Relationships
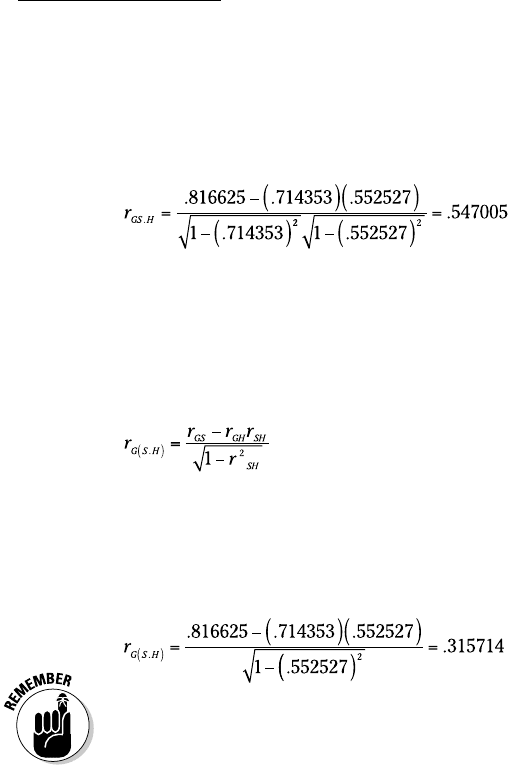
Once again, G stands for GPA, S for SAT, and H for High School Average. The
subscript GS.H means that the correlation is between GPA and SAT with High
School Average “partialled out.”
For this example,
Semipartial correlation
It’s also possible to remove the correlation with High School Average from
just SAT without removing it from GPA. This is called semipartial correlation.
The formula for this one also uses the correlation coefficients from the cor-
relation matrix:
The subscript G(S.H) means the correlation is between GPA and SAT with
High School Average “partialled out” of SAT only.
Applying this formula to the example,
Some statistics textbooks refer to semipartial correlation as part correlation.
Data Analysis Tool: Covariance
You use the Covariance data analysis tool the same way you use the
Correlation data analysis tool. I won’t go through the steps again. Instead, I’ll
just show you the tabled output in Figure 15-7. The data are from Figure 15-5.
The table is a covariance matrix. Each cell in the matrix shows the covari-
ance of the variable in the row with the variable in the column (again, using
N rather than N-1). Cell C4 shows the covariance of GPA with High School
Average. The main diagonal in this matrix presents the variance of each vari-
able (which is equivalent to the covariance of a variable with itself). In this
case, the variance is what you compute if you use VARP.
21 454060-ch15.indd 30721 454060-ch15.indd 307 4/21/09 7:34:50 PM4/21/09 7:34:50 PM
308
Part III: Drawing Conclusions from Data
Figure 15-7:
The
Covariance
data analy-
sis tool’s
tabled out-
put for SAT,
High School
Average,
and GPA.
Again, it’s only necessary to fill half the matrix. Cells above the main diagonal
would hold the same values as the cells below the main diagonal.
As is the case with COVAR, I don’t see why you’d use this tool. I just include
it for completeness.
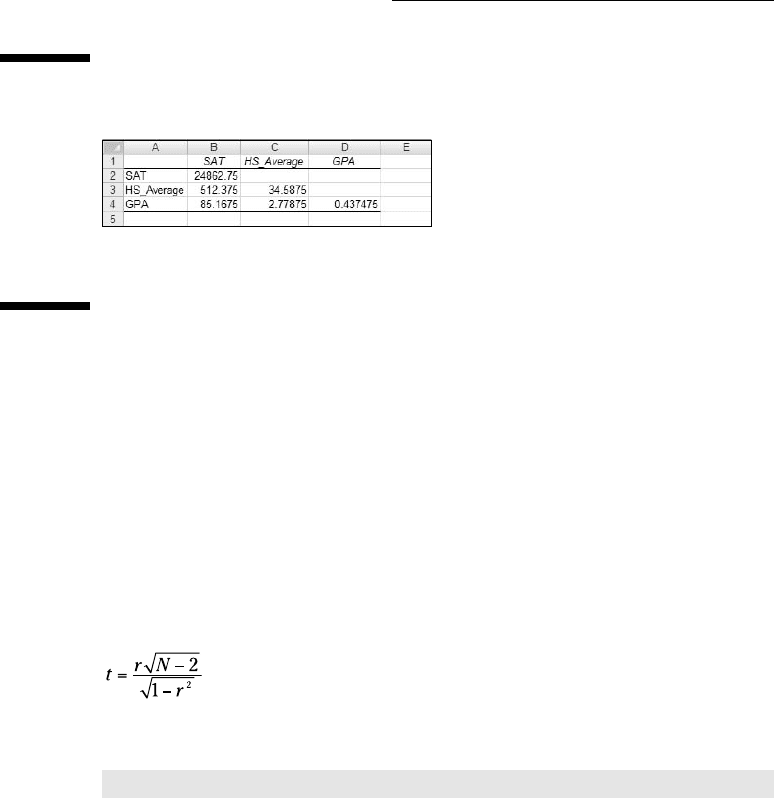
Testing Hypotheses About Correlation
Excel has no worksheet function for testing hypotheses about r. As I pointed
out before, you perform a t-test whose formula is:
With 0.817 stored in cell H12, I used this formula to calculate t:
=H12*SQRT(20-2)/SQRT(1-H12^2)
I then used the answer (6.011 and some additional decimal places) as input
to TDIST (along with 18 df and 1 tail) to find that the one-tailed probability of
the result is way less than .05.
Worksheet Functions: FISHER, FISHERINV
Excel handles the rather complex transformations that enable you to test
hypotheses about the difference between two correlation coefficients. FISHER
21 454060-ch15.indd 30821 454060-ch15.indd 308 4/21/09 7:34:50 PM4/21/09 7:34:50 PM