Schmuller J. Statistical Analysis with Excel For Dummies
Подождите немного. Документ загружается.

379
Chapter 20: Ten Things (Twelve, Actually) That Didn’t Fit in Any Other Chapter
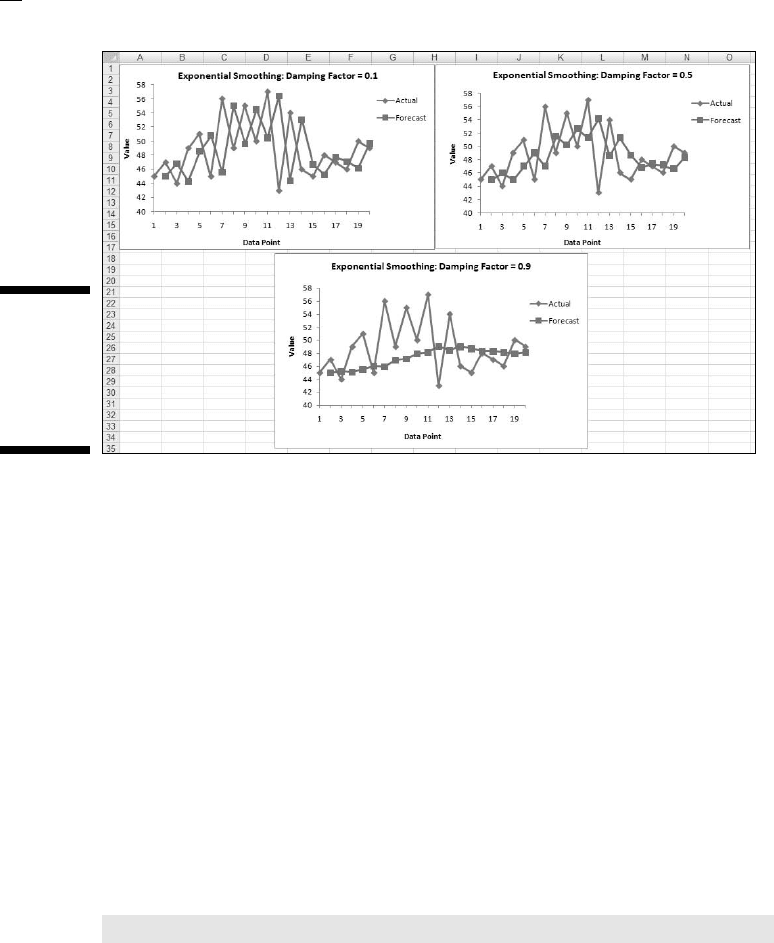
Figure 20-4:
Exponential
smoothing
with three
damping
factors.
Graphing the Standard Error of the Mean
When you create a graph and your data are means, it’s a good idea to include
the standard error of each mean in your graph. This gives the viewer an idea
of the spread of scores around each mean.
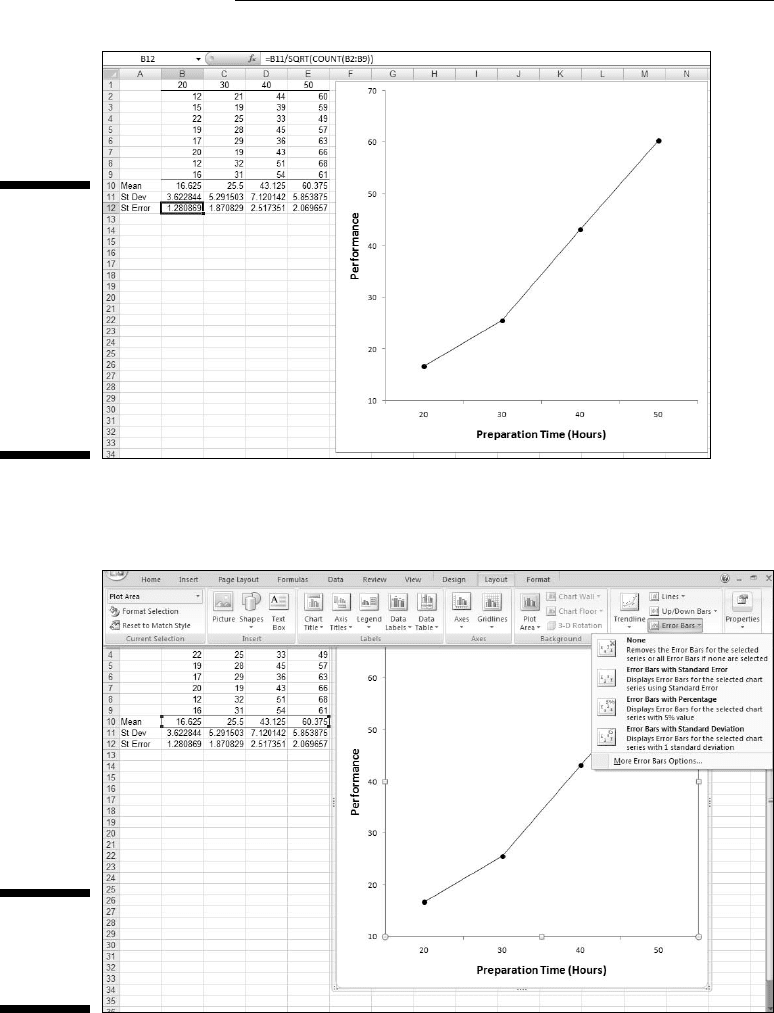
Figure 20-5 gives an example of a situation where this arises. The data are
(fictional) scores for four groups of people on a test. Each column header
indicates the amount of preparation time for the eight people within the
group. I used Excel’s graphics capabilities (Chapter 3) to draw the graph.
Because the independent variable is quantitative, a line graph is appropriate.
(See Chapter 19 for a rant on my biggest peeve.)
For each group I used AVERAGE to calculate the mean and STDEV to cal-
culate the standard deviation. I also calculated the standard error of each
mean. I selected cell B12, so the formula box shows you that I calculated the
standard error for column B via this formula:
=B11/SQRT(COUNT(B2:B9))
The trick is to get each standard error into the graph. In Excel 2007, it’s a
snap. Begin by selecting the graph. This causes the Design, Layout, and
Format tabs to appear. Select Layout | Error Bars
28 454060-ch20.indd 37928 454060-ch20.indd 379 4/21/09 7:38:52 PM4/21/09 7:38:52 PM
380
Part V: The Part of Tens
Figure 20-5:
Four groups,
their means,
standard
deviations,
and stan-
dard errors.
The graph
shows
the group
means.
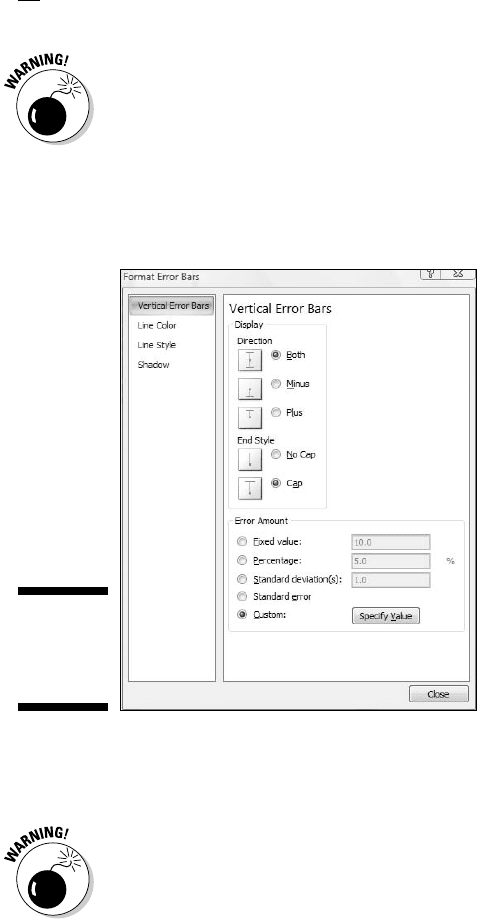
This opens a menu. Figure 20-6 shows what I mean.
Figure 20-6:
Selecting
Layout |
Error Bars.
28 454060-ch20.indd 38028 454060-ch20.indd 380 4/21/09 7:38:52 PM4/21/09 7:38:52 PM
381
Chapter 20: Ten Things (Twelve, Actually) That Didn’t Fit in Any Other Chapter
In this menu, you have to be careful. One selection is Error Bars with Standard
Error. Avoid it. If you think this selection tells Excel to put the standard error
of each mean on the graph, rest assured that Excel has absolutely no idea of
what you’re talking about. For this selection, Excel calculates the standard
error of the set of four means — not the standard error within each group.
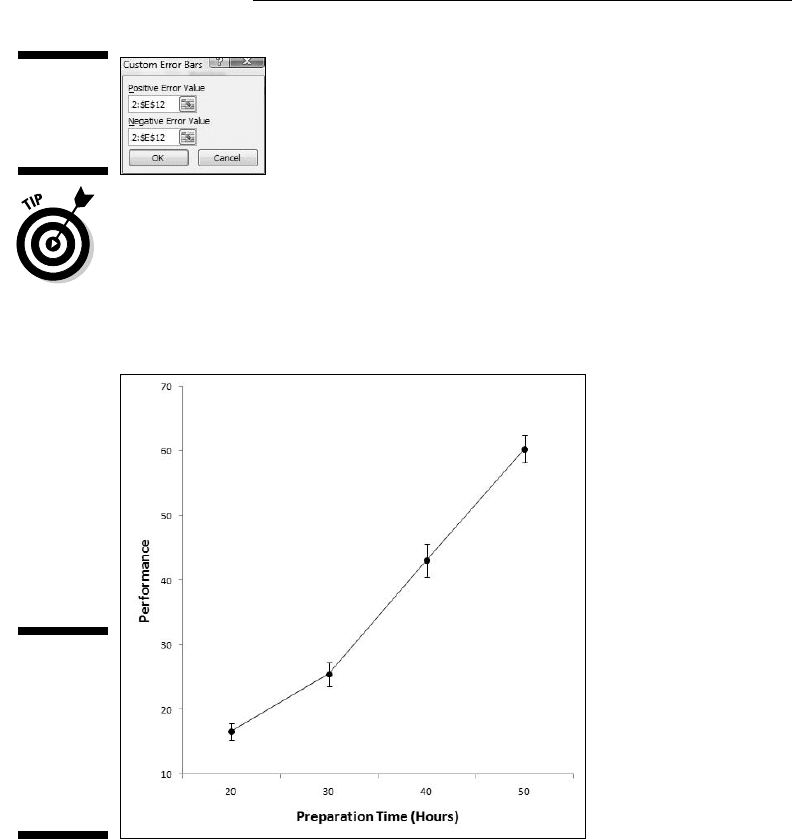
Instead, in that menu, pick the final choice, More Error Bar options. This
opens the Format Error Bars dialog box. (See Figure 20-7.)
Figure 20-7:
The Format
Error Bars
dialog box.
In the Display area, click the radio button next to Both (for Direction) and the
radio button next to Cap (for End Style).
Remember the cautionary note I gave you a moment ago? I’ve got a similar
one here. One selection in the Error Amount area is Standard Error. Avoid this
one, too. It does not tell Excel to put the standard error of each mean on the
graph.
In the Error Amount area, click the radio button next to Custom. This acti-
vates the Specify Value button. Click that button to open the Custom Error
Bars dialog box shown in Figure 20-8. With the cursor in the Positive Error
Value box, select the cell range that holds the standard errors ($B$12:$E$12).
Move the cursor to the Negative Error Value box and do the same.
28 454060-ch20.indd 38128 454060-ch20.indd 381 4/21/09 7:38:53 PM4/21/09 7:38:53 PM
382
Part V: The Part of Tens
Figure 20-8:
The Custom
Error Bars
dialog box.
That Negative Error Value box might give you a little trouble. Make sure that
it’s cleared of any default values before you enter the cell range.
Click OK on the Custom Error Bars dialog box, close the Format Error Bars
dialog box and the graph looks like Figure 20-9.
Figure 20-9:
The graph
of the group
means
including
the standard
error of
each mean.
This, by the way, is a good example of how the Ribbon expands the user
experience. In previous Excel versions it was difficult to access the Error Bar
capability, or to even know it was available. Buried under a tab in a dialog
box, Error Bars seldom saw the light of day. The Ribbon, on the other hand,
makes them immediately visible, as Figure 20-6 shows.
28 454060-ch20.indd 38228 454060-ch20.indd 382 4/21/09 7:38:53 PM4/21/09 7:38:53 PM
383
Chapter 20: Ten Things (Twelve, Actually) That Didn’t Fit in Any Other Chapter
Probabilities and Distributions
Here are some probability-related worksheet functions. A little on the eso-
teric side, you might find some use for them.
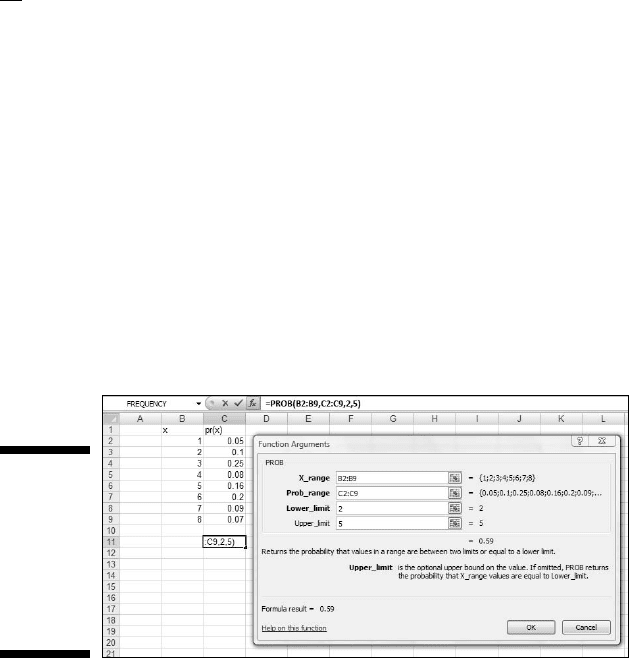
PROB
If you have a probability distribution of a discrete random variable, and you
want to find the probability that the variable takes on a particular value,
PROB is for you. Figure 20-10 shows the PROB Argument Functions dialog
box along with a distribution.
Figure 20-10:
The PROB
Function
Arguments
dialog
box and a
probability
distribution.
You supply the random variable (X_range), the probabilities (Prob_range),
a Lower Limit, and an Upper Limit. PROB returns the probability that the
random variable takes on a value between those limits.
WEIBULL
This is a probability density function that’s mostly applicable to engineering.
It serves as a model for the time until a physical system fails. As engineers
know, in some systems, the number of failures stays the same over time
because shocks to the system cause failure. In others, like some micro-
electronic components, the number of failures decreases with time. In still
others, wear and tear increase failures with time.
28 454060-ch20.indd 38328 454060-ch20.indd 383 4/21/09 7:38:53 PM4/21/09 7:38:53 PM
384
Part V: The Part of Tens
The Weibull distribution’s two parameters allow it to reflect all these possi-
bilities. One parameter, Alpha, determines how wide or narrow the distribu-
tion is. The other, Beta, determines where it’s centered on the x-axis.
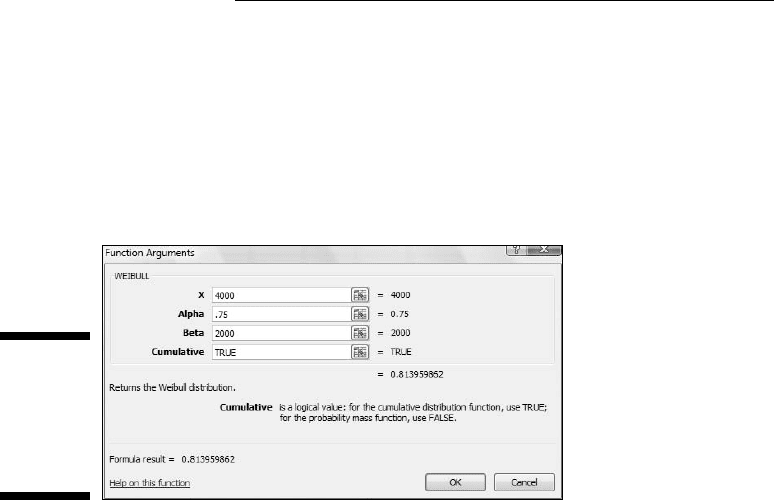
The Weibull probability density function is a rather complicated equa-
tion. Thanks to Excel, you don’t have to worry about it. Figure 20-11 shows
WEIBULL’s Function Arguments dialog box.
Figure 20-11:
The
WEIBULL
Function
Arguments
dialog box.
The dialog box in the figure answers the kind of question a product engineer
would ask: Assume the time to failure of a bulb in an LCD projector follows
a Weibull distribution with Alpha = .75 and Beta = 2000 hours. What’s the
probability the bulb lasts at most 4000 hours? The dialog box shows that the
answer is .814.
Drawing Samples
Excel’s Sampling data analysis tool is helpful for creating samples. You can
tailor it in a couple of ways. If you’re trying to put a focus group together and
you have to select the participants from a pool of people, you could assign
each one a number, and have the Sampling tool select your group.
One way to select is periodically. You supply n, and Excel samples every nth
number. The other way to select is randomly. You supply the number of indi-
viduals you want randomly selected and Excel does the rest.
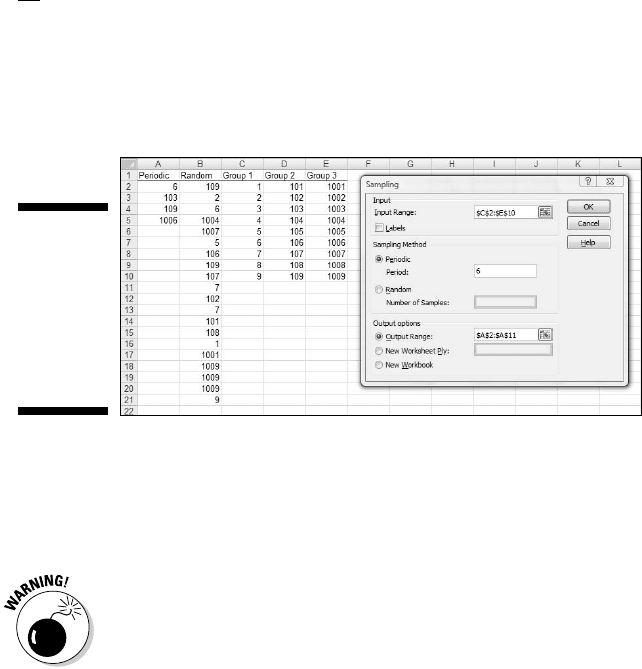
Figure 20-12 presents the Sampling dialog box, three groups I had it sample
from, and two columns of output.
The first output column, Column A, shows the results of periodic sampling
with a period of 6. Sampling begins with the sixth score in Group 1. Excel
then counts out scores and delivers the sixth, and goes through that process
28 454060-ch20.indd 38428 454060-ch20.indd 384 4/21/09 7:38:54 PM4/21/09 7:38:54 PM
385
Chapter 20: Ten Things (Twelve, Actually) That Didn’t Fit in Any Other Chapter
again until it finishes in the last group. The periodic sampling process, as you
can see, doesn’t recycle. I supplied an output range up to cell A11, but Excel
stopped after four numbers.
Figure 20-12:
The Sam-
pling data
analysis tool
dialog box,
sampled
groups, and
results.
The second output column, Column B, shows the results of random sampling.
I asked for 20 and that’s what I got. If you closely examine the numbers in
Column B, you’ll see that the random sampling process can select a number
more than once.
Beware of a little quirk: The Labels checkbox seems to have no effect. When I
specified an input range that includes C1, D1, and E1, and checked the Labels
checkbox, I received an error message: “Sampling - Input range contains non-
numeric data.” Not a showstopper, but a little annoying.
Testing Independence: The True
Use of CHITEST
In Chapter 18, I show you how to use CHITEST to test the goodness of fit of
a model to a set of data. At the time, I warned you about the pitfalls of using
this function in that context, and I mentioned that it’s really intended for
something else.
Here’s the something else. Imagine you’ve surveyed a total of 200 people.
Each person lives in either a rural area, an urban area, or a suburb. Your
survey asked them their favorite type of movie — drama, comedy, or anima-
tion. You want to know if their movie preference is independent of the envi-
ronment in which they live.
28 454060-ch20.indd 38528 454060-ch20.indd 385 4/21/09 7:38:54 PM4/21/09 7:38:54 PM
386
Part V: The Part of Tens
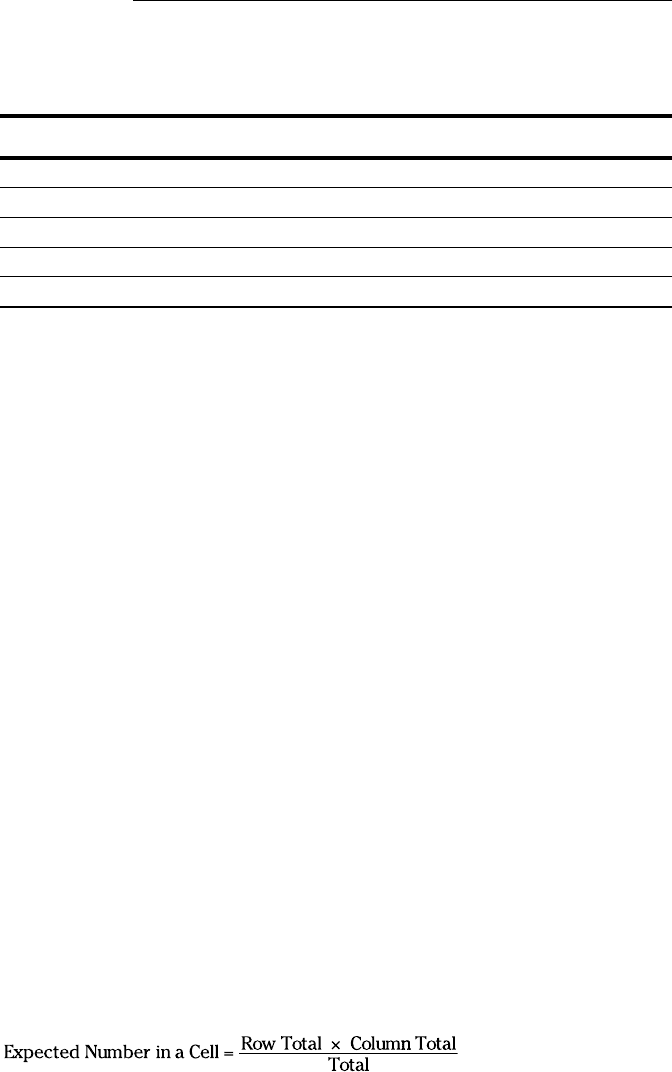
Table 20-1 shows the results.
Table 20-1 Living Environment and Movie Preference
Drama Comedy Animation Total
Rural 40 30 10 80
Urban 20 30 20 70
Suburban 10 20 20 50
Total 70 80 50 200
The number in each cell represents the number of people in the environment
indicated in the row who prefer the type of movie indicated in the column.
Do the data show that preference is independent of environment? This calls
for a hypothesis test:
H
0
: Movie preference is independent of environment
H
1
: Not H
0
α= .05
To get this done, you have to know what to expect if the two are indepen-
dent. Then you can compare the data with the expected numbers and see if
they match. If they do, you can’t reject H
0
. If they don’t, you reject H
0
.
Concepts from probability help determine the expected data. In Chapter 16, I
tell you that if two events are independent, you multiply their probabilities to
find the probability that they occur together. Here, you can treat the tabled
numbers as proportions, and the proportions as probabilities.
For example, in your sample, the probability is 80/200 that a person is from
a rural environment. The probability is 70/200 that a person prefers drama.
What’s the probability that a person is in the category “rural and likes
drama”? If the environment and preference are independent, that’s (80/200)
× (70/200). To turn that probability into an expected number of people,
you multiply it by the total number of people in the sample — 200. So the
expected number of people is (80 × 70)/200, which is 28.
In general,
28 454060-ch20.indd 38628 454060-ch20.indd 386 4/21/09 7:38:54 PM4/21/09 7:38:54 PM
387
Chapter 20: Ten Things (Twelve, Actually) That Didn’t Fit in Any Other Chapter
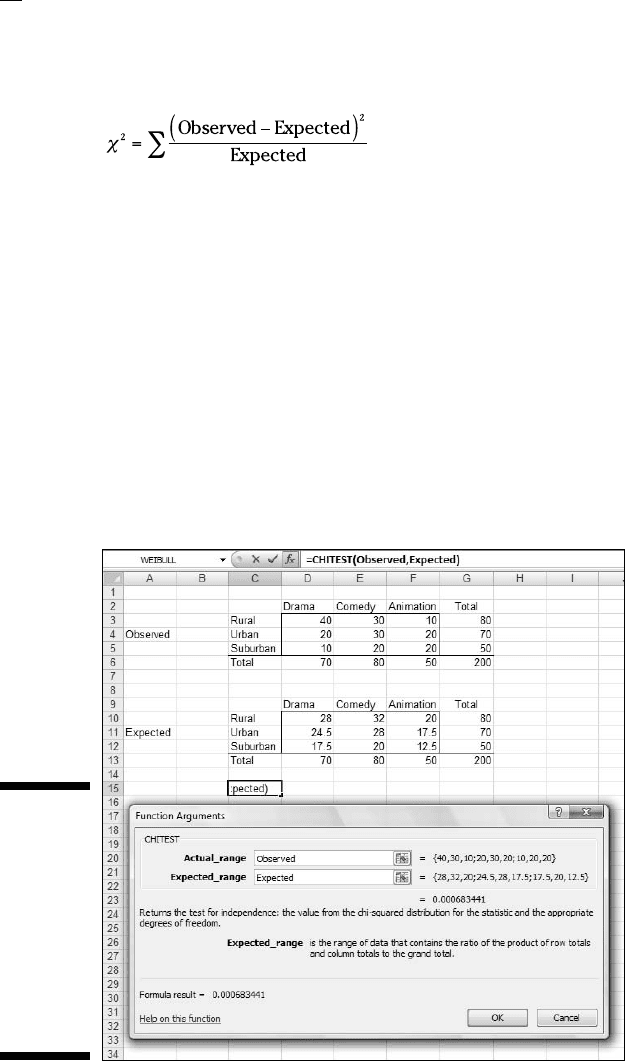
After you have the expected numbers, you compare them to the observed
numbers (the data) via this formula:
You test the result against a χ
2
(chi-square) distribution with df = (Number of
Rows – 1) X (Number of Columns – 1), which in this case comes out to 4.
The CHITEST worksheet function performs the test. You supply the observed
numbers and the expected numbers, and CHITEST returns the probability that a
χ
2
at least as high as the result from the preceding formula could have resulted if
the two types of categories are independent. If the probability is small (less than
.05), reject H
0
. If not, don’t reject. CHITEST doesn’t return a value of χ
2
, it just
returns the probability (under a χ
2
distribution with the correct df).
Figure 20-13 shows a worksheet with both the observed data and the expected
numbers, along with CHITEST’s Function Arguments dialog box. Before I ran
CHITEST I attached the name Observed to D3:F5, and the name Expected to
D10:F12. (If you don’t remember how to do this, reread Chapter 2.)
Figure 20-13:
The
CHITEST
Function
Arguments
dialog
box, with
observed
data and
expected
numbers.
28 454060-ch20.indd 38728 454060-ch20.indd 387 4/21/09 7:38:54 PM4/21/09 7:38:54 PM

388
Part V: The Part of Tens
The figure shows that I’ve entered Observed into the Actual_range box, and
Expected into the Expected_range box. The dialog box shows a very small
probability, .00068, so the decision is to reject H
0
. The data are consistent
with the idea that movie preference is not independent of environment.
Logarithmica Esoterica
The functions in this section are really out there. Unless you’re a tech-head,
you’ll probably never use them. I present them for completeness. You might
run into them while you’re wandering through Excel’s statistical functions,
and wonder what they are.
They’re based on what mathematicians call natural logarithms, which in turn
are based on e, that constant I use at various points throughout the book. I
begin with a brief discussion of logarithms, and then I turn to e.
What is a logarithm?
Plain and simple, a logarithm is an exponent — a power to which you raise a
number. In the equation
2 is an exponent. Does that mean that 2 is also a logarithm? Well . . . yes. In
terms of logarithms,
That’s really just another way of saying 10
2
= 100. Mathematicians read it as
“the logarithm of 100 to the base 10 equals 2.” It means that if you want to
raise 10 to some power to get 100, that power is 2.
How about 1,000? As you know
so
How about 453? Uh . . . Hmmm . . . That’s like trying to solve
28 454060-ch20.indd 38828 454060-ch20.indd 388 4/21/09 7:38:54 PM4/21/09 7:38:54 PM