Schmuller J. Statistical Analysis with Excel For Dummies
Подождите немного. Документ загружается.


429
Appendix B: The Analysis of Covariance
All that remains is to run the Regression analysis tool and use its results to
complete the ANCOVA table.
In Chapter 14 I show you how to use the Regression tool. The difference here
(as with ANOVA in Method 1) is that I directed the output to this worksheet
rather than to a separate worksheet. For this example, the Input Y range in
the Regression tool dialog box is A1:A16. Because this is a multiple regres-
sion, the Input X range is B1:D16.
The ANCOVA table is below the Regression output. As before, I formatted the
whole thing, labels, rows, columns, and all. Then I filled in the df.
I begin, as in Method 1, with the Adjusted SS
Total
. Again, that’s
So this time
=H14-(B20^2*B18)
goes into cell G26.
What next? The values for the Adjusted Within row are in the ANOVA table
for the Regression output. They’re in the row labeled Residual. That’s right —
the Adjusted SS
Within
is the SS
Residual
and Adjusted MS
Within
is the MS
Residual
.
That means
=H13
goes into cell G25 and
=I13
goes into cell I25.
The Adjusted SS
Between
is
=G26-G25
in cell G24.
30 454060-bapp02.indd 42930 454060-bapp02.indd 429 4/21/09 7:40:19 PM4/21/09 7:40:19 PM
430
Statistical Analysis with Excel For Dummies, 2nd Edition
I divided the Adjusted SSs by the df to produce the Adjusted MSs. Then I
divided the Adjusted MS
Between
by the Adjusted MS
Within
to compute F. The
rightmost entry, Significance F, is based on FDIST as in Method 1.
Did I forget b
within
? Nope. It’s is in the Regression output in cell G18 under
Coefficients. It’s the regression coefficient for Math_Aptitude. I used this
value to calculate the Adjusted Means in the Means table. After using
AVERAGE to compute the means for the dependent variable and the covari-
ate, I put this formula into cell D24
=B24-$G$18*(C24-AVERAGE($B$2:$B$16))
and autofilled D25 and D26.
When you began reading this subsection, you might have wondered why
I bothered to show you this method. Now that you’ve read it, you might
wonder why I bothered to show you the first one!
After the ANCOVA
As I point out in Chapter 12, a significant F value indicates that an effect is
somewhere within the data. It’s still necessary to zoom in on where.
Post-analysis tests come in two varieties — the kind you plan in advance, and
the kind you don’t. The first, planned comparisons, are motivated by your
ideas about what to expect before you gather the data. The second, post-hoc
tests, are motivated by what looks interesting in the data you gathered.
In an ANOVA, you perform those tests on group means. In an ANCOVA, you
adjust the group means (of the dependent variable) just as you adjust the SSs
and the MSs. You also adjust the error term (the denominator) of the tests.
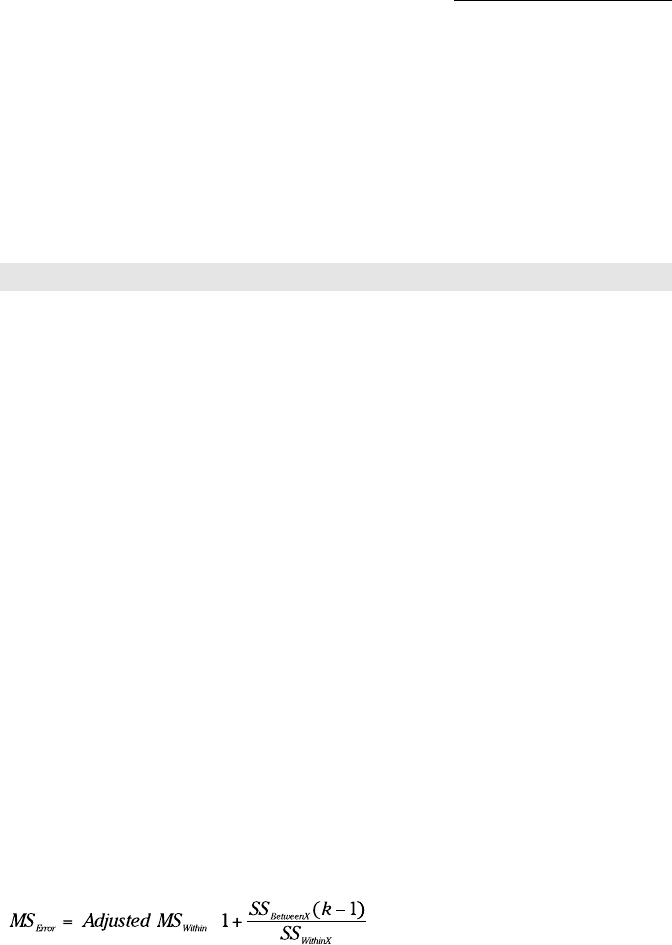
I deal here with planned comparisons. After adjusting the means (which I did
in each Method), the next step is to adjust the MS that goes into the denomi-
nator of the planned comparisons. I refer to the adjusted MS as and the way
to calculate it is
in which k is the number of groups.
30 454060-bapp02.indd 43030 454060-bapp02.indd 430 4/21/09 7:40:19 PM4/21/09 7:40:19 PM
431
Appendix B: The Analysis of Covariance
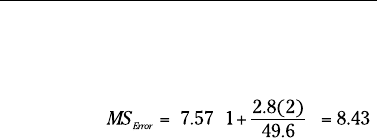
For our example, that’s
In the Method 1 worksheet, I select a cell and enter
=D24*(1+(I24*2)/I25)
I can now proceed with planned comparisons as I did in Chapter 12.
From all I show you here, it looks like Method 1 has the advantage over
Method 2. Using the ANOVA analysis tool gives you the values you need for
the planned comparisons, and it gives you the dependent-variable ANOVA to
compare against the ANCOVA.
With the data arranged as in Method 2, we can’t get all that information,
can we?
Yes we can. And that sets the stage for looking at a particular statistical anal-
ysis (ANOVA) in a new way, as I mention at the beginning of Method 2.
Read on.
And One More Thing
In several chapters of this book, you see the interplay between ANOVA and
Regression: After every regression analysis, ANOVA tests hypotheses about
regression ideas.
In this section, I turn things around: I take an exercise normally treatable
via ANOVA, turn it into a regression problem, and use regression to do an
analysis of variance. This is called the MRC (multiple regression/correlation)
approach. It’s based on the work of psychologist/statistician Jacob Cohen,
who in the late 1960s formulated the idea of multiple regression as a general
system for data analysis.
Without going into all the details, Cohen’s idea is that many kinds of data are
expressible in the format that regression operates on. Performing a regres-
sion analysis is all that’s necessary. In effect, various statistical techniques
then become special cases of the general system.
30 454060-bapp02.indd 43130 454060-bapp02.indd 431 4/21/09 7:40:20 PM4/21/09 7:40:20 PM
432
Statistical Analysis with Excel For Dummies, 2nd Edition
The dependent variable data in Table B-1 provide an opportunity to illustrate
this approach. With the groups identified under Tag1 and Tag2, and the Tags
as independent variables, ANOVA is exactly the same as multiple regression.
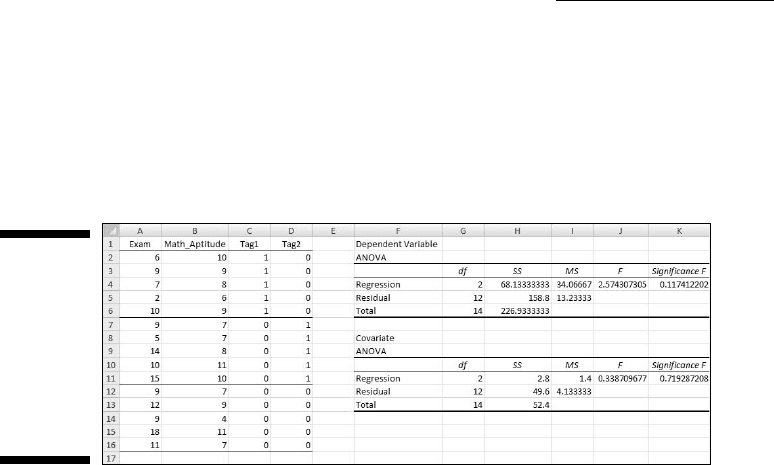
You might already be a step ahead of me. Figure B-3 shows the data laid out
as in Figure B-2, but with different analyses.
Figure B-3:
The
Method 2
ANCOVA
worksheet
with two
different
regression
analyses.
I ran the Regression analysis tool twice and directed the output to this work-
sheet both times. I deleted everything but the ANOVA from each output.
The first time I ran the tool, the Input Y Range was A2:A16 (Exam) and the
Input X Range was C2:D16 (Tag1 and Tag2). The result is the first ANOVA
table, just below the heading Dependent Variable.
The second time, the Input Y Range was B2:B16 (Math Aptitude) and the
Input X Range was C2:D16, resulting in the ANOVA table below the heading
Covariate.
Do the numbers look familiar? They should. They’re the same as the two
ANOVAs I ran for Method 1. The only difference, of course, is the names in
the Source of Variance column. Rather than Between and Within, these out-
puts display Regression and Residual.
To complete the post-analysis tests for Method 2 ANCOVA, you only need the
ANOVA for the covariate. I show you both to illustrate the MRC approach.
You can extend the MRC approach to more complex hypothesis tests, like
the ones I discuss in Chapter 13. When you do, it becomes a bit more compli-
cated: You have to know more about multiple regression and how it applies
to things like interaction. In any event, the MRC approach is definitely worth
looking into.
30 454060-bapp02.indd 43230 454060-bapp02.indd 432 4/21/09 7:40:20 PM4/21/09 7:40:20 PM

Appendix C
Of Stems, Leaves, Boxes,
Whiskers, and Smoothies
In This Chapter
▶ Stem-and-leaf tables
▶ Box-and-whisker charts
▶ Data smoothing
T
hroughout Part III, I discuss Excel capabilities for testing hypotheses.
The general process is that you formulate a hypothesis, gather data, and
use a statistical technique to test the hypothesis.
Famed statistician John Tukey referred to hypothesis testing as confirmatory
data analysis. He stressed, however, the importance of another process —
exploratory data analysis (EDA). As the name suggests, in this process you
explore data to find and illustrate features of interest, and perhaps generate
hypotheses to investigate further.
Tukey catalogued a wide array of techniques for exploring sets of data
and for presenting data sets in ways that make them easy to understand.
In this Appendix, I show you how to use Excel to implement three of those
techniques.
Stem-and-Leaf
Whenever I return an exam, naturally I tell the class the mean and the stan-
dard deviation, and what a score means in terms of a letter grade. If you read
Chapter 6, you know I do that in terms of z-scores.
31 454060-bapp03.indd 43331 454060-bapp03.indd 433 4/21/09 7:41:01 PM4/21/09 7:41:01 PM

434
Statistical Analysis with Excel For Dummies, 2nd Edition
What’s missing, though, is a sense of how the distribution of exam scores
looks. Even with a frequency distribution (Chapter 2), an individual doesn’t
know exactly where his or her score sits in the overall distribution.
Tukey’s stem-and-leaf display is a way around this. It organizes data so that
an entire distribution of scores is quickly and easily comprehensible.
The display breaks each score into two components: a leaf which is usually
the last digit of the score, and a stem which is everything else. The objective
is to create a layout that looks like Figure C-1.
Figure C-1:
A stem-and-
leaf plot.
Stem Leaves
9 0 3 8 8
8
7
6
5
4
0 2 3 3 5 5 7 8 8
0 2 2 2 2 5 7 7 7 8 8
0 5
3 7 7 8
5
In the display (also called a stemplot), the row labeled 9 means that all scores
in that row are between 90 and 99. The leaves — 0, 3, 8, and 8 — in that row
stand for scores of 90, 93, 98, and 98.
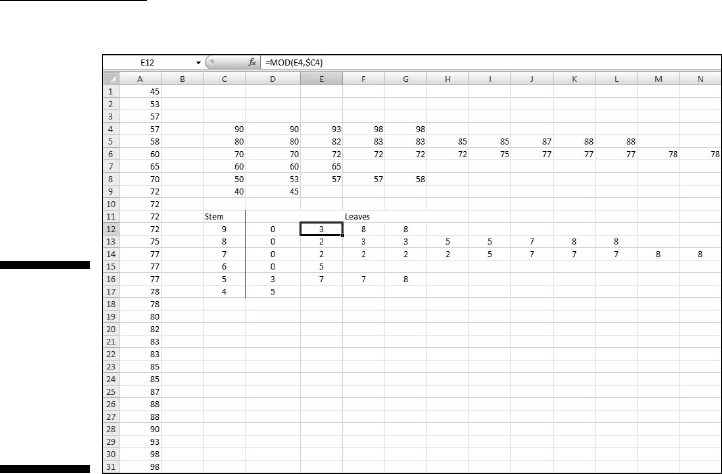
Figure C-2 shows an Excel worksheet with scores (in A1:A31), an intermediate
display, and a stem-and-leaf display like Figure C-1. The intermediate display
is the foundation for the stem-and-leaf display.
The first thing I did was arrange the scores in increasing order, which is how
they appear in A1:A31.
Next, I completed the intermediate display. I put numbers representing the
stems in a column. That’s 90, 80, 70, 60, 50, and 40 in C4:C9.
31 454060-bapp03.indd 43431 454060-bapp03.indd 434 4/21/09 7:41:01 PM4/21/09 7:41:01 PM
435
Appendix C: Of Stems, Leaves, Boxes, Whiskers, and Smoothies
Figure C-2:
An Excel
worksheet
with scores,
an inter-
mediate
table, and a
stemplot.
After that, I put the scores from column A into the appropriate row in the
intermediate display. Here are the steps for putting the data into the row:
1. For an intermediate display row, select the subset of scores from the
data column.
For the first row, I selected 90–98 from column A.
2. Right-click the selection and choose Copy from the pop-up menu.
3. Select the first cell for the row where the selected scores go.
I selected cell D4 to begin the first row.
4. Right-click the selected cell and choose Paste Special from the pop-up
menu to open the Paste Special dialog box.
5. In the Paste Special dialog box, choose Transpose.
This puts the selected column data into the row, with the scores in
increasing order.
Going through those steps for each row completes the intermediate display.
Then I completed the stem-and-leaf display. I began by putting the stems into
a column: 9, 8, 7, 6, 5, and 4 into C12:C17. Then I used the MOD function to
add the leaves. The MOD function takes two arguments — a number and a
31 454060-bapp03.indd 43531 454060-bapp03.indd 435 4/21/09 7:41:02 PM4/21/09 7:41:02 PM
436
Statistical Analysis with Excel For Dummies, 2nd Edition
divisor — and returns the remainder. Here are the steps for using MOD and
finishing the display.
1. Select the first cell for the leaf row.
I selected D12, the highlighted cell in Figure C-2.
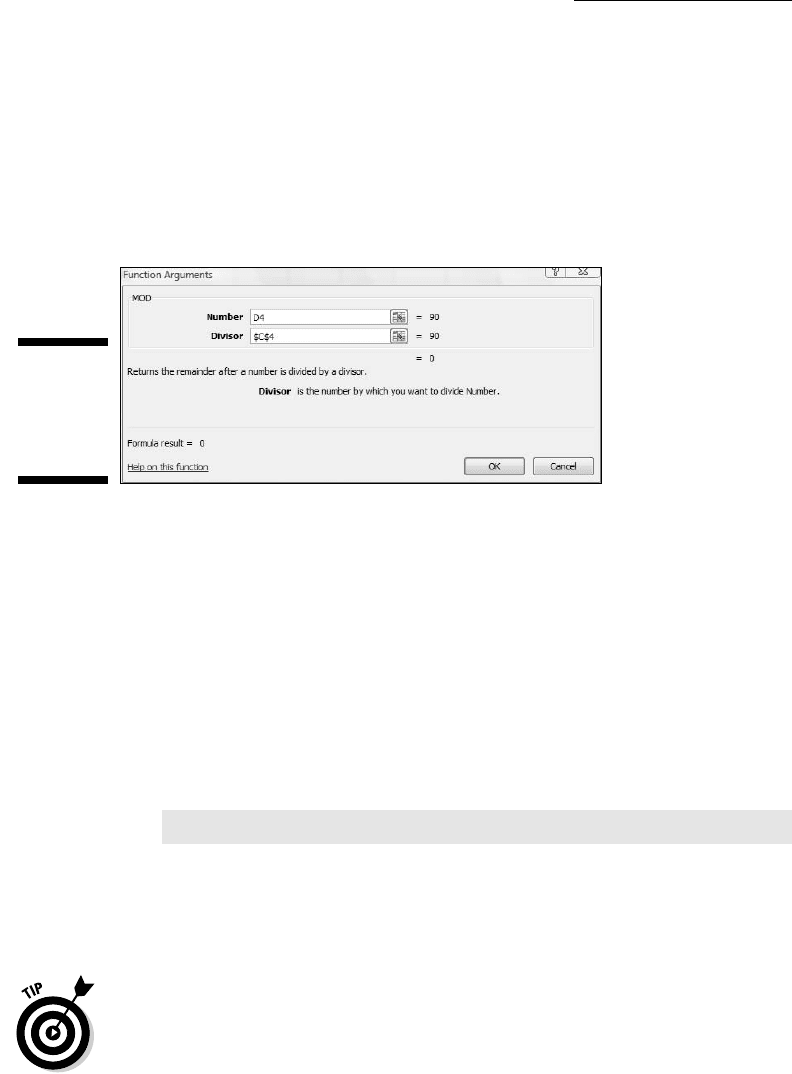
2. From the Math & Trig menu, select MOD to open the Function
Arguments dialog box for MOD. (See Figure C-3.)
Figure C-3:
The MOD
Function
Arguments
dialog box.
3. In the Function Arguments dialog box, enter the values for the
arguments.
For Number, I want the corresponding entry in the intermediate table,
so that’s D4.
For Divisor, I want the intermediate display number that corresponds to
the stem. That’s cell C4. I also want C4 to be the divisor when I autofill
the remaining cells in the row, so I press the F4 key to turn C4 into $C$4.
4. Click OK to close the dialog box and place the calculated value into
the selected cell.
Figure A3-2 shows the Formula bar displaying the formula for D12:
=MOD(D4,$C$4)
5. Autofill the row with the same number of scores as the row in the
intermediate table.
Complete these five steps for each row and you have a stem-and-leaf display.
I added the label Stem and the label Leaves.
To make everything look nicer for pasting to Powerpoint, I merged the cell
holding the Leaves label with a few of the cells to its right.
31 454060-bapp03.indd 43631 454060-bapp03.indd 436 4/21/09 7:41:02 PM4/21/09 7:41:02 PM
437
Appendix C: Of Stems, Leaves, Boxes, Whiskers, and Smoothies
After pasting to PowerPoint, stretching the copy and enlarging the font make
everything clearer.
Consider the stem-and-leaf display next time you have to present a distribu-
tion of scores.
Boxes and Whiskers
In Chapter 20, I describe a way of using Excel to put the standard error of the
mean into a graph. It’s a great way of adding information to a graph that shows
means of a dependent variable versus values of an independent variable.
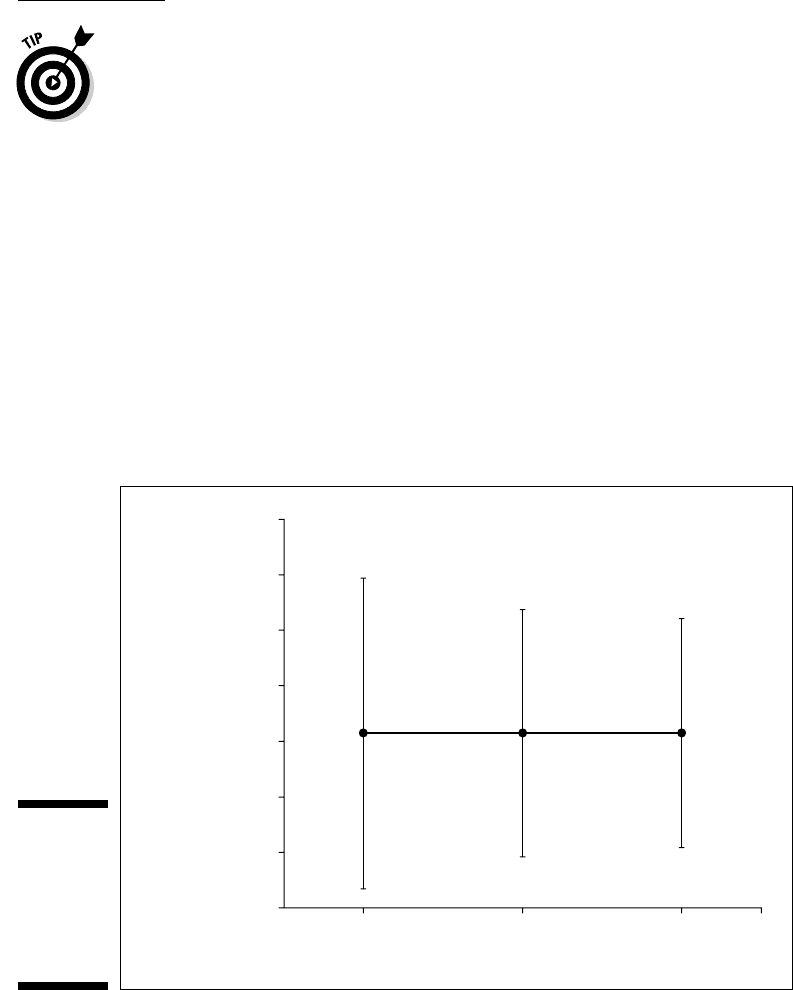
Figure C-4 shows the Internet connections per district in the fictional eight-
district Farchadat County for the years 2006–2008, along with the standard
error for each mean.
Figure C-4:
Internet
connections
per district,
Farchadat
county,
2006–2008.
Internet
Connections
per District
850
800
750
700
650
600
550
500
2006 2007
Year
2008
31 454060-bapp03.indd 43731 454060-bapp03.indd 437 4/21/09 7:41:02 PM4/21/09 7:41:02 PM

438
Statistical Analysis with Excel For Dummies, 2nd Edition
Does this chart tell the whole story? Do you really get a sense of the underly-
ing data? Take a look at Table C-1 before you answer.
Table C-1 Number of Internet Connections in
Farchadat County, 2006–2008
District 2006 2007 2008
1 1,140 957 1,179
2 1,460 960 824
3 489 496 652
4 594 871 651
5 502 732 765
6 508 908 696
7 370 119 390
8 200 220 106
That’s the data summarized in Figure C-4. As you can see, the numbers are
quite a bit different from year to year, even though the means are the same
and the standard errors (particularly for 2007 and 2008) are pretty similar.
If you had to present the information to a Farchadat audience, you couldn’t
just show them all the numbers. That would make everyone’s eyes glaze over
and they’d quickly lose interest. So Figure C-4 doesn’t give enough detail and
Table C-1 gives way too much.
What do you do?
Instead of showing the mean and the standard error, the box-and-whisker
plot shows the minimum, first quartile, median, third quartile, and maximum
of a set of data. Statisticians refer to this set of statistics as a five-number
summary.
You represent each five-number summary as a box with “whiskers.” The
box is bounded on the top by the third quartile, on the bottom by the first
quartile. The median divides the box. How you lay out the chart determines
the width of the box. The whiskers are error bars: One extends upward from
the third quartile to the maximum, the other extends downward from the
first quartile to the minimum.
Figure C-5 shows this. Notice that the median isn’t necessarily in the middle
of the box and the whiskers aren’t necessarily the same length.
31 454060-bapp03.indd 43831 454060-bapp03.indd 438 4/21/09 7:41:02 PM4/21/09 7:41:02 PM