Schmuller J. Statistical Analysis with Excel For Dummies
Подождите немного. Документ загружается.

439
Appendix C: Of Stems, Leaves, Boxes, Whiskers, and Smoothies
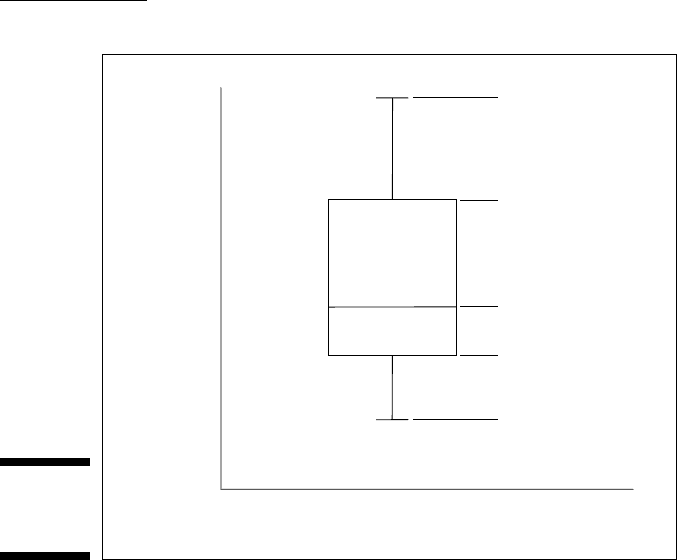
Figure C-5:
A box with
whiskers.
Independent Variable
Dependent
Variable
First Quartile
Third Quartile
Median
Maximum
Minimum
Surprisingly, Excel doesn’t offer a box-and-whisker chart. Instead, I show you
how to cajole a type of Excel chart into boxes and whiskers. Full disclosure:
The method I show you here isn’t original. It draws heavily (okay, entirely)
from the work of Jon Peltier. Check out Jon’s Web site (peltiertech.com)
for all kinds of great ideas.
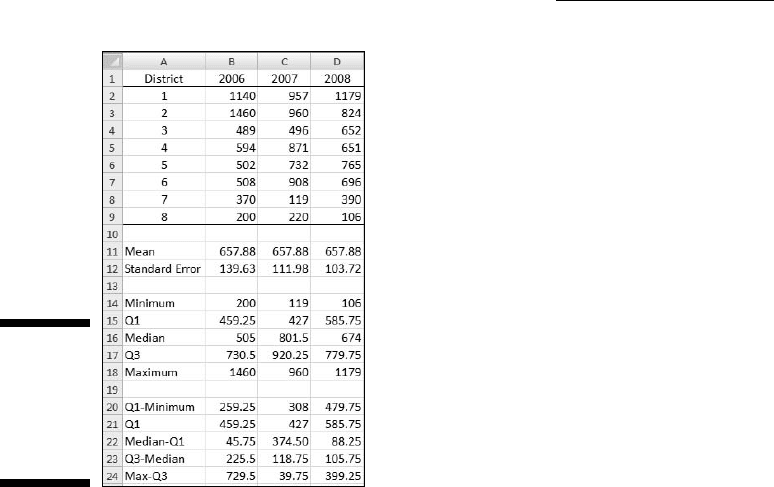
The first order of business is to put the data into a worksheet and start com-
puting some statistics. Figure C-6 shows the worksheet and the statistics.
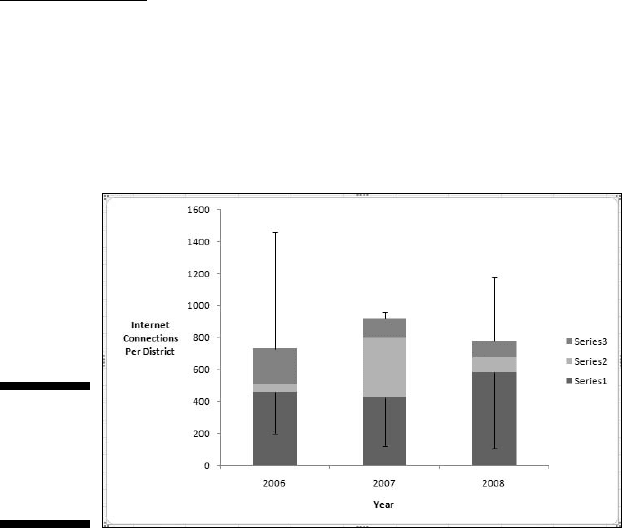
I used the Mean and Standard Error to create the chart in Figure C-4. I use
everything else to create a box-and-whisker plot for the data.
The next group of statistics holds the values for the five-number summary.
I use MIN to find the minimum value for each year and MAX to find the
maximum value. (See Chapter 7.) QUARTILE (Chapter 6) computes the first
quartile and the third quartile. Not surprisingly, MEDIAN (Chapter 4) deter-
mines the median.
The final group of statistics holds the values I put directly into the box-and-
whisker plot. Why is this group necessary?
31 454060-bapp03.indd 43931 454060-bapp03.indd 439 4/21/09 7:41:02 PM4/21/09 7:41:02 PM
440
Statistical Analysis with Excel For Dummies, 2nd Edition
Figure C-6:
Worksheet
for a
box-And-
whiskers
plot.
I’m about to turn a Stacked Column chart (Chapter 3) into a box-and-whisker
plot. In a stacked column, each segment’s size is proportional to how much it
contributes to the size of the column. In a box-and-whisker box, however, the
size of a segment represents a difference between one value and another —
like the difference between the quartile and the median, or between the median
and the first quartile.
So the box is really a stacked column with three segments. The first segment
is the first quartile. The second is the difference between the median and the
first quartile. The third is the difference between the third quartile and the
median.
But wait. Won’t that just look like a column that starts at the x-axis? Not after
I make the first segment disappear!
The other two differences — between the maximum and the third quartile
and between the first quartile and the minimum — become the whiskers.
Follow these steps after you calculate all the statistics you see in Figure C-6.
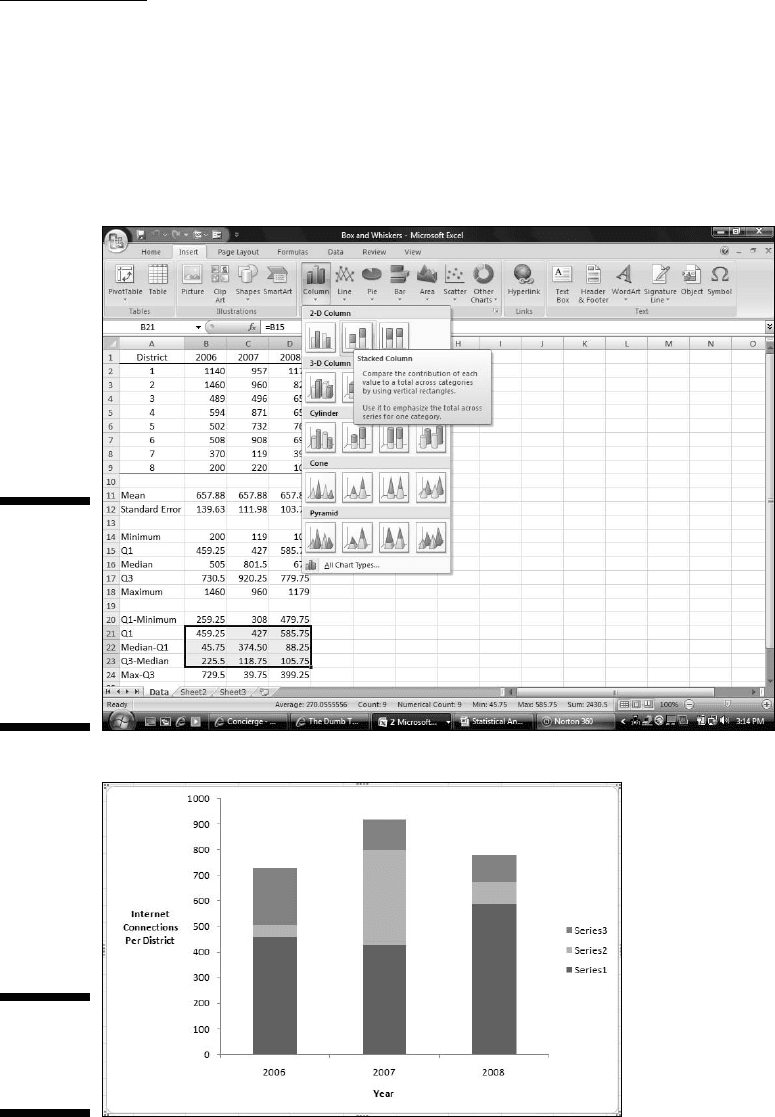
1. Select the data for the boxes in the box-and-whisker plot.
In this worksheet, that’s B21:D23. Row 20 and Row 24 don’t figure into
this step.
31 454060-bapp03.indd 44031 454060-bapp03.indd 440 4/21/09 7:41:03 PM4/21/09 7:41:03 PM
441
Appendix C: Of Stems, Leaves, Boxes, Whiskers, and Smoothies
2. Select Insert | Column | Stacked Column to add a stacked column
chart to the worksheet.
Figure C-7 shows Steps 1 and 2.
Figure C-8 shows what the stacked column chart looks like after I insert it,
delete the gridlines, and reformat and title the axes.
Figure C-7:
Selecting
the
Box-And-
Whiskers
data and
inserting a
stacked col-
umn chart.
Figure C-8:
The stacked
column
chart.
31 454060-bapp03.indd 44131 454060-bapp03.indd 441 4/21/09 7:41:03 PM4/21/09 7:41:03 PM
442
Statistical Analysis with Excel For Dummies, 2nd Edition
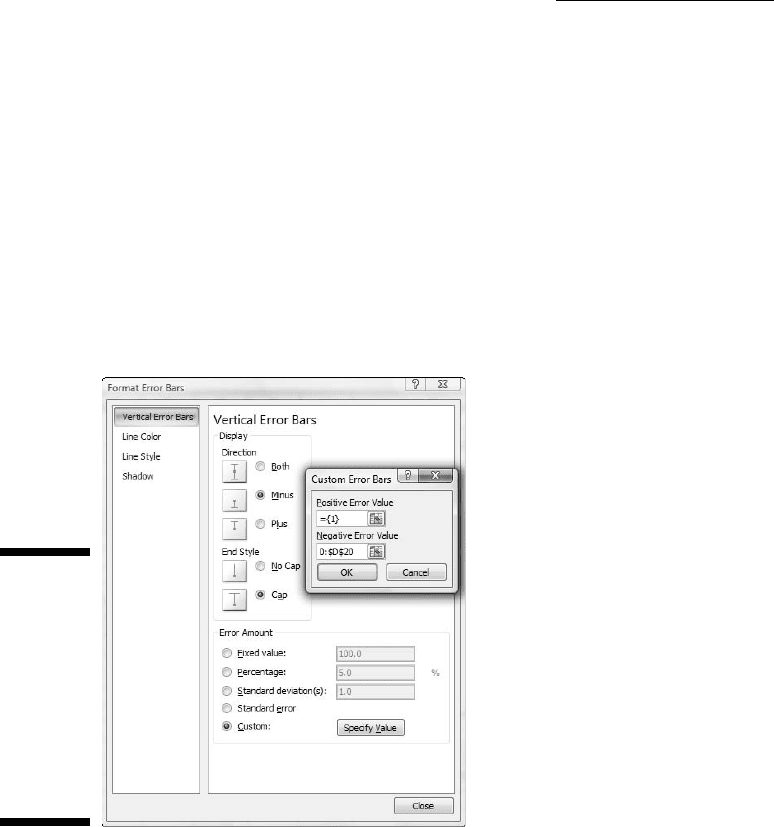
3. Add the whiskers.
This is a lot like what I discuss in Chapter 20 when I show how to add
standard errors to a chart.
First, I add the lower whiskers. With Series 1 selected, I click Layout |
Error Bars and pick More Error Bars Options from the menu.
This opens the Format Error Bars dialog box. I select the Minus radio
button, the Cap radio button, and the Custom radio button.
Then I click the Specify Value button to open the Custom Error Bars
dialog box. Leaving the Positive Error Value as is, I specify the cell
range for the Negative Error Value. For this worksheet, that’s B20:D20
(Q1-Minimum). Figure C-9 shows the dialog boxes.
Figure C-9:
Using the
Format Error
Bars dialog
box and
the Custom
Error Bars
dialog box
to add
the lower
whiskers.
4. Clicking OK closes this dialog box, and clicking Close closes the
Format Errors dialog box.
I follow similar steps to add the upper whiskers. This time I select
Series 3. Then as before, I click Layout | Error Bars and More Error Bars
Options. This time in the Format Errors dialog box I select the Plus radio
button, the Cap radio button, and the Custom radio button.
31 454060-bapp03.indd 44231 454060-bapp03.indd 442 4/21/09 7:41:03 PM4/21/09 7:41:03 PM
443
Appendix C: Of Stems, Leaves, Boxes, Whiskers, and Smoothies
Again, I click the Specify Value button to open the Custom Error Bars
dialog box. This time, I specify the cell range for the Positive Error
Value. That cell range is B24:D24 (Max-Q3). I click OK and Close.
Figure C-10 shows what the chart looks like after these steps.
Figure C-10:
The stacked
column
chart with
whiskers.
5. Make the bottom segments disappear.
To give the appearance of boxes rather than stacked columns, I select
Series 1 (the bottom segment of each column), right-click and choose
Format Data Series from the pop-up menu to open the Format Data
Series dialog box.
In the Format Data Series dialog box, I select Fill and click the No Fill radio
button. Then I select Border Color and click the No Line radio button.
Clicking Close closes the dialog box. Figure C-11 shows the appearance
of the chart.
6. Reformat the remaining series to complete the box-and-whiskers plot.
I select Series 2, right-click and pick Format Data Series from the pop-up
menu. I select Fill and click the No Fill radio button.
Then I select Border Color and click the Solid Line radio button. I click
the Color Button and select black from the Theme Colors palette.
I click Close, and then go through the same sequence for Series 3.
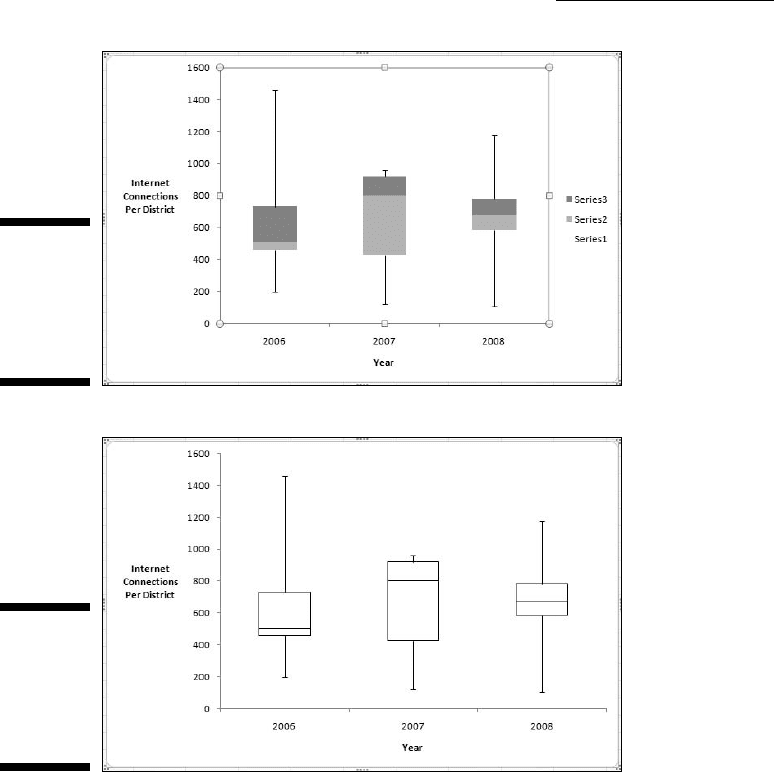
After that, I delete the legend. Voilà — Figure C-12! I can add another
data series that shows where the means are, and another that would
allow me to connect the medians, but this is enough for now.
31 454060-bapp03.indd 44331 454060-bapp03.indd 443 4/21/09 7:41:04 PM4/21/09 7:41:04 PM
444
Statistical Analysis with Excel For Dummies, 2nd Edition
Figure C-11:
The almost-
finished
box-and-
whiskers
plot.
Figure C-12:
The
completed
box-and-
whiskers
plot.
The box-and-whiskers plot shows important aspects of the data you can’t
see in Figure C-4. One feature it shows is skewness (see Chapter 7): Although
the means are identical and the standard errors pretty similar, the skewness
differs from year to year. You see this in the position of the median within
the box, and in the relative lengths of a box’s whiskers. The data for 2006 are
positively skewed, the data for 2007 are negatively skewed, and the data for
2008 are nearly symmetrical (slightly negative, to be exact).
Another feature the box-and-whiskers plot shows is kurtosis (see Chapter 7) —
how flat or how peaked the data are. Positive kurtosis means a frequency chart
of the data would show a peak. Negative kurtosis means a frequency chart of
the data would show flatness. The height of the box is the clue here. A longer
box suggests negative kurtosis, a shorter box suggests positive kurtosis.
31 454060-bapp03.indd 44431 454060-bapp03.indd 444 4/21/09 7:41:04 PM4/21/09 7:41:04 PM
445
Appendix C: Of Stems, Leaves, Boxes, Whiskers, and Smoothies
For 2008, the data have positive kurtosis, for 2007 the data have negative kur-
tosis. For 2006, the kurtosis is positive, but less so than for 2008. Admittedly,
kurtosis doesn’t mean much with just eight scores. With a larger number,
around 30, this feature takes on greater importance.
What’s the point of all this? The information about skewness, at least, would
probably cause a Farchadat analyst to look at why a particular district might
be an outlier one year and perhaps not the next.
Data Smoothing
Statisticians typically have to look at large masses of data and find hard-to-
see patterns. Sometimes an overall trend suggests a particular analytic tool.
And sometimes that tool, while statistically powerful, doesn’t help the statis-
tician arrive at an explanation.
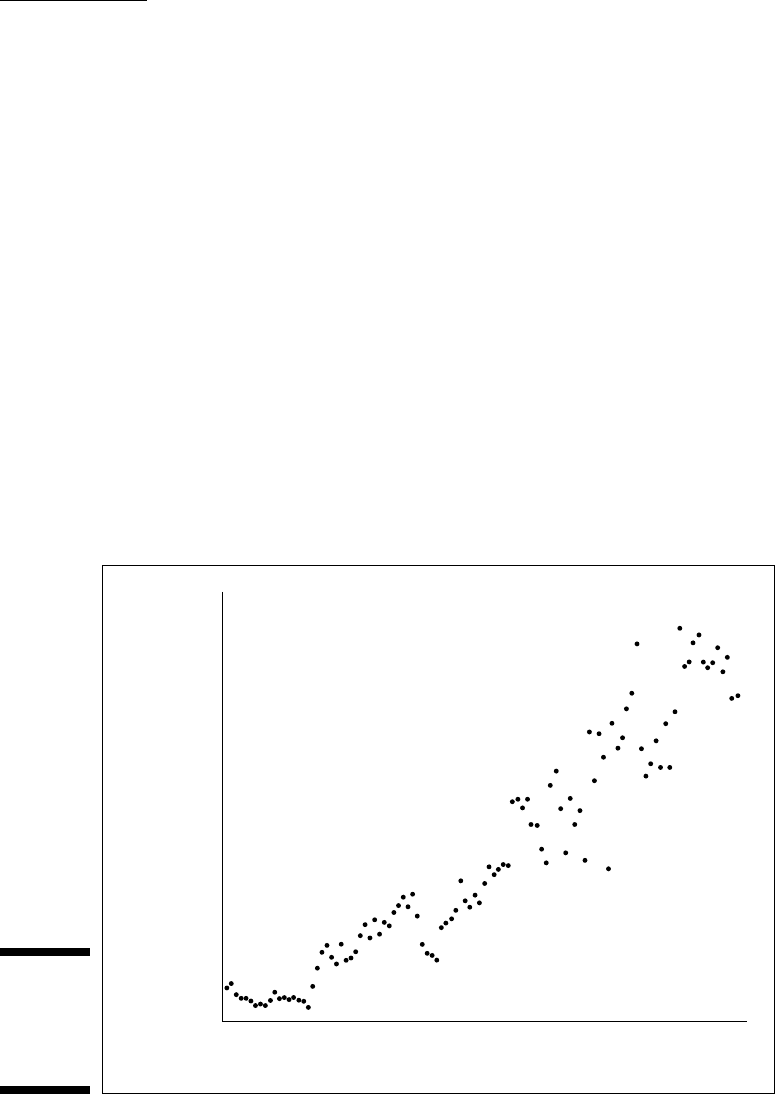
And so it is with Figure C-13, a chart of home runs hit in the American League
from 1901 until 2008. (Yes, I know — yet another baseball example. Bear with
me. Even if you’re not a fan, I think you can appreciate the thought process.)
Figure C-13:
Home Runs,
American
League,
1901–2008.
Home Runs
Year
1500
1000
500
0
1900 1910 1920 1930 1940 1950 1960 1970 1980 1990 2000 2010
2000
2500
3000
31 454060-bapp03.indd 44531 454060-bapp03.indd 445 4/21/09 7:41:04 PM4/21/09 7:41:04 PM

446
Statistical Analysis with Excel For Dummies, 2nd Edition
The obvious overall trend is that as the years go by, more home runs are hit.
Fitting a regression line confirms this idea. The equation
Home Runs = 24.325*Year – 465395
is a terrific fit to the data. The equation gives an R-Squared value of 0.91, indi-
cating that a linear model nicely describes the relationship between home
runs and years.
And so . . . what?
Just fitting a regression line glosses over important things within baseball —
things both great and small that make up a baseball season, an era, a history.
And baseball has many of those things. The objective is to get them to reveal
themselves.
The other extreme from the regression line is to connect the dots. That
would just give a bunch of zigzags that likely won’t illuminate a century of
history.
The problem is similar to what I discuss in the preceding section — how
to rise above the details without glossing over everything. In other words,
summarize without eliminating too much: Get rid of the zigzags but keep
the important peaks and valleys. How do we do this without knowing what’s
important in advance?
EDA helps point the way. One of Tukey’s EDA techniques is called three-
median smoothing. For each data point in a series, replace that data point
with the median of three numbers: the data point itself, the data point that
precedes it, and the data point that follows. Here’s a formula:
Why the median? Unlike the mean, the median is not sensitive to extreme
values that occur once in awhile — like a zig or a zag. (See Chapter 4 if this
sounds unfamiliar.) The effect is to filter out the noise and leave meaningful
ups and downs.
Why three numbers? Like most everything in EDA, that’s not ironclad. For
some sets of data you might want the median to cover more numbers. It’s up
to the intuitions, experiences, and ideas of the analyst.
31 454060-bapp03.indd 44631 454060-bapp03.indd 446 4/21/09 7:41:04 PM4/21/09 7:41:04 PM
447
Appendix C: Of Stems, Leaves, Boxes, Whiskers, and Smoothies
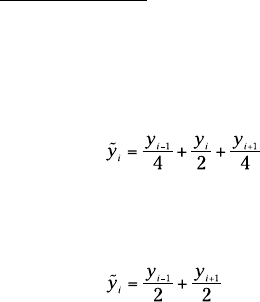
Another of Tukey’s techniques is called hanning. This is a running weighted
mean. You replace a data point with the sum of one fourth the previous data
point plus half the data point plus one fourth the next data point. The formula:
Still another technique is the skip mean. For this one, I let the formula tell the
story:
Tukey provides a number of others, but I confine the discussion to these
three.
In EDA, you don’t just use one technique on a set of data. Often, you start
with a median smooth, repeat it several times, and then try one or two
others.
For the data in the scatterplot in Figure C-13, I applied the three-median
smooth, repeated it (that is, I applied it to the newly smoothed data), hanned
the smoothed data, and then applied the skip mean. Again, no technique (or
order of techniques) is right or wrong. You apply what you think illuminates
meaningful features of the data.
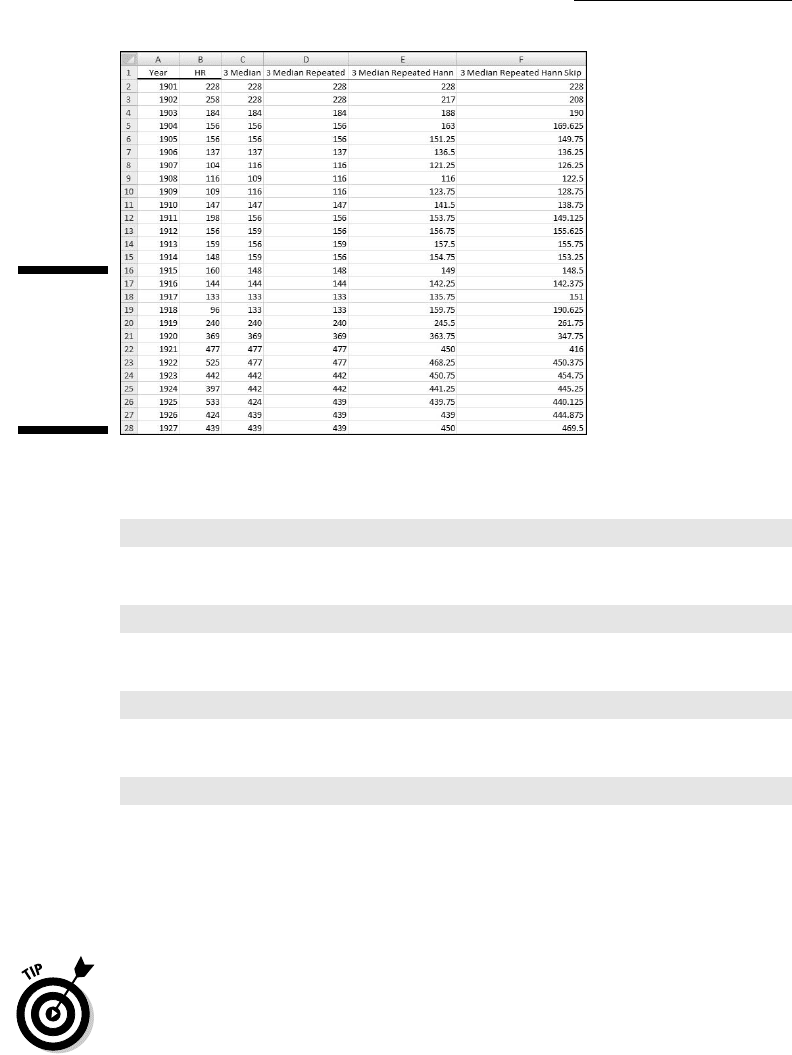
Figure C-14 shows part of a worksheet for all of this. I obviously couldn’t fit
all 108 years in one screenshot, but this gives you the idea. Column A shows
the year, column B the number of home runs hit that year in the American
League. The remaining columns show successive smooths of the data.
Column C applies the three-median smooth to column B, column D applies
the three-median smooth to column C. A quick look at the numbers shows
that the repetition didn’t make much difference. Column E applies hanning to
column D, and column F applies the skip mean to column E. In columns C–F,
I used the actual number of home runs for the first value (for the year 1901)
and for the final value (for the year 2008).
Just to clue you in on how I arrived at the smoothed values, here are the
worksheet formulas for a typical cell in each column.
31 454060-bapp03.indd 44731 454060-bapp03.indd 447 4/21/09 7:41:04 PM4/21/09 7:41:04 PM
448
Statistical Analysis with Excel For Dummies, 2nd Edition
Figure C-14:
A worksheet
for smooth-
ing the data
in Figure
C-13.
For cell C3, the formula is
=MEDIAN(B2:B4)
For D3, it’s
=MEDIAN(B2:B4)
For E3
=(D2/4)+(D3/2)+(D4/4)
And for F3
=(E2/2)+(E4/2)
I autofilled each column, except for the first value and the final value.
Next, I superimposed the numbers in column F as a series on the scatterplot.
I formatted the series to have a solid line and no markers. Figure C-15 shows
this. I refer to that solid line as “the smoothed line.”
You can easily watch the effect of each successive smoothing technique on
the smoothed line. The key is to right-click on the plot area and choose Select
Data from the pop-up menu. Click on the name of the data series that repre-
sents the smoothed line, edit the cell range of the series to reflect the column
that holds the particular smoothing technique, and click OK to close the edit-
ing dialog boxes.
31 454060-bapp03.indd 44831 454060-bapp03.indd 448 4/21/09 7:41:04 PM4/21/09 7:41:04 PM