Schmuller J. Statistical Analysis with Excel For Dummies
Подождите немного. Документ загружается.

449
Appendix C: Of Stems, Leaves, Boxes, Whiskers, and Smoothies
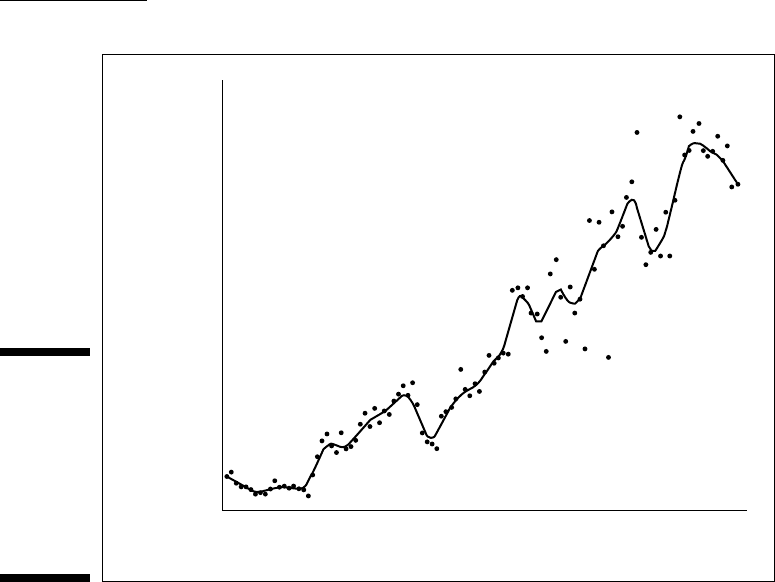
Figure C-15:
The
smoothed
data for
home
runs in the
American
League,
1901–2008.
Home Runs
Year
1500
1000
500
0
1900 1910 1920 1930 1940 1950 1960 1970 1980 1990 2000 2010
2000
2500
3000
And now the story begins to reveal itself. Instead of a regression line that
just tells us that home runs increase as the years go by, the highs and lows
stimulate thinking as to why they’re there. Here’s a highly abridged version
of baseball history consistent with the twists and turns of the smoothed line.
The low flat segment from 1901 until 1920 signifies the “dead-ball era,” a time
when the composition of a baseball inhibited batted balls from going far
enough to become home runs.
As the 1920s began, however, a gentleman named George Herman Ruth (see
Chapter 6) began whacking them out of American League ballparks with
alarming regularity. Noting that this induced many to attend said ballparks,
the powers that be (so the story goes) livened up the baseball to make the
home run a more frequent event. This most likely accounts for the steady
rise in the smoothed line until the 1940s.
Why the sudden decline after 1940? World history played a role: World War II
took many of the best players and home-run production declined. In the late
1940s, they came back. This provided the initial impetus for the ensuing rise
in home runs. After that, the long-overdue diversification of the talent pool
helped home-run output increase steadily until the beginning of the ’60s.
31 454060-bapp03.indd 44931 454060-bapp03.indd 449 4/21/09 7:41:05 PM4/21/09 7:41:05 PM

450
Statistical Analysis with Excel For Dummies, 2nd Edition
From then on, the smoothed line shows a series of peaks and valleys. A
number of influences caused the peaks. The valleys most likely indicate
pitchers adapting, learning, and perfecting their craft.
First peak: 1961 brought expansion, and two new teams joined the American
League. The League stocked the new teams with players from the established
teams. The result was that the pool of pitchers thinned out — the number of
talented pitchers per team declined, and batters took advantage, causing a
sudden rise in home runs after the steady increase through the ’40s and ’50s.
My best guess is that pitching improved, because home-run production
declined in the late ’60s. Then the powers that be intervened again by chang-
ing the rules. The pitcher delivers the ball starting from a standing position
on a raised area called “the mound” 60 feet 6 inches from home plate. In
order to reduce the pitcher’s leverage and thereby increase batting produc-
tion, baseball’s overseers lowered the height of the mound in 1969. Coupled
with another expansion that year (two additional teams), home-run produc-
tion rose again.
In 1973, the American League (but not the National League) changed its rules
yet again to improve batting production. Instead of letting notoriously weak-
hitting pitchers bat, the League invented the role of the designated hitter.
The designated hitter has one job — to bat in place of the pitcher.
With the removal of weak hitters from team batting orders, I expected
an immediate dramatic increase in home runs. It didn’t happen that way.
Instead, the smoothed line dips a bit and then increases steadily, if undramat-
ically, for the1970s. The introduction of the designated hitter likely affected
baseball in a variety of ways that aren’t immediately obvious. I’m sure saber-
metricians (see Chapter 13) have addressed those possibilities.
In 1977, the American League added two more teams, coinciding with another
rise in home runs that continued until the early ’80s. Pitchers apparently
adapted, and home runs declined until the early ’90s.
Then something seems to have fueled home-run production, peaking around
1998 when the League expanded again and added another team. Many have
speculated on what juiced up this increase, but that’s beyond the scope of
this discussion. As the smoothed line shows, home runs are in a period of
decline lately. Hmmm . . .
I had a lot of fun writing this capsule summary of baseball history and show-
ing how events (as I see them) coincided with the peaks and valleys in the
smoothed line. My knowledge is a little stronger on what might have caused
the peaks, less so on the valleys. I assume “pitchers adapting” accounts
31 454060-bapp03.indd 45031 454060-bapp03.indd 450 4/21/09 7:41:05 PM4/21/09 7:41:05 PM

451
Appendix C: Of Stems, Leaves, Boxes, Whiskers, and Smoothies
for the valleys, but I’m not certain. Did they really adapt? If so, how? Did
anything else have an influence? (Strike-shortened seasons, for example?)
Knowing about the valleys causes me to form hypotheses and test them — in
this case, perhaps, by examining other statistics from the appropriate eras.
For completeness, I have to verify my ideas about the peaks, too.
Bottom line: Exploring and visualizing the data stimulates thought about
what’s producing the patterns the exploration uncovers. Speculation leads to
testable hypotheses, which lead to analysis. As Tukey said in the preface to his
book Exploratory Data Analysis (Addison-Wesley, 1977): “The greatest value of
a picture is when it forces us to notice what we never expected to see.”
I don’t think he was just talking about the designated hitter.
A SMOOTH add-in for Excel
EDA should be in the toolset of every statisti-
cian. If you want to get more heavily into data
smoothing, visit quantdec.com, the Web site of
Pennsylvania-based Quantitative Decisions.
Founder Bill Huber has developed a free Excel
add-in that incorporates all of Tukey’s data
smoothing techniques. (More than the ones I
tell you about here.) It’s called SMOOTH. After
you download and install it in your spreadsheet,
SMOOTH appears in the Statistical Functions
menu. Each time you invoke SMOOTH you can
apply a number of techniques successively. For
example, in one run of SMOOTH, I can apply the
four techniques I use for the home-run data.
31 454060-bapp03.indd 45131 454060-bapp03.indd 451 4/21/09 7:41:05 PM4/21/09 7:41:05 PM

452
Statistical Analysis with Excel For Dummies, 2nd Edition
31 454060-bapp03.indd 45231 454060-bapp03.indd 452 4/21/09 7:41:05 PM4/21/09 7:41:05 PM

Index
• A •
a posteriori tests. See unplanned
comparisons
a priori tests. See planned comparisons
absolute referencing. See also referencing
cells
converting relative references to, 24–25
de ned, 24
de ned names and, 46
absolute values, 108
Add-Ins dialog box, 49
alpha
Anova: Single Factor tool, 229
Anova: Two-Factor with Replication tool,
253
Anova: Two-Factor without Replication
tool, 239, 247
de ned, 172
F-Test Two Sample for Variances tool, 215
increasing, 219
Regression tool, 278, 288
t-test: Paired Two Sample for Means tool,
206
t-Test: Two Sample tool, 200
alternative hypotheses. See also
hypotheses
data importance, 171
decisions, 172
de ned, 15, 171
statistical notation, 15
testing versus null hypothesis, 173
analysis of covariance (ANCOVA). See also
covariance; covariance analysis
ANOVA method, 423–427
bene t of, 427
de ned, 421–422
in Excel, 422–431
F-ratio and, 422
outputs, 426
planned comparisons, 430
post-hoc tests and, 430
regression method, 427–430
table, 425–426
analysis of variance (ANOVA). See also
variances
calculations, 228
de ned, 222
dependent-variable, 431
F-ratio denominator, 222
multiple regression and, 432
one-factor, 222
post t-tests, 224
repeated measures, 232–235
two-factor, 244–245
AND function, 106
ANOVA. See analysis of variance
ANOVA method (ANCOVA), 423–427
Anova: Single Factor
alpha, 229
ANOVA table, 229
cell ranges, 229
de ned, 47
dialog box, 228
output, 230
SUMMARY table, 229
use steps, 229
Anova: Two-Factor with Replication
alpha, 253
ANOVA table, 253
cell ranges, 253
de ned, 47, 252
dialog box, 252
output, 254
output options, 253
SUMMARY table, 253
use steps, 252–253
Anova: Two-Factor without Replication
alpha, 239, 247
ANOVA table, 240, 247
cell ranges, 239, 247
de ned, 47, 238
dialog box, 239, 246
output, 240, 247
32 454060-bindex.indd 45332 454060-bindex.indd 453 4/21/09 7:41:38 PM4/21/09 7:41:38 PM

454
Statistical Analysis with Excel For Dummies, 2nd Edition
Anova: Two-Factor without Replication
(continued)
output options, 239, 247
SUMMARY table, 240, 247
for two-factor ANOVA, 246–247
use steps, 239, 246–247
arguments
AND function, 106
AVEDEV function, 109
AVERAGE function, 82
AVERAGEA function, 82
AVERAGEIF function, 84
AVERAGEIFS function, 85, 86
BETADIST function, 337–338
BETAINV function, 339
BINOMDIST function, 327
CHIDIST function, 183
CHIINV function, 184
CHITEST function, 358, 387
COMBIN function, 322
CONFIDENCE function, 165–166
CORREL function, 300, 301
COUNT function, 124
COUNTBLANK function, 125
COUNTIF function, 125
COUNTIFS function, 126
CRITBINOM function, 330–331
DCOUNT function, 408, 409
de ned, 30
DEVSQ function, 108
entering, 31
EXPONDIST function, 346–347
FACT function, 321
FDIST function, 212
FINV function, 213
FISHER function, 309
FORECAST function, 271
FREQUENCY function, 37
FTEST function, 210
GAMMADIST function, 344–345
GAMMAINV function, 345
GROWTH function, 398, 399, 400
HYPERGEOMDIST function, 333–334
IF function, 106
INTERCEPT function, 270, 271
KURT function, 131, 132
LINEST function, 275–276
LOGEST function, 395, 396
LOGINV function, 394
LOGNORMDIST function, 394
MAX function, 127
MEDIAN function, 90, 91
MOD function, 436
MODE function, 92
NEGBINOMDIST function, 328–329
NORMDIST function, 145, 146
NORMINV function, 146, 147
NORMSDIST de ned, 149
NORMSINV function, 149
PEARSON function, 300–301
PERCENTILE function, 119
PERCENTRANK function, 120
PERMUT function, 321–322
POISSON function, 341–342
PROB function, 383
QUARTILE function, 120
RANK function, 117
SKEW function, 129, 130
SLOPE function, 270
STANDARDIZE function, 114, 115
STDEV function, 103
STDEVP function, 101, 102
STEYX function, 270, 271
SUM function, 33
SUMIF function, 43, 44, 45
TDIST function, 180
TINV function, 168
TREND function, 272–273, 274
TRIMMEAN function, 87
TTEST function, 197–198, 204
VAR function, 100
VARP function, 97
VARPA function, 98
WEIBULL function, 384
ZTEST function, 178
array formulas
creating, 46–47
results, 47
typing, 46
array functions. See also functions; specifi c
functions
de ned, 35
example, 35–37
arrays. See also cells
nding frequencies in, 133
FTEST function, 211
intervals, 37
names, de ning, 38
32 454060-bindex.indd 45432 454060-bindex.indd 454 4/21/09 7:41:38 PM4/21/09 7:41:38 PM

455455
Index
referring to, 38
right-clicking, 39
selecting, 40
unnamed, 45
z-scores, 116
asymptotic curves, 144
auto lling cells
absolute referencing, 24
bene ts, 21
de ned, 20
incorrect, 23
from named arrays, 46
relative referencing, 23
using, 21–22
AVEDEV function, 109
average absolute deviation, 109
average deviation, 108–109
AVERAGE function
accessing, 51
de ned, 81
formulas, 82, 161
Function Arguments dialog box, 82
with STDEV function, 103
steps, 81–82
using, 364
working with, 81
AVERAGEA function
de ned, 82
evaluation, 83
Function Arguments dialog box, 82
steps, 82
AVERAGEIF function
de ned, 20, 83
formula creation, 84–85
formulas, 84
Function Arguments dialog box, 84
AVERAGEIFS function
de ned, 20, 83
formula creation, 86
Function Arguments dialog box, 85, 86
averages. See also means
deviation, 95
moving, 376
reporting, 25
trial, 85, 105
axes. See also x-axis; y-axis
horizontal, 57, 142
knowing, 372
pie charts and, 57
titles, 61
vertical, 57, 142
Axis Labels dialog box, 70, 71
• B •
bar graphs. See also graphs
bars, darkening, 73
creating, 72–73
data selection, 72
de ned, 57, 71
illustrated, 72
layout, 73
modifying, 73
type selection, 72
uses, 71
bases, 389–390
bell curve
de ned, 142
illustrated, 142
as normal distribution, 143
best tting line, 294
beta distribution
applicability, 338
binomial connection, 335
cumulative, working with, 337–338
de ned, 335
random variable, 335
BETADIST function
de ned, 337
Function Arguments dialog box, 337–338
use steps, 337–338
BETAINV function
de ned, 338
Function Arguments dialog box, 339
lower limit, 338
return, 338
upper limit, 339
use steps, 339
bimodal, 91
BINOMDIST function
de ned, 327
Function Arguments dialog box, 327
illustrated, 328
use steps, 327
32 454060-bindex.indd 45532 454060-bindex.indd 455 4/21/09 7:41:38 PM4/21/09 7:41:38 PM

456
Statistical Analysis with Excel For Dummies, 2nd Edition
binomial distribution
BINOMDIST function for, 327–328
de ned, 326
hypothesis testing with, 329–332
illustrated, 328
negative, 326
standard normal distribution
approximation, 331
binomial experiments, 326
bins, 37, 133
box-and-whisker plot
box, 438
data, 440, 444
data selection, 441
de ned, 438
ve-number summary, 438
illustrated, 439, 444
kurtosis display, 444–445
series, reformatting, 443
skewness display, 444
turning stacked column chart into, 440
whiskers, 438
worksheet for, 440
• C •
categorical variables, 372–373
category buttons, 18
cell ranges
in COUNTIFS function, 126
database name, increasing, 414
name attachment to, 40
naming, 38–46
right-clicking, 39
selecting, 40
standard scores, 150
cells. See also arrays; cell ranges
auto lling, 20–22
entering formulas directly into, 40
referencing, 22–25
Central Limit Theorem
de ned, 157
large samples, 189, 191
mean of sampling distribution, 73, 157
normal distribution for large samples, 166
normally distributed populations, 189
parameters for sampling distribution, 160
population and, 158
sampling distribution as normal
distribution, 157–158
sampling distribution of the difference
between means, 189
simulation, 158–162, 363–366
simulation results, 365
standard deviation of sampling
distribution, 157
standard error of the mean, 173
two-sample hypothesis testing, 189–190
central tendency
de ned, 79
means, 79–89
medians, 89–91
mode, 91–92
Change Chart Type dialog box, 67
Chart Wizard, 19
charts. See also graphs
creating, 19
de ned, 58
gallery, 19
High-Low-Close, 18
inserting, 58–59
modifying, 59
Charts area (Insert tab), 58–59
CHIDIST function
de ned, 182–183
Function Arguments dialog box, 183
use steps, 183
using, 354
CHIINV function
de ned, 183–184
Function Arguments dialog box, 184
use steps, 184
chi-square distributions
de ned, 181
degrees of freedom and, 181
members, 182
multinomial approximation, 352–353
test statistic, 181
CHITEST function
de ned, 355
degrees of freedom and, 355–356
Function Arguments dialog box, 358, 387
32 454060-bindex.indd 45632 454060-bindex.indd 456 4/21/09 7:41:38 PM4/21/09 7:41:38 PM

457457
Index
return, 387
in testing independence, 385–388
use steps, 358
coef cient of determination
calculating with RSQ, 302
de ned, 296
multiple, 305
square root of, 296–297
column factor
de ned, 249
row factor interaction, 251
variance, 250
column graphs. See also graphs
for categorical variables, 373
data selection, 59
de ned, 57
gallery, 60
as histograms, 63
illustrated, 56
modifying, 60–61
for occurrence frequency, 63
stacked, 61–63, 440
titles, 61
type selection, 59
COMBIN function, 322
combinations
calculating, 322
de ned, 320
formula, 320
large sample spaces, 219
notation, 319
common logarithms. See also logarithms
de ned, 389
natural logarithms comparisons, 392
comparison coef cients
changing, 231
de ned, 225
in nding Sum of Squares for linear
trends, 236
multiplying with SUMPRODUCT, 231
in planned comparison t-test formula, 226
squared, 230
in trend analysis, 235
comparisons. See planned comparisons;
unplanned comparisons
compound events. See also events
combining methods, 315
de ned, 315
formulas, 315, 316
intersection, 316–317
union, 315–316
conditional probability. See also
probabilities
in decision-making process, 15
de ned, 14, 317
example, 317
hypothesis testing foundation, 318
working with, 318
con dence, estimates, 155, 162–166
CONFIDENCE function
de ned, 165
Function Arguments dialog box, 165–166
return, 165
sample size and, 169
sampling distribution assumption, 169
use steps, 165–166
Con dence Limit of the Mean, 138
con dence limits
de ned, 162–163
example, 164–165
nding for a mean, 163–165
lower, 168
percentage of area beyond, 166
upper, 168
con rmatory data analysis, 433
constants, 11
contextual tabs, 19
continuous random variables, 323
CORREL function
cell ranges, 301
de ned, 300
Function Arguments dialog box, 300, 301
use steps, 301
correlation
calculation formula, 293
de ned, 291, 292
multiple, 304–305
negative, 292
partial, 306–307
point biserial, 301
positive, 292
regression and, 294–297
semipartial, 307
testing hypotheses about,
297–300, 308–310
worksheet functions for, 300–302
32 454060-bindex.indd 45732 454060-bindex.indd 457 4/21/09 7:41:38 PM4/21/09 7:41:38 PM

458
Statistical Analysis with Excel For Dummies, 2nd Edition
correlation coef cient
calculating, 297
de ned, 294
difference, 298–300
greater than zero, 297–298
large samples and, 371–372
lower limit, 294
multiple, 304–305
Pearson’s product-moment, 294
transforming, 299
upper limit, 294
correlation matrix, 304
Correlation tool
cell ranges, 303, 304
de ned, 48, 303
dialog box, 303
multiple correlation, 304–305
output options, 304
partial correlation, 306–307
semipartial correlation, 307
tabled output, 304–307
use steps, 303–304
COUNT function
de ned, 123
Function Arguments dialog box, 124
use steps, 123–124
COUNT NUMBERS function, 51
COUNTA function, 124
COUNTBLANK function
de ned, 124
Function Arguments dialog box, 125
COUNTIF function, 125
COUNTIFS function
de ned, 20, 125
example use, 126
Function Arguments dialog box, 126
pairs of cells, 125
counting rule, 319
COVAR function, 302
covariance
calculating, 302
de ned, 294
formula, 302
matrix, 307
covariance analysis
ANCOVA, 422–431
covariate, 421
dependent variable, 420
experimental control, 421
independent variable, 420
method, 421–422
reason for, 420–421
statistical control, 421
Covariance tool
de ned, 48, 307
tabled output, 308
covariate
de ned, 421
dependent variable relationship, 421, 427
variances within, 424
Create Pivot Table dialog box, 416–418
CRITBINOM function
de ned, 330
Function Arguments dialog box, 330–331
return, 330
use steps, 330–331
criteria range, 407
critical values
de ned, 173
example, 175–176
for F, 236
one-tailed test, 194
setting, 174
cubic component, 238
cumulative area, 145
cumulative proportion, 145
curly brackets, 37
curvilinear regression. See also regression
equation, 397
extrapolating beyond scatterplot and, 371
GROWTH function, 398–401
Custom Error Bars dialog box, 381–382, 442
Customize Status Bar menu, 138–139
• D •
damping factor, 378
data
box-and-whisker plot, 440, 444
graphing, 55–77
imported from Web page, 403
importing, 401–403
interval, 13
median, 446
32 454060-bindex.indd 45832 454060-bindex.indd 458 4/21/09 7:41:38 PM4/21/09 7:41:38 PM