Schmuller J. Statistical Analysis with Excel For Dummies
Подождите немного. Документ загружается.


Appendix B
The Analysis of Covariance
In This Chapter
▶ Another look at covariance
▶ Why and how we analyze covariance
▶ Analysis of Covariance (ANCOVA) in Excel
O
ne of the major points of this book is that Excel comes with a surprising
number of analytical tools and formulas. The toolset isn’t as extensive
as you’d find in a dedicated statistics package, but it’s still impressive.
Some analyses, unfortunately, aren’t part of Excel. And some of those might
turn out to be important for you. In many cases, with a little ingenuity you
can use the existing parts of Excel to perform those analyses anyway. In this
Appendix, I focus on one of those analyses.
Covariance: A Closer Look
In Chapter 15, I mention covariance in connection with correlation. I spoke
about it briefly as the numerator of the correlation coefficient. I also mention
that covariance represents two variables changing together.
What does that mean, exactly?
Imagine a group of people on whom we measure mathematical ability and
sociability. (Let’s just assume we have valid, reliable ways of measuring
both.) If we find that the people with high mathematical ability are the most
sociable, and the people with low mathematical ability are the least sociable,
this thing called covariance is numerically high and positive. This type of
positive relationship is called a direct relationship.
30 454060-bapp02.indd 41930 454060-bapp02.indd 419 4/21/09 7:40:18 PM4/21/09 7:40:18 PM

420
Statistical Analysis with Excel For Dummies, 2nd Edition
A different result is possible: The people with high mathematical ability
might turn out to be the least sociable, and the people with low mathematical
ability the most sociable. If that happens, covariance is numerically high and
negative. This type of negative relationship is called an inverse relationship.
Still another result is possible. We might find no connection whatsoever
between mathematical ability and sociability. In this case, the two variables
are independent, and the numerical value of covariance is close to zero. It
could be slightly positive, it could be slightly negative, but it’s close to zero.
Sounds a lot like correlation? It should. As I said, covariance is the numera-
tor of the correlation coefficient. One way to look at it is that the correlation
coefficient puts an upper and lower bound on covariance. With a little experi-
ence, we can understand what a correlation coefficient of .98 means, or a cor-
relation coefficient of -.62. Without a lot of context, it’s hard to know what a
covariance of 473.5 means.
Why You Analyze Covariance
So you’ve had a refresher on what covariance is. Why do we want to . . . uh . . .
analyze it?
Let’s begin with a typical study: You randomly assign people to different
conditions and you assess their performance under those conditions. For
example, you might randomly assign 15 children to one of three groups that
differ on how they prepare for a math exam. One group prepares by listen-
ing to a human instructor. Another prepares by going through an interactive
program on a computer. The third prepares by reading a textbook. Then they
take the exam.
The performance on the test is the dependent variable. The three preparation
conditions make up the independent variable. The goal is usually to find out
if the different conditions of the independent variable affect the dependent
variable. Recall from Chapter 12 that this involves a hypothesis test that
looks like this:
H
0
: μ
Instructor
= μ
Computer
= μ
Text
H
1
: Not H
0
In Chapter 12, I also point out that the appropriate statistical technique is the
analysis of variance (ANOVA).
So far, so good. What about covariance?
30 454060-bapp02.indd 42030 454060-bapp02.indd 420 4/21/09 7:40:18 PM4/21/09 7:40:18 PM

421
Appendix B: The Analysis of Covariance
In addition to the dependent variable and the independent variable, a third
kind of variable can come into play. Here’s how. Suppose you have another
relevant measure for each of the 15 children — mathematics aptitude. In
addition to preparation type, this could also affect each child’s exam perfor-
mance. This third variable is called the covariate. The relationship between
the dependent variable and the covariate is covariance.
Big shots in the field of research design and analysis have a name for ran-
domly assigning individuals to different conditions of the independent vari-
able and keeping everything else the same (like the time of day you give the
test, the amount of time each child prepares, the amount of time each child
has to take the test). They call this experimental control.
They also have a name for assessing the effects of a covariate — that is,
its covariance with the dependent variable. They refer to that as statistical
control. Both are valuable tools in the analyst’s arsenal.
Bottom-line question: Why do you need statistical control? Suppose you
carry out the study and find no significant differences among preparation
groups. This could mean that experimental control wasn’t powerful enough
to discern an effect of preparation type. That’s when statistical control can
come to the rescue. Suppose mathematics aptitude affected performance in
ways that masked the effects of preparation type. That is, does the possible
correlation of performance with aptitude affect the results?
By combining experimental control with statistical control, analysis of covari-
ance (ANCOVA) answers that question.
How You Analyze Covariance
How do you combine the two types of control?
In Chapter 12, I point out that ANOVA separates SS
Total
into SS
Between
and SS
Within
.
Divide each SS by its degrees of freedom and you have three MS (variances).
The MS
Between
reflects differences among group means. The MS
Within
estimates
the population variance. It’s based on pooling the variances within the
groups. If the MS
Between
is significantly greater than the MS
Within
, you can reject
the null hypothesis. If not, you can’t. (Reread Chapter 12 if this all sounds
strange to you.)
In ANCOVA, you use the relationship between the dependent variable and
the covariate to adjust SS
Between
and SS
Within
. If the relationship is strong, it’s
likely that the adjustment increases SS
Between
and reduces SS
Within
. Statistics,
30 454060-bapp02.indd 42130 454060-bapp02.indd 421 4/21/09 7:40:18 PM4/21/09 7:40:18 PM
422
Statistical Analysis with Excel For Dummies, 2nd Edition
like most other aspects of our world, feature no free lunches: The adjustment
lowers the df
Within
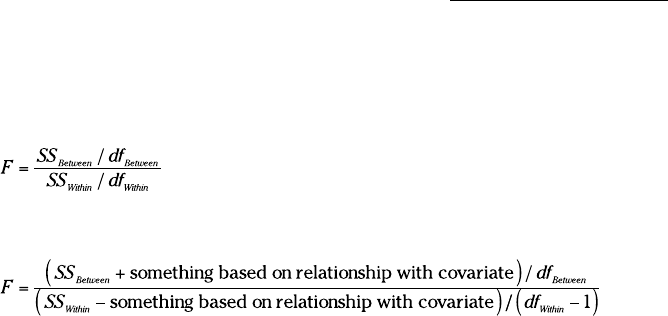
by 1. It might help to think of it this way:
ANOVA:
ANCOVA:
A possible outcome of the adjustment (if the relationship is strong) is that
the F ratio is higher for ANCOVA than for ANOVA. In practical terms, this
means that adding statistical control can result in a more powerful study
(that is, greater ability to find an effect) than experimental control alone.
Here’s a way to understand ANOVA vs. ANCOVA: ANOVA helps you find a
needle in a haystack. ANCOVA also does this, but it removes some of the hay
from the haystack — and it makes the needle a little bigger, too.
ANCOVA in Excel
Although Excel has no built-in tools for ANCOVA, you can use what Excel
does provide to make ANCOVA way easier than it looks in statistics books.
What does Excel provide? When it comes to covariance, recall that the
COVAR worksheet function does all the calculations for you, as does the
Covariance analysis tool.
It sounds like the Covariance analysis tool is ideal for something called
Analysis of Covariance (ANCOVA). Oddly, it’s not. We also have no use for
COVAR as we proceed.
Instead, I show you two approaches that use other Excel features to carry out
an ANCOVA. One approach uses the Anova: Single Factor analysis tool along
with some worksheet functions. The other uses the Regression analysis tool
along with some worksheet functions.
Both approaches tackle the data in Table B-1. In both methods, I use regres-
sion slopes to express the relationship between the dependent variable and
the covariate.
30 454060-bapp02.indd 42230 454060-bapp02.indd 422 4/21/09 7:40:18 PM4/21/09 7:40:18 PM

423
Appendix B: The Analysis of Covariance
Table B-1 Data for Exam Performance with Three Preparation
Methods and for Mathematics Aptitude
Human Computer Text
Math
Aptitude
Exam Math
Aptitude
Exam Math
Aptitude
Exam
10 6 7 9 7 9
9975912
87814 49
6 2 11 10 11 18
9101115 711
These methods are for the kind of research design I discuss in Chapter 12
(single factor ANOVA). You can use ANCOVA for any kind of research design
that involves ANOVA, but these two particular methods won’t work for more
complicated designs (as in Chapter 13, for example).
Method 1: ANOVA
When most statistics textbooks cover analysis of covariance, they show you
a lot of arcane-looking computation formulas designed to avoid even more
complex-looking regression-related calculations. The result is that they often
obscure what ANCOVA is supposed to do.
With this method, and the next one, I show you how to harness Excel’s power
to get around all of that. My goal is to make ANCOVA a lot easier than it looks
in stat books.
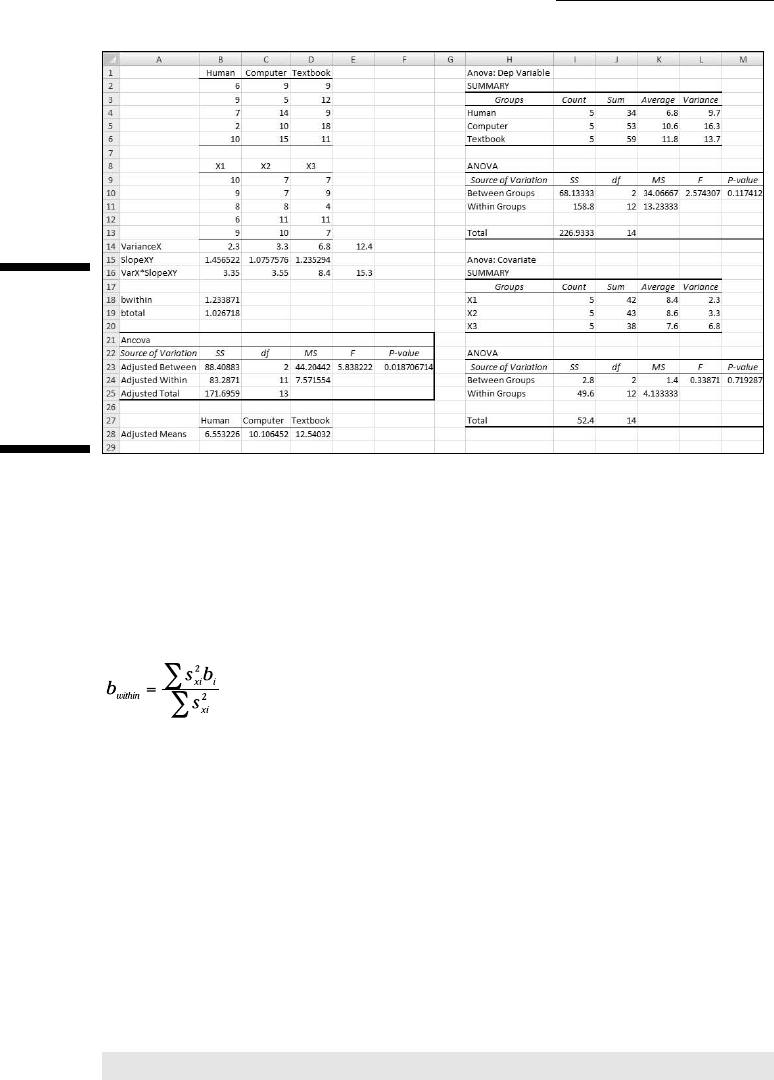
Figure B-1 shows the ANCOVA worksheet for this method. I’ll take you
through the steps.
The data from Table B-1 are in cells B1:D13, separated into one table for the
dependent variable data and another for the covariate data. I structured
the data this way because I have to use the Anova: Single Factor tool on the
dependent variable and again on the covariate. The input to the Anova tool is
a contiguous range of cells, so the layout in Table B-1 doesn’t work.
The first thing I did was set up to calculate b
within
, a quantity I use to adjust
the SS and to adjust group means for post-analysis testing.
30 454060-bapp02.indd 42330 454060-bapp02.indd 423 4/21/09 7:40:18 PM4/21/09 7:40:18 PM
424
Statistical Analysis with Excel For Dummies, 2nd Edition
Figure B-1:
The
Method 1
ANCOVA
worksheet
for the data
in Table B-1.
What is b
within
? Imagine a scatterplot for each of the three groups, and a
regression line through each scatterplot. Each regression line has a slope.
The value of b
within
is the average of the group slopes with each slope
weighted by the variance of the covariate within the group.
This might be a rare case where the formula is clearer than the words. Here
it is:
So I used VAR to calculate the variance of each group within the covariate.
Those variances are in row 14, labeled VarianceX. I could have run the Anova
tool to get these variances. I did it this way for clarity. The sum of these vari-
ances, 12.4, is in cell E14.
Then I used SLOPE to calculate the slope within each group. Those are in
row 15, labeled SlopeXY.
Row 16, labeled VarX*SlopeXY, contains the product of each group slope
multiplied by the variance in that group. Cell E16 holds the sum of these
products.
The value of b
within
is in cell B18. The formula for that cell is
=E16/E14
30 454060-bapp02.indd 42430 454060-bapp02.indd 424 4/21/09 7:40:18 PM4/21/09 7:40:18 PM

425
Appendix B: The Analysis of Covariance
Cell B19 holds another slope I use for SS adjustment. It’s called b
total
and it
represents the slope of the regression line drawn through a scatterplot of all
the scores regardless of the group they’re in. The formula for B19 is
=SLOPE(B2:D6,B9:D13)
Next, I constructed the spiffy-looking ANCOVA table in cells A21:F25. The
objective of this whole process is to fill in this table. I formatted all the labels
and borders to make it look something like the results of an Anova:Single
Factor analysis. Then I filled in the sources of variation in A23:A25, and the df
in C23:C25. The df are the same as for ANOVA, except you lose a df from the
df
Within
, and that of course is reflected in the df
Total
.
The next order of business is to run the Anova:Single Factor analysis tool. I
ran it once for the dependent variable and once for the covariate. Why for the
covariate? After all, I’m not testing any hypotheses about Math Aptitude. The
reason for an ANOVA on the covariate is that the ANOVA output provides SS
values I need to complete the ANCOVA.
In Chapter 12, I explain how to use this tool. The only difference is that in this
case I directed the output to this worksheet rather than to separate worksheets.
I removed some rows from the Anova tool’s outputs so that everything would
fit into one screen shot, and I modified them a bit for clarity.
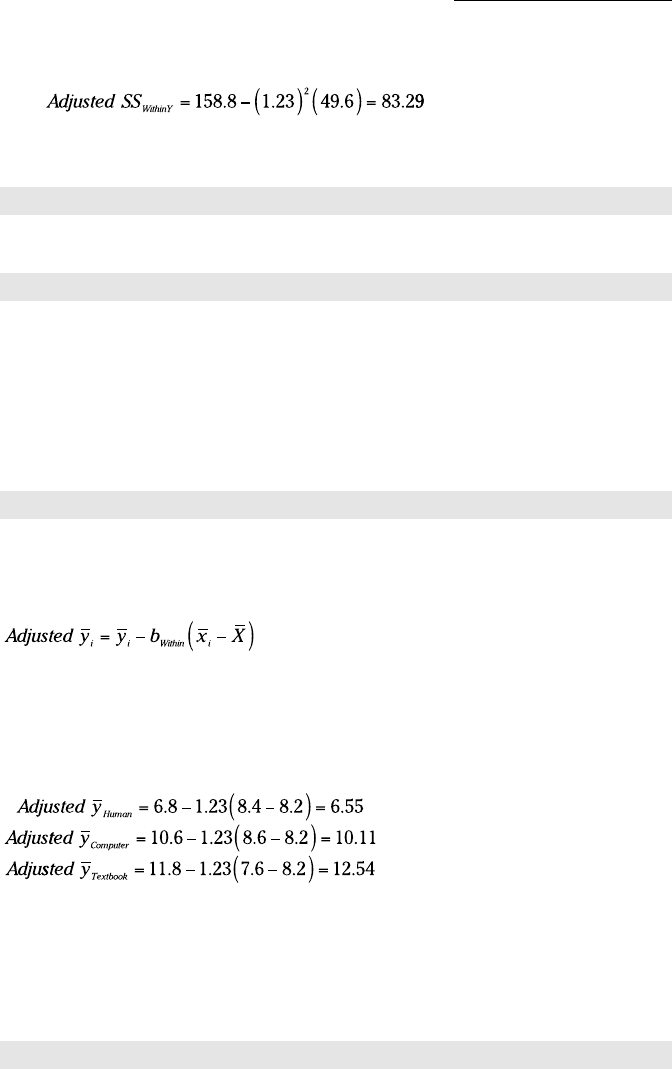
The values in the ANOVA tables enable me to fill in the ANCOVA table. The
Adusted SS
Total
is
This means that
=I13-B19^2*I27
goes into cell B25 in the ANCOVA table. By the way, I rounded off to two deci-
mal places to make everything look nicer on this page. The worksheet has
way more decimal places.
Next up: Adjusted SS
Within
. The formula for the adjustment is
30 454060-bapp02.indd 42530 454060-bapp02.indd 425 4/21/09 7:40:19 PM4/21/09 7:40:19 PM
426
Statistical Analysis with Excel For Dummies, 2nd Edition
Numerically, that’s
So in cell B24 I put this formula
=I11-B18^2*I25
Adjusted SS
Between
? That’s just
=B25-B24
in cell B23.
I complete the ANCOVA table by dividing each Adjusted SS by its df, and then
dividing the Adjusted MS
Between
by the Adjusted MS
Within
to compute F.
That last column in the ANCOVA table, P-value, is a little trick courtesy of
FDIST. The formula in cell F23 is
=FDIST(E23,C23,C24)
Just below the ANCOVA table, I put the adjusted means for the dependent
variable. These enter into post-analysis testing, which I cover in the section
after the next one. For now, I’ll just tell you that each adjusted mean is
where that uppercase X with a bar over it represents the average of all 15
scores in the covariate.
For this example, the adjusted means are
The adjustments increase the spread among the means.
In this worksheet, the group means are in the ANOVA outputs. Specifically,
they’re in K4:K6 for the dependent variable and in K18:K20 for the covariate.
So the formula for the adjusted Human mean (in cell B28) is
=K4-B18*(K18-AVERAGE(B9:D13))
30 454060-bapp02.indd 42630 454060-bapp02.indd 426 4/21/09 7:40:19 PM4/21/09 7:40:19 PM

427
Appendix B: The Analysis of Covariance
For the adjusted Computer mean (cell C28) it’s
=K5-B18*(K19-AVERAGE(B9:D13))
and for the adjusted Textbook mean (cell D28) it’s
=K6-B18*(K20-AVERAGE(B9:D13))
What’s the benefit of ANCOVA? Take a look at Figure B-1. Compare the result
of the dependent-variable ANOVA (F
2,12
= 2.57) with the result of the ANCOVA
(F
2,11
= 5.84). Although we sacrificed a df, the P-value shows the ANCOVA
result is significant. The ANOVA result is not. The ANCOVA adjusted the
SS
Between
upward, and adjusted the SS
Within
downward.
Bottom line: The relationship between the dependent variable and the covari-
ate enables us to uncover a significant effect we might otherwise miss. In this
example, ANCOVA avoids a Type II error.
Method 2: Regression
If the preceding method works, why am I bothering to show you yet another
method? Even more important, why should you take the trouble to master it?
The reason I’d like you to read on is this. The method I’m about to show you
asks you to change your mind-set about the data. If you can do that, you’ll
find yourself open to another way of looking at statistical analysis and to
mastering some new statistical concepts.
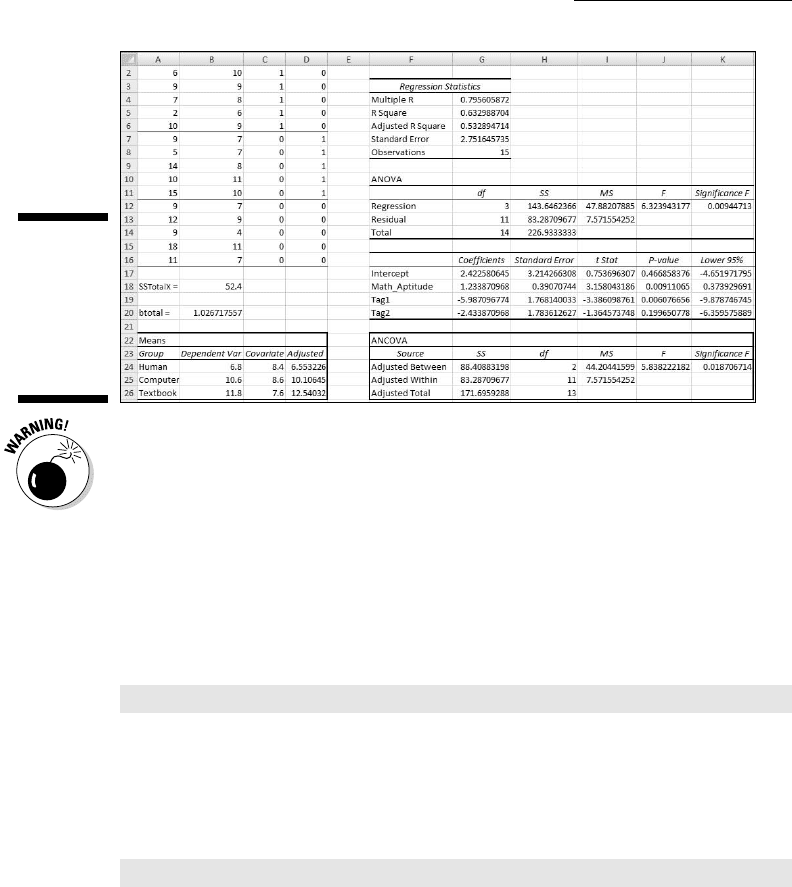
Here’s what I mean. The worksheet in Figure B-2 shows the data from Table
B-1 in a different type of layout. The figure also shows the work for the com-
pleted ANCOVA.
Column A has the math exam data, and column B has the math aptitude data,
but they’re not separated into three groups as before. What’s going on here?
My plan is to treat this as a multiple regression. Exam is the dependent vari-
able, and Math Aptitude is an independent variable. But it’s not the only inde-
pendent variable.
The key is to somehow represent the group that each individual is a member
of. Tag1 and Tag2 take care of that. If a child is in the Human Instructor
group, Tag1 = 1 and Tag2 = 0. If a child is in the Computer group, Tag1 = 0 and
Tag2 = 1. If a child is in the Textbook group, Tag1 = 0 and Tag2 = 0. In general,
with k groups, k-1 columns can specify group membership in this way. Just to
let you know, in Statistics World columns B, C, and D are called vectors, but I
won’t go there.
30 454060-bapp02.indd 42730 454060-bapp02.indd 427 4/21/09 7:40:19 PM4/21/09 7:40:19 PM
428
Statistical Analysis with Excel For Dummies, 2nd Edition
Figure B-2:
The
Method 2
ANCOVA
worksheet
for the data
in Table B-1.
This categorization scheme works when you have the same number of indi-
viduals in each group. If you don’t, things get a little dicey.
I drew lines to separate the three groups but that’s just to clarify.
What I’ve set up is a multiple regression with a dependent variable (Exam)
and three independent variables (Math Aptitude, Tag1, and Tag2). What I’m
saying is that Exam score depends on Math Aptitude, Tag 1, and Tag 2.
Below the data layout, cell B18 holds SS
TotalX
. The formula for that cell is
=COUNT(B2:B16)*VARP(B2:B16)
meaning that I multiplied the number of scores in column B (15) by the vari-
ance in column B (treated as a population of 15 scores, hence VARP) to give
SS
TotalX
, the numerator of a variance.
I also calculated b
total
in cell B20:
=SLOPE(A2:A16,B2:B16)
What about b
within
? Patience.
Below those values is a table of means and adjusted means, but I’ll get to that
later.
You might not believe this, but the analysis is almost done.
30 454060-bapp02.indd 42830 454060-bapp02.indd 428 4/21/09 7:40:19 PM4/21/09 7:40:19 PM