Schmuller J. Statistical Analysis with Excel For Dummies
Подождите немного. Документ загружается.


39
Chapter 2: Understanding Excel’s Statistical Capabilities
✓ Be sure that the name is unique within the worksheet.
✓ Be sure that the name doesn’t duplicate any cell reference in the
worksheet.
Here’s how to define a name:
1. Put a descriptive name at the top of a column (or to the left of a row)
you want to name.
Figure 2-10 shows this.
2. Select the range of cells you want to name.
For this example, that’s cells C2 through C13. Why not include C1? I
explain in a second.
3. Right-click on the selected range.
This opens the menu shown in Figure 2-12.
Figure 2-12:
Right-
clicking a
selected
cell range
opens this
pop-up
menu.
4. From the pop-up menu, select Name a Range.
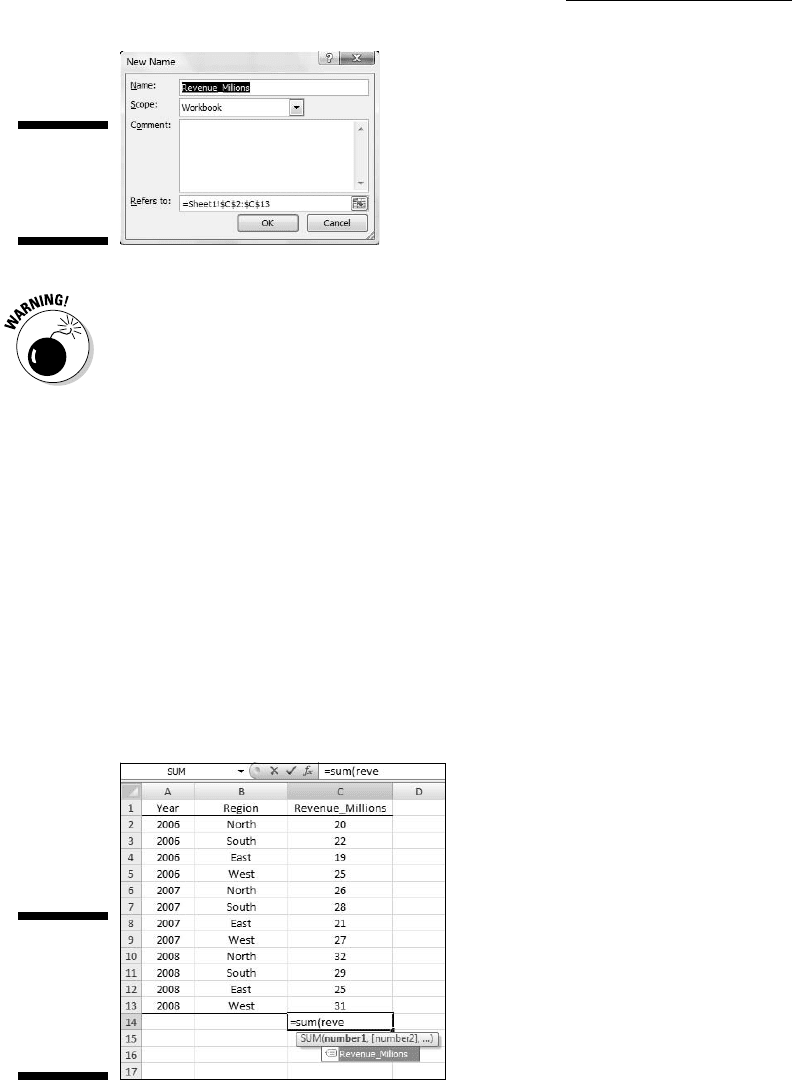
This selection opens the New Name dialog box (see Figure 2-13). As you
can see, Excel knows that Revenue_Millions is the name for the array,
and that Revenue_Millions refers to cells C2 through C13. When pre-
sented with a selected range of cells to name, Excel looks for a nearby
name — just above a column or just to the left of a row. If no name is
present, you get to supply one in the New Name dialog box. (The New
Name dialog box is also accessible by choosing Formula | Define Name.)
06 454060-ch02.indd 3906 454060-ch02.indd 39 4/21/09 7:18:50 PM4/21/09 7:18:50 PM
40
Part I: Statistics and Excel: A Marriage Made in Heaven
Figure 2-13:
The New
Name dialog
box.
When you select a range of cells like a column with a name at the top,
you can include the cell with the name in it and Excel attaches the
name to the range. I strongly advise against doing this. Why? If I select C1
through C13, the name Revenue_Millions refers to cells C1 through C13,
not C2 through C13. In that case, the first value in the range is text and
the others are numbers.
For a formula like SUM (or SUMIF or SUMIFS, which I discuss next), this
doesn’t make a difference: In those formulas, Excel just ignores values
that aren’t numbers. If you have to use the whole array in a calculation,
however, it makes a huge difference: Excel thinks the name is part of the
array and tries to use it in the calculation. You’ll see this in the next sec-
tion on creating your own array formulas.
5. Click OK.
Excel attaches the name to the range of cells.
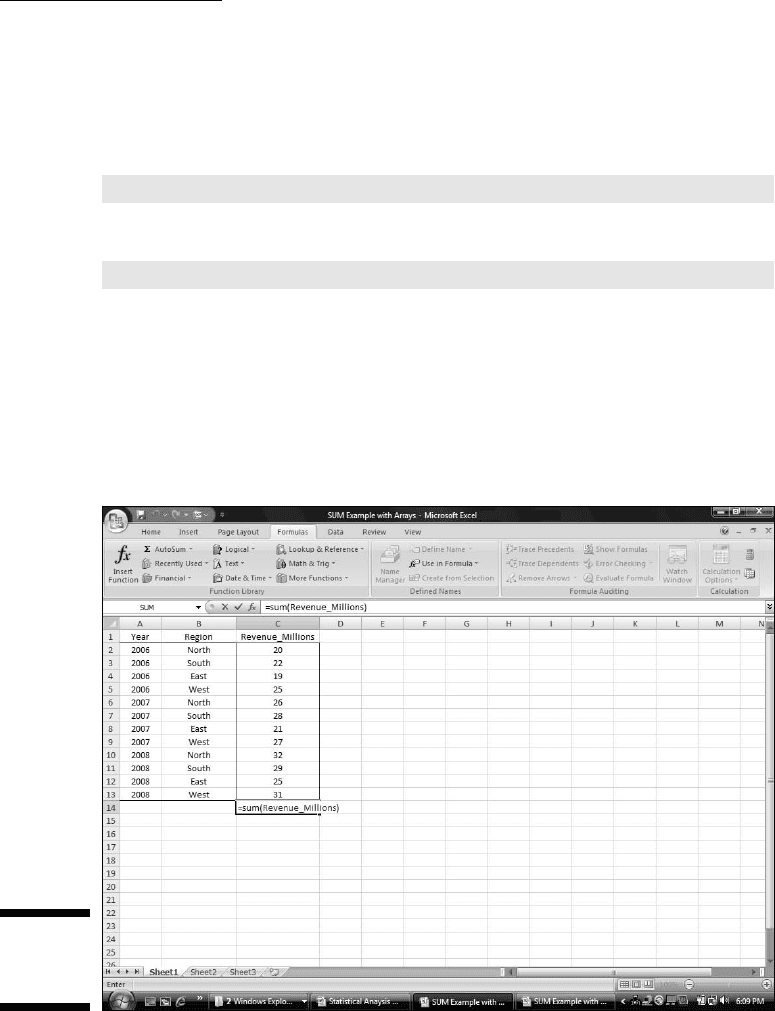
Now I have the convenience of using the name in a formula. Here, selecting
a cell (like C14) and entering the SUM formula directly into C14 opens the
boxes in Figure 2-14.
Figure 2-14:
Entering
a formula
directly into
a cell opens
these boxes.
06 454060-ch02.indd 4006 454060-ch02.indd 40 4/21/09 7:18:50 PM4/21/09 7:18:50 PM
41
Chapter 2: Understanding Excel’s Statistical Capabilities
As the figure shows, the boxes open as I type. Pressing the Tab key fills in the
formula in a way that Excel understands. I have to supply the close parenthe-
sis (see Figure 2-15) and type Enter to see the result.
Using the named array, then, the formula is
=SUM(Revenue_Millions)
which is more descriptive than
=SUM(C2:C13)
A couple of Excel 2007’s new formulas show just how convenient this naming
capability is. These formulas, SUMIF and SUMIFS, add a set of numbers if
specific conditions in one cell range (SUMIF) or in more than one cell range
(SUMIFS) are met. SUMIFS is new in Excel 2007.
To take full advantage of naming, I name both column A (Year) and column B
(Region) in the same way I named column C.
Figure 2-15:
Completing
the formula.
06 454060-ch02.indd 4106 454060-ch02.indd 41 4/21/09 7:18:50 PM4/21/09 7:18:50 PM
42
Part I: Statistics and Excel: A Marriage Made in Heaven
When you define a name for a cell range like B2:B13 in this example, beware:
Excel can be a bit quirky when the cells hold names. Excel might guess that
the name in the uppermost cell is the name you want to assign to the cell
range. In this case, Excel guesses “North” for the name, rather than “Region.”
If that happens, you make the change in the New Name dialog box.
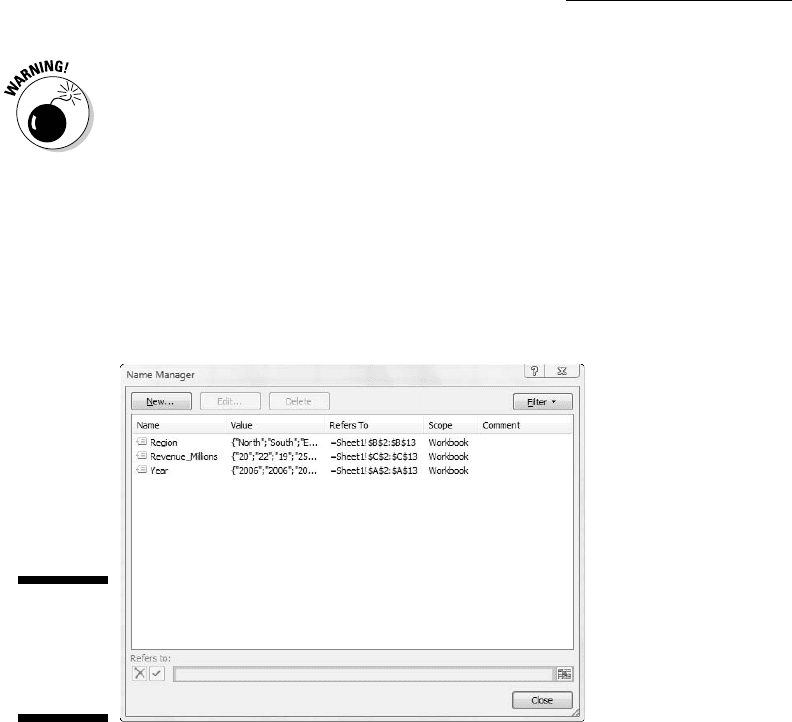
To keep track of the names in a worksheet, selecting
Formula | Name Manager
opens the Name Manager box shown in Figure 2-16. The nearby buttons in
the Defined Names area are also useful.
Figure 2-16:
Managing
the Defined
Names in a
worksheet.
Next, I sum the data in column C, but only for the North Region. That is, I only
consider a cell in column C if the corresponding cell in column B contains
“North.” To do this, I followed these steps:
1. Select a cell for the formula result.
My selection here is C15.
2. Select the appropriate formula category and choose your function
from its pop-up menu.
This opens the Function Arguments dialog box.
I selected Formulas | Math & Trig
and scrolled down the menu to find and choose SUMIF. This selection
opens the Function Arguments dialog box shown in Figure 2-17.
06 454060-ch02.indd 4206 454060-ch02.indd 42 4/21/09 7:18:50 PM4/21/09 7:18:50 PM
43
Chapter 2: Understanding Excel’s Statistical Capabilities
Figure 2-17:
The
Function
Arguments
dialog box
for SUMIF.
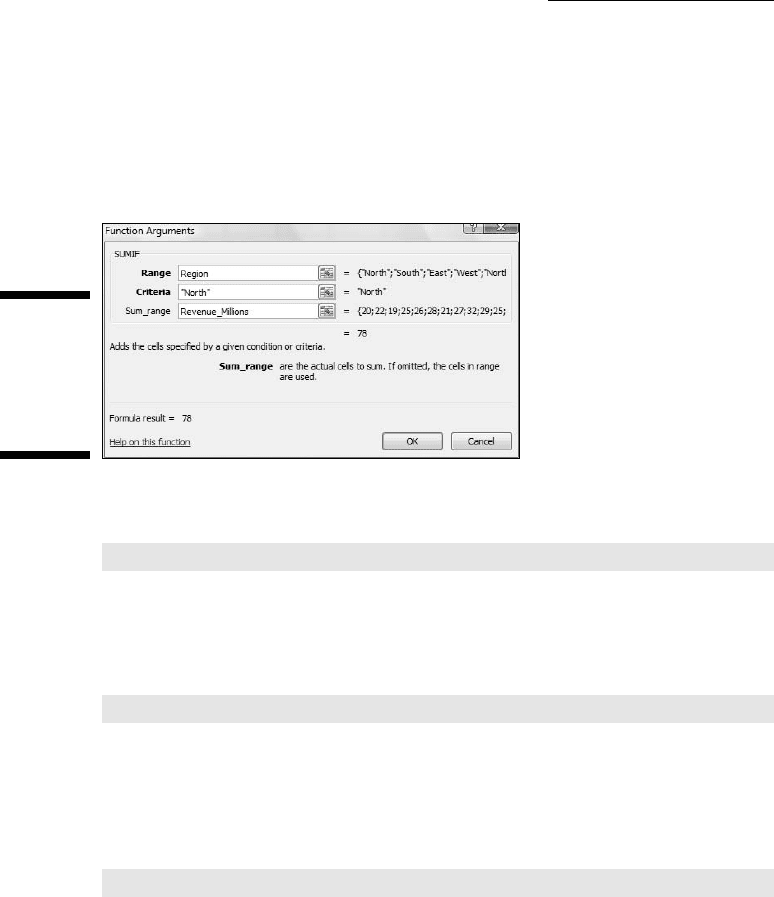
SUMIF has three arguments. The first, Range, is the range of cells to eval-
uate for the condition to include in the sum (North, South, East, or West
in this example). The second, Criteria, is the specific value in the Range
(North, for this example). The third, Sum_range, holds the values I sum.
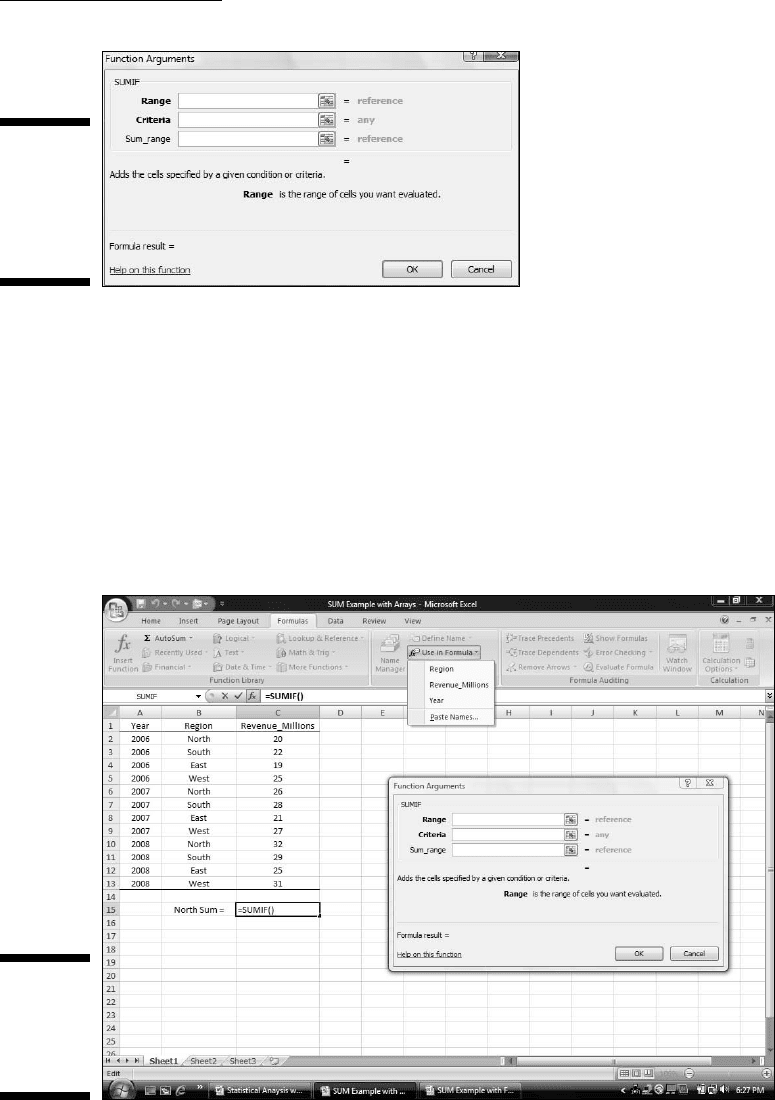
3. In the Function Arguments dialog box, enter the appropriate values
for the arguments.
Here’s where another Defined Names button comes in handy. In that
Ribbon area, click the down arrow next to Use in Formula to open the
drop-down list shown in Figure 2-18.
Figure 2-18:
The Use
In Formula
drop-down
list.
06 454060-ch02.indd 4306 454060-ch02.indd 43 4/21/09 7:18:51 PM4/21/09 7:18:51 PM
44
Part I: Statistics and Excel: A Marriage Made in Heaven
Selecting from this list fills in the Function Arguments dialog box, as
shown in Figure 2-19. I had to type North into the Criteria box. Excel
adds the double quotes.
4. Click OK.
The result appears in the selected cell. For this example, that’s 78.
Figure 2-19:
Completing
the Function
Arguments
dialog box
for SUMIF.
In the formula bar,
=SUMIF(Region,”North”, Revenue_Millions)
appears. I can type it exactly that way into the formula bar, without the
dialog box or the drop-down list.
The formula in the formula bar is easier to understand than
= SUMIF(B2:B13,”North”, C2:C13)
isn’t it?
Incidentally, the same cell range can be both the Range and the Sum_range.
For example, to sum just the cells for which Revenue_Millions is less than 25,
that’s
=SUMIF(Revenue_Millions, “< 25”, Revenue_Millions)
The second argument (Criteria) is always in double-quotes.
What about SUMIFS? That one is useful if I want to find the sum of revenues
for North but only for the years 2006 and 2007. Follow these steps to use
SUMIFS to find this sum:
06 454060-ch02.indd 4406 454060-ch02.indd 44 4/21/09 7:18:51 PM4/21/09 7:18:51 PM
45
Chapter 2: Understanding Excel’s Statistical Capabilities
1. Select a cell for the formula result.
The selected cell is C17.
2. Select the appropriate formula category and choose your function
from its pop-up menu.
This opens the Function Arguments dialog box.
For this example, the selection is SUMIFS from the
Formulas | Math & Trig
menu, opening the Functions Arguments dialog box shown in Figure 2-20.
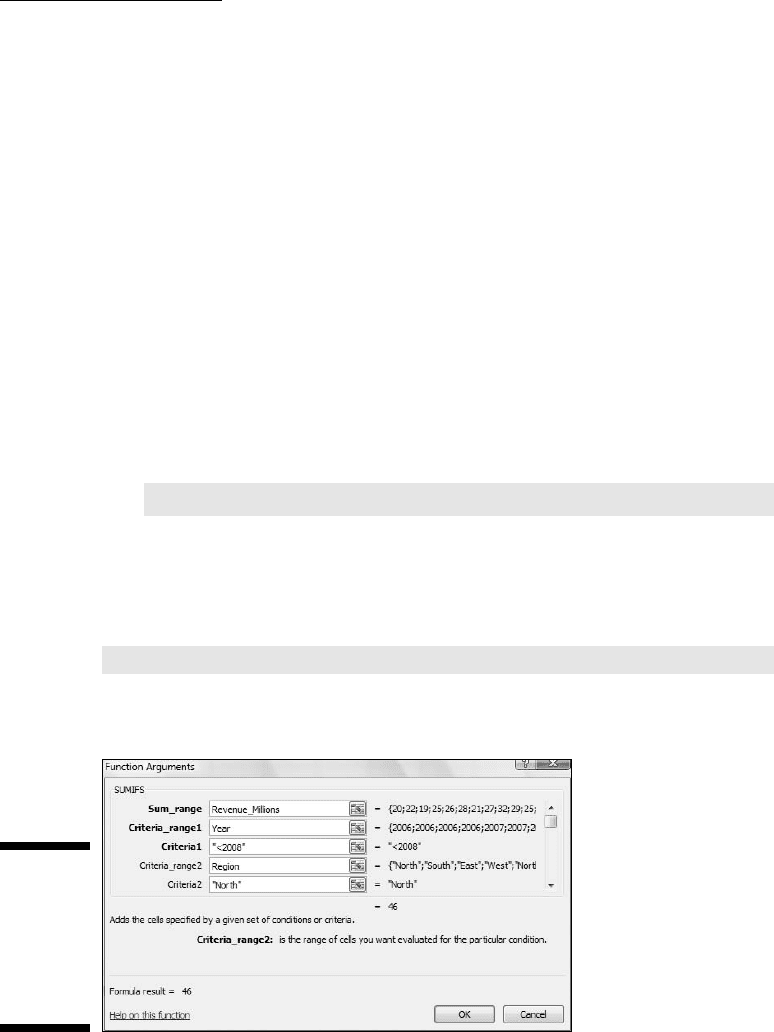
3. In the Function Arguments dialog box, enter the appropriate values
for the arguments.
Notice that in SUMIFS the Sum_range argument appears first. In SUMIF,
it appears last. The appropriate values for the arguments appear in
Figure 2-20.
4. The formula in the Formula bar is
=SUMIFS(Revenue_Millions,Year,”<2008”,Region,”North”)
5. Click OK.
The answer, 46, appears in the selected cell.
With unnamed arrays, the formula would have been
=SUMIFS(C2:C13,A2:A13,”<2008”,B2:B13,”North”)
which seems much harder to comprehend.
Figure 2-20:
The
Completed
Function
Arguments
dialog box
for SUMIFS.
06 454060-ch02.indd 4506 454060-ch02.indd 45 4/21/09 7:18:51 PM4/21/09 7:18:51 PM

46
Part I: Statistics and Excel: A Marriage Made in Heaven
A defined name involves absolute referencing. (See Chapter 1.) Therefore, if
you try to autofill from a named array, you’ll be in for an unpleasant surprise:
Rather than autofilling a group of cells, you’ll be copying a value over and over
again.
Here’s what I mean. Suppose you assign the name Series_1 to A2:A11 and
Series_2 to B2:B11. In A12, you calculate SUM(Series_1). Being clever, you
figure you’ll just drag the result from A12 to B12 to calculate SUM(Series_2).
What do you find in B12? SUM(Series_1), that’s what.
Creating your own array formulas
In addition to Excel’s built-in array formulas, you can create your own. To
help things along, you can incorporate named arrays.
Figure 2-21 shows two named arrays, X and Y in columns C and D. X refers
to C2 through C5 (not C1 through C5!) and Y refers to D2 through D5 (not D1
through D5!) XY is the column header for column F. Each cell in column F will
store the product of the corresponding cell in column C and the correspond-
ing cell in column D.
Figure 2-21:
Two named
arrays.
An easy way to enter the products, of course, is to just set F2 equal to C2*E2
and then autofill the remaining applicable cells in column F.
Just to illustrate array formulas, though, I follow these steps to work on the
data in the worksheet in Figure 2-21.
1. Select the array that will hold the answers to the array formula.
That would be F2 through F5, or F2:F5 in Excel-speak. Figure 2-21 shows
the array selected.
2. Into the selected array, type the formula.
The formula here is =X * Y
06 454060-ch02.indd 4606 454060-ch02.indd 46 4/21/09 7:18:51 PM4/21/09 7:18:51 PM
47
Chapter 2: Understanding Excel’s Statistical Capabilities
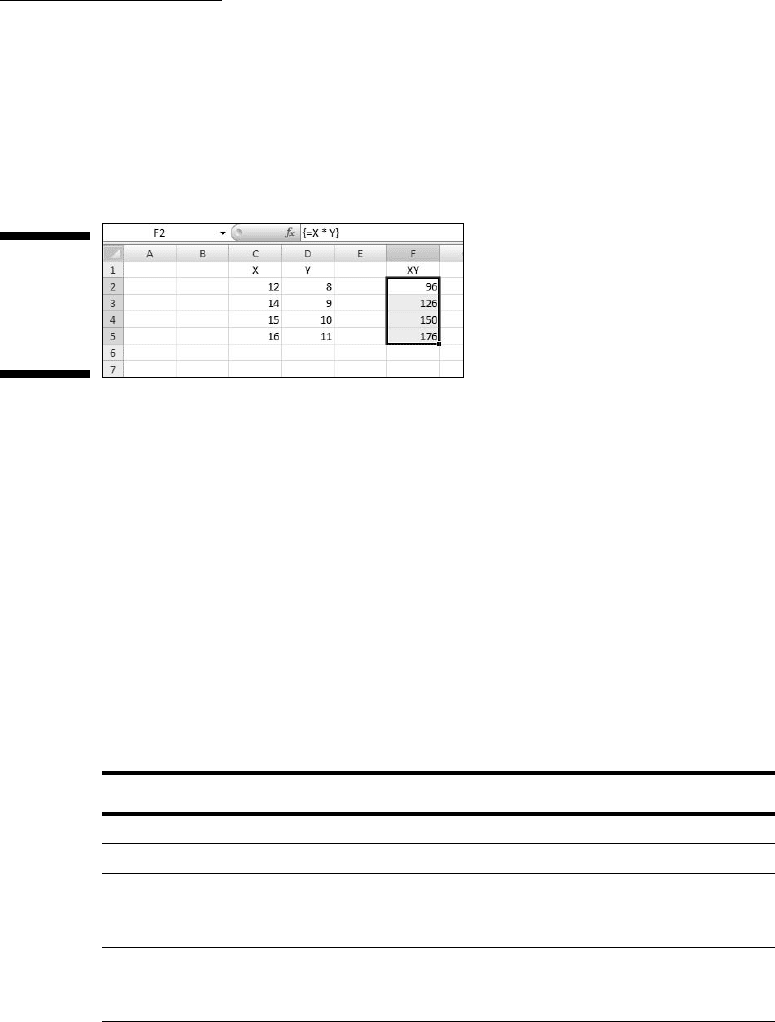
3. Press Ctrl+Shift+Enter (not Enter).
The answers appear in F2 through F5, as Figure 2-22 shows. Note the for-
mula {=X*Y}
in the formula bar. As I told you earlier, the curly brackets indicate an
array formula.
Figure 2-22:
The results
of the array
formula
{=X * Y}.
Another thing I mention earlier in this chapter: When you name a range of
cells, make sure that the named range does not include the cell with the name
in it. If it does, an array formula like {=X * Y} tries to multiply the letter X by
the letter Y to produce the first value, which is impossible and results in the
exceptionally ugly #VALUE! error.
Using data analysis tools
Excel has a set of sophisticated tools for data analysis. Table 2-1 lists the
tools I cover. (The one I don’t cover, Fourier Analysis, is extremely techni-
cal.) Some of the terms in the table may be unfamiliar to you, but you’ll know
them by the time you finish this book.
Table 2-1 Excel’s Data Analysis Tools
Tool What It Does
Anova: Single Factor Analysis of variance for two or more samples
Anova: Two Factor
with Replication
Analysis of variance with two independent variables, and
multiple observations in each combination of the levels of
the variables
Anova: Two Factor
without Replication
Analysis of variance with two independent variables, and
one observation in each combination of the levels of the
variables
(continued)
06 454060-ch02.indd 4706 454060-ch02.indd 47 4/21/09 7:18:52 PM4/21/09 7:18:52 PM

48
Part I: Statistics and Excel: A Marriage Made in Heaven
Table 2-1 (continued)
Tool What It Does
Correlation With more than two measurements on a sample of indi-
viduals, calculates a matrix of correlation coefficients for
all possible pairs of the measurements
Covariance With more than two measurements on a sample of indi-
viduals, calculates a matrix of covariances for all pos-
sible pairs of the measurements
Descriptive Statistics Generates a report of central tendency, variability, and
other characteristics of values in the selected range of
cells
Exponential
Smoothing
In a sequence of values, calculates a prediction based
on a preceding set of values, and on a prior prediction for
those values
F-Test Two Sample
for Variances
Performs an F-test to compare two variances
Histogram Tabulates individual and cumulative frequencies for
values in the selected range of cells
Moving Average In a sequence of values, calculates a prediction which is
the average of a specified number of preceding values
Random Number
Generation
Provides a specified amount of random numbers gener-
ated from one of seven possible distributions
Rank and Percentile Creates a table that shows the ordinal rank and the
percentage rank of each value in a set of values
Regression Creates a report of the regression statistics based
on linear regression through a set of data containing
one dependent variable and one or more independent
variables
Sampling Creates a sample from the values in a specified range of
cells
t-Test: Two Sample Three t-test tools test the difference between two means.
One assumes equal variances in the two samples.
Another assumes unequal variances in the two samples.
The third assumes matched samples.
z-Test: Two Sample
for Means
Performs a two-sample z-test to compare two means
when the variances are known
In order to use these tools, you first have to load them into Excel.
06 454060-ch02.indd 4806 454060-ch02.indd 48 4/21/09 7:18:52 PM4/21/09 7:18:52 PM