Seybold J.S. Introduction to RF Propagation
Подождите немного. Документ загружается.


10.3 RAIN FADES
Rain fades depend upon the rain rate, drop size and shape, and volume density
(# drops per m
3
). Of these factors, only rain rate is readily measured unless a
radar system is available; for this reason, rain rate is most often used for rain
fade characterization. Robert Crane [2, 4] and the ITU [10–12] each provide
rain fade models based on rain rate. Application of these models is presented
in the following sections. There are other rain fade models available, but the
models presented here are based on a significant amount of empirical data
and are the most widely used.
10.3.1 Specific Attenuation Due to Rainfall
The ITU and Crane models both make use of the specific attenuation due to
rain that is computed from the ITU data library. The specific attenuation is
determined by using regression coefficients and the rain rate of interest. The
models differ in the values for rainfall rate and in the modeling equations used,
but they share the same regression coefficients for the specific attenuation. To
determine the specific attenuation for a given rain rate, the frequency of oper-
ation is used to select the appropriate linear regression coefficients [10, 13]
and interpolate them if necessary. Table 10.1 gives the linear-regression coef-
ficients for linear polarization at several frequencies. Table 10A.1 in Appen-
dix 10A is a more complete table of regression coefficients. The interpolation
of the coefficients is performed using a log scale for frequency and the k values
and a linear scale for the a values. Table 10A.2 provides interpolated regres-
sion coefficients for frequencies from 1 through 40 GHz in 1-GHz steps. Note
that these coefficients are frequency- and polarization-dependent. The final
coefficients are determined using the following expressions, which account for
the path elevation angle and the polarization. Note that for circular polariza-
tion, a tilt angle, t, of 45 degrees is used.
(10.3)
k
kk kk
HV HV
=
++ -
()()()
[]
cos cos
2
2
2
qt
222 RAIN ATTENUATION OF MICROWAVE AND MILLIMETER-WAVE SIGNALS
TABLE 10.1 Regression Coefficients for Estimating Specific Attenuation
Frequency (GHz) k
H
k
V
a
H
a
V
2 0.000650 0.000591 1.121 1.075
6 0.00175 0.00155 1.308 1.265
8 0.00454 0.00395 1.327 1.310
10 0.0101 0.00887 1.276 1.264
12 0.0188 0.0168 1.217 1.200
20 0.0751 0.0691 1.099 1.065
30 0.187 0.167 1.021 1.000
40 0.350 0.310 0.939 0.929
Source: Table 1 from Ref. 1, courtesy of the ITU.
(10.4)
where
q is the elevation path angle
t is the polarization tilt angle (0, 45, and 90 degrees for horizontal, circular,
and vertical, respectively)
The values in Table 10.1 are used by both the ITU and Crane models and
apply equally to both terrestrial and satellite links when incorporated into the
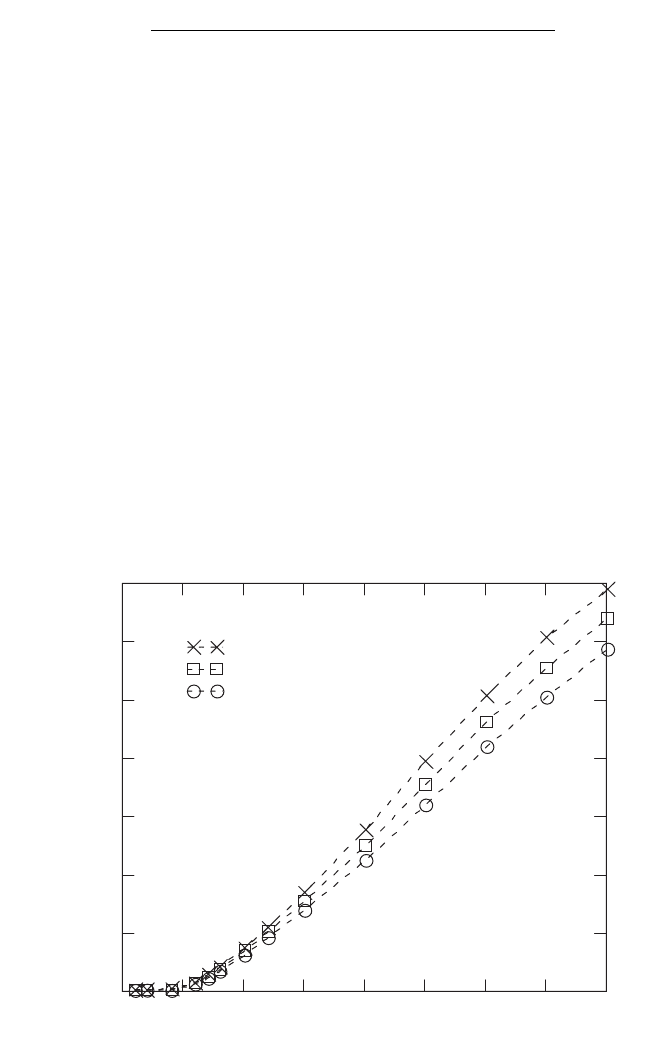
models. The coefficients suggest that the effect of rain on horizontally polar-
ized signals is greater than that for vertically polarized signals. This is in fact
true and is generally attributed to the vertically elongated shape of most rain-
drops. The effect on circularly (right-hand or left-hand) polarized signals is in
between the two as might be expected. Figure 10.3 shows plots of the specific
attenuation for a 50-mm/h rainfall rate at frequencies up to 40 GHz. The indi-
cated data points are where the given ITU regression coefficients occur.
a
aa aa qt
=
++ -
()()()
[]
kkkk
k
HH VV HH VV
cos cos
2
2
2
RAIN FADES 223
0 5 10 15 20 25 30 35 40
0
2
4
6
8
10
12
14
Horizontal
Circular
Vertical
Specific Attenuation for 50-mm/h Rain
Frequency (GHz)
Specific Attenuation (dB/km)
Figure 10.3 Comparison of specific attenuations for different polarizations versus
frequency.

10.3.2 The ITU Model
The ITU rain attenuation model is given by Ref. 8. The first step in applying
the ITU model for a given availability on a horizontal or nearly horizontal
communications link is to determine the 99.99% fade depth.
(10.5)
where
RR is the 99.99% rain rate for the rain region, in mm/h
k · RR
a
is the specific attenuation in dB/km
d is the link distance in km
and
(10.6)
with
(10.7)
The parameter d
0
is the effective path length and r is called the distance factor.
The specific attenuation is computed using the 99.99% rain rate for the desired
location and season and the appropriate regression coefficients, k and a, for
the frequency and polarization in use as given in Table 10A.1 and Table 10A.3
[10–14]. The rain rates based on geographical regions [11] are the most widely
used and easily applied method of determining the rain rate. The ITU has
released an updated model [12] that is discussed in Section 10.3.4.
These factors are used to model the fact that rain attenuation is not linear
with distance. Simply multiplying the specific attenuation by the link distance
does not provide an accurate estimate of the rain fade in most circumstances.
Table 10.2 gives the 99.99% availability rain rates for the ITU model [11]. Data
for other availabilities are also included in Appendix 10A. The procedure just
described is validated for frequencies up to at least 40 GHz and distances up
to 60 km [8].
The fade depths for availabilities other than 99.99% can be found using
other data, or preferably by applying an adjustment factor [8].
de
RR
0
0 015
35=
-◊.
km
rdd=+
()
11
0
Atten dB
001.
=◊ ◊◊kRR dr
a
224 RAIN ATTENUATION OF MICROWAVE AND MILLIMETER-WAVE SIGNALS
TABLE 10.2 ITU Rain Rate Data for 0.01% Rain Fades
ABCDEFGH JK LMNP
8 1215 19222830323542606395145
Source: Table 1 from Ref. 12, courtesy of the ITU.
(10.8)
for latitudes greater than 30 degrees, North or South, and
(10.9)
for latitudes below 30 degrees, North or South, where p is the desired prob-
ability (100 - availability) expressed as a percentage.
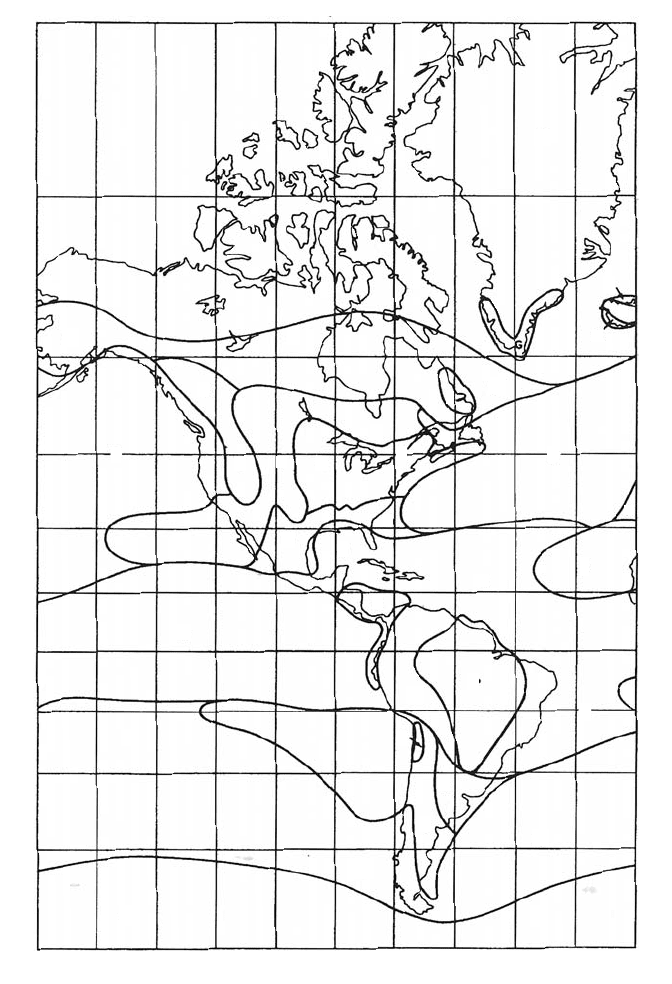
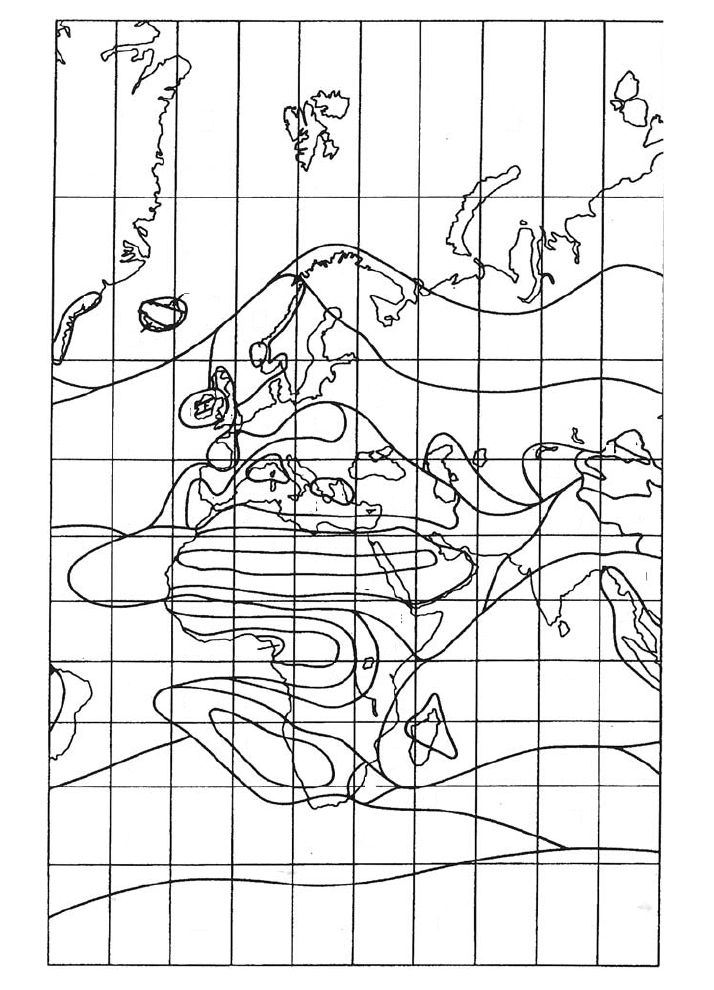
ITU rain regions for the Americas, for Europe and Africa, and for Asia are
shown in Figures 10.4, 10.5, and 10.6, respectively.
Example 10.1. For the link given in Figure 10.1, determine the depth of a
99.999% fade if the link is located in Florida.
f = 38.6 GHz; since polarization is not specified, assume horizontal polar-
ization (worst case).
By interpolation, at 38.6 GHz,
Florida is in ITU rain region N, where 0.01% rain rate is 95 mm/h.
Using the four-nines rain rate, the specific attenuation is
The effective path length is
The distance factor is
So the expected fade depth is
Next the predicted attenuation is adjusted to the desired availability using
(10.9):
Since five-nines data are also available, we could use those data to compute
attenuation directly. This is not usually done, however, since the ITU model is
Atten Atten
Atten dB
0.01
=◊◊
()
-+
()()
=
0 07 0 001 0 855 0 139 0 001
34 3
. . . . log .
.
dr◊◊ =Atten dB
001
23 8
.
.
rdd=+
()
=+
()
=1 1 1 1 11 84 0884
0
.. .
de
RR
0
0 015
35 8 417==
-◊.
.km
Atten dB km
001
095
0 324 95 24 5
.
.
..=◊ = ◊ =kRR
a
k ==0 324 0 95., .a
Atten Atten
001
0 07 0 855 0 139
.
. . . log=-+
()()
pp
Atten Atten
001
0 12 0 546 0 043
.
. . . log=-+
()()
pp
RAIN FADES 225
226 RAIN ATTENUATION OF MICROWAVE AND MILLIMETER-WAVE SIGNALS
165° 135° 105° 75° 45° 15°
165°
60°
30°
0°
30°
60°
135° 105° 75° 45° 15°
60°
30°
0°
30°
60°
A
C
C
C
D
B
B
E
E
H
F
F
E
G
E
P
E
E
N
D
A
E
D
D
A
E
K
C
N
P
N
E
M
N
N
M
K
K
B
A
Figure 10.4 ITU rain regions for the Americas (Figure 1 from Ref. 12, courtesy of the
ITU.)
RAIN FADES 227
45° 15° 15° 45° 75° 105°0°
45°
60°
30°
0°
30°
60°
60°
30°
0°
30°
60°
15° 15° 45° 75° 105°0°
A
E
E
E
E
E
E
L
L
J
E
E
N
N
G
G
C
G
G
F
F
H
H
C
A
K
K
C
C
D
N
P
N
K
A
A
B
C
EK
K
K
C
E
J
N
K
J
E
C
E
N
QP
K
N
F
F
P
DD
A
A
H
K
K
C
A
Figure 10.5 ITU rain regions for Europe and Africa. (Figure 2 from Ref. 12, courtesy
of the ITU.)
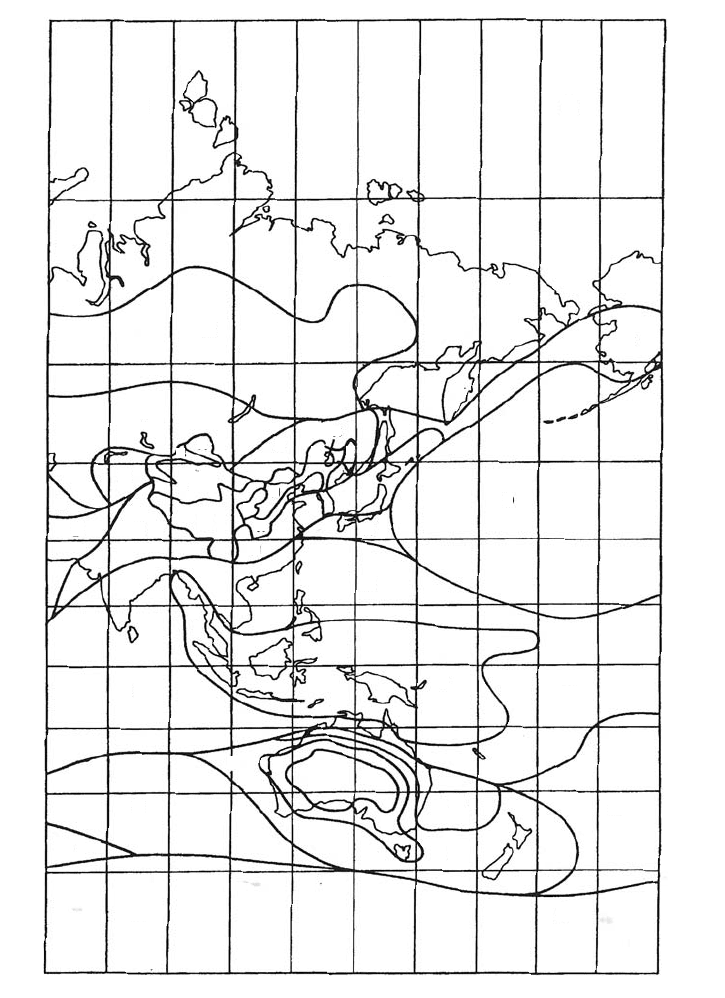
228 RAIN ATTENUATION OF MICROWAVE AND MILLIMETER-WAVE SIGNALS
60° 90° 120° 150° 180° 150°
60°
60°
30°
30°
60°
0°
60°
30°
30°
60°
0°
90° 120° 150° 180° 150°
A
A
A
C
D
C
E
E
K
K
F
J
G
C
K
M
N
P
N
D
M
K
F
F
F
D
A
A
K
E
A
A
B
D
E
E
H
K
M
P
N
C
C
Figure 10.6 ITU rain regions for Asia. (Figure 3 from Ref. 12, courtesy of the ITU.)
based on the four-nines data and the five-nines data has lower confidence since
there is less data available. 䊐
10.3.3 The Crane Global Model
The Crane global model is divided into two segments based on distance and
the rain rate [15]. The attenuation model is given by
(10.10)
and
(10.11)
where d(RR) is a function of the rain rate,
(10.12)
d is link distance in km, y is defined as,
(10.13)
and
(10.14)
From the above equations, it can be correctly inferred that the Crane model
is only validated for distances up to 22.5 km. Like the ITU model, the Crane
model also uses the rain region concept. The Crane rain regions are also
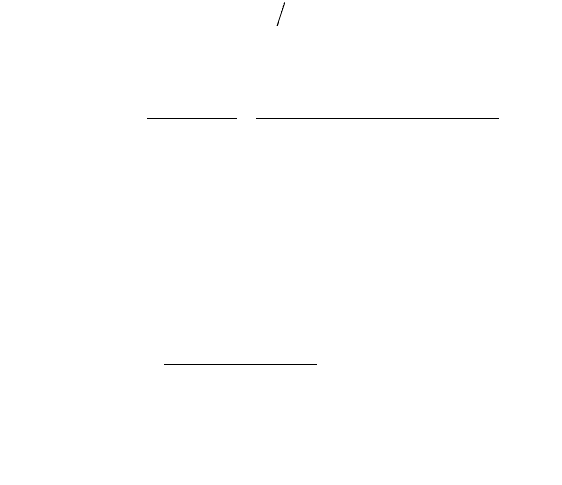
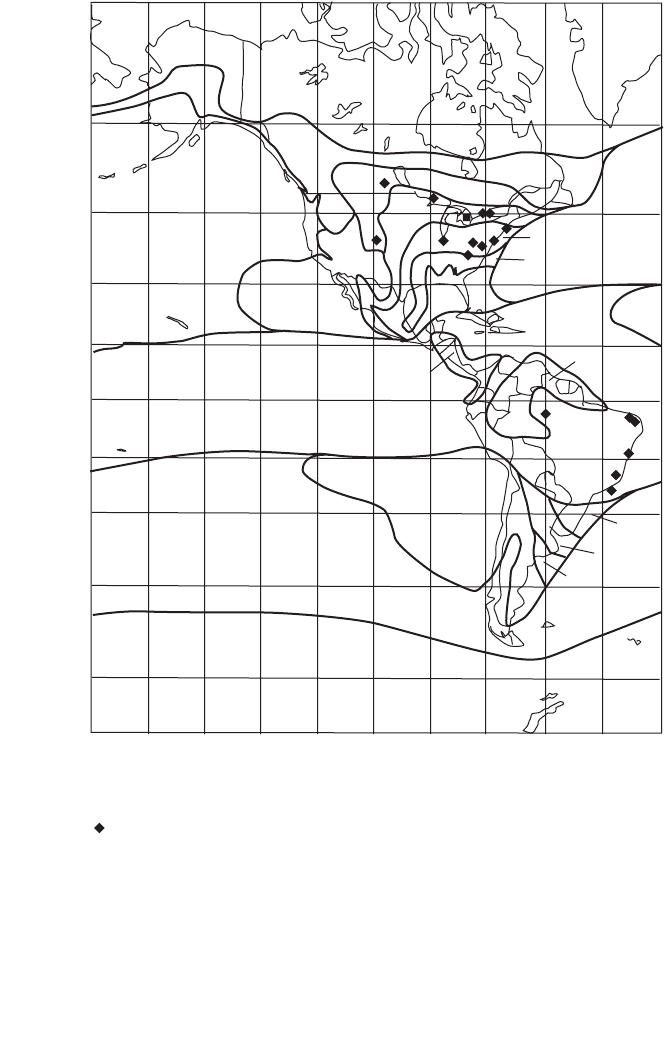
labeled alphabetically, but they do not correspond to the ITU regions. Figure
10.7 through Figure 10.9 show the Crane rain regions.
Crane uses different data sets for various probabilities/availabilities, and he
does not employ an availability adjustment factor like the ITU model. Table
10.3 gives some of the Crane data for common availabilities, while Table 10A.4
provides the complete set of Crane rain rate values as given in Ref. 16. If the
desired availability is not represented in the Crane data, it is possible to (log-
arithmically) interpolate the given data to estimate the rain rate. While not
sanctioned by Dr. Crane, this method provides reasonable information as
shown in Figure 10.10 using data for rain region E.
Example 10.2. For the link given in Figure 10.1, determine the depth of a
0.99999 fade if the link is located in Florida.
zRR=◊ -
()()
a 0 026 0 03..ln
y
RR
RR
RR=◊
-
()
()
+-
()
È
Î
Í
˘
˚
˙
a
d
083 017
026 003
..ln
..ln
d RR RR
()
=-
()
38 06. . ln km
Atten k RR
e
y
ee e
z
dB
RR d
yRR
zd
zRR RR
=◊
-
+
-
()
◊
È
Î
Í
˘
˚
˙
()
<<
◊
()
◊
◊
()
-
()
a
d
d
d
1
22 5
083 017..ln
,
. km
Atten k RR e y d RR
y
=◊ -
()
<<
()
◊
a
d
d10dB km
RAIN FADES 229
230 RAIN ATTENUATION OF MICROWAVE AND MILLIMETER-WAVE SIGNALS
C
B1
B2
D1
D2
D3
D3
D2
D1
E
H
F
H
G
F
C
F
A
A
C
G
60
30
0
–30
Latitude (deg)
–60
–180 –150 –120 –90 –60 –30
Longitude (deg)
Path locations for rain attenuation measurements
Figure 10.7 Crane rain regions for the Americas. (Figure 3.2 from Ref. 2, courtesy of
John Wiley & Sons.)
f = 38.6 GHz; since polarization is not specified, assume horizontal polar-
ization (worst case).
By interpolation, at 38.6 GHz,
(these are same coefficients as used for ITU model).
k ==0 324 0 95., .a
Florida is in Crane rain region E, where the 0.001% rain rate is 176 mm/h
(versus 180 mm/h for ITU region N):
Since d = 1.1 km, (10.11) applies with
d
d
RR RR
()
=-
()
()
=-
()
38 06
176 3 8 0 6 176
..ln
..ln
km
km
RAIN FADES 231
A
C
D3
B
B2
B1
D2
D1
D3
E
H
G
H
H
G
F
D2
D1
F
D1
D2
D3
C
A
F
F
60
30
–30
–60
–30 0 30 60 90 120
0
Longitude (deg)
Path locations for rain attenuation measurements
Latitude (deg)
Figure 10.8 Crane rain regions for Europe and Africa. (Figure 3.3 from Ref. 2, cour-
tesy of John Wiley & Sons.)