Smith R., Minton R. Calculus
Подождите немного. Документ загружается.

P1: OSO/OVY P2: OSO/OVY QC: OSO/OVY T1: OSO
MHDQ256-Ch02 MHDQ256-Smith-v1.cls December 8, 2010 18:21
LT (Late Transcendental)
CONFIRMING PAGES
2-17 SECTION 2.2
..
The Derivative 123
Likewise, if h < 0, (2 +h) < 2 and so, f (2 + h) = 4. Thus, we have
lim
h→0
−
f (2 +h) − f (2)
h
= lim
h→0
−
4 − 4
h
= 0.
Since the one-sided limits do not agree (0 = 2), f
(2) does not exist (i.e., f is not
differentiable at x = 2).
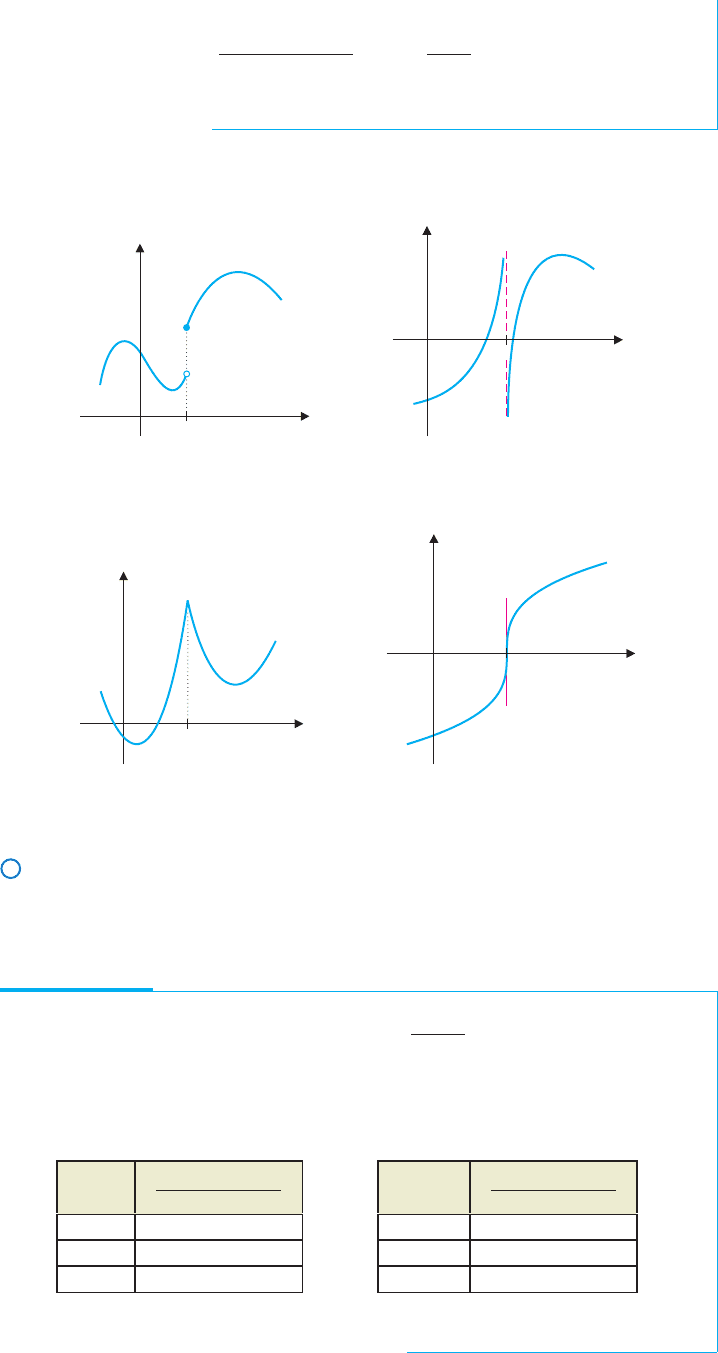
Figures 2.19a–2.19d show a variety of functions for which f
(a) does not exist. In each
case, convince yourself that the derivative does not exist.
y
x
a
a
y
x
FIGURE 2.19a
A jump discontinuity
FIGURE 2.19b
A vertical asymptote
a
y
x
a
y
x
FIGURE 2.19c
A cusp
FIGURE 2.19d
A vertical tangent line
Numerical Differentiation
There are many times in applications when it is not possible or practical to compute deriva-
tives symbolically. This is frequently the case where we have only some data (i.e., a table
of values) representing an otherwise unknown function.
EXAMPLE 2.8 Approximating a Derivative Numerically
Numerically estimate the derivative of f (x) = x
2
√
x
3
+ 2atx = 1.
Solution Although working through the limit definition of derivative for this function
is a challenge, the definition tells us that the derivative at x = 1 is the limit of slopes of
secant lines. We compute some of these below:
h
f (1 h) − f (1)
h
0.1 4.7632
0.01 4.3715
0.001 4.3342
h
f (1 h) − f (1)
h
−0.1 3.9396
−0.01 4.2892
−0.001 4.3260
Notice that the slopes seem to be converging to approximately 4.33 as h approaches 0.
Thus, we make the approximation f
(1) ≈ 4.33.

P1: OSO/OVY P2: OSO/OVY QC: OSO/OVY T1: OSO
MHDQ256-Ch02 MHDQ256-Smith-v1.cls December 8, 2010 18:21
LT (Late Transcendental)
CONFIRMING PAGES
124 CHAPTER 2
..
Differentiation 2-18
Time Average
Interval Velocity
(5.9, 6.0) 35.0 ft/s
(6.0, 6.1) 35.2 ft/s
Time Average
Interval Velocity
(5.5, 6.0) 34.78 ft/s
(5.8, 6.0) 34.95 ft/s
(5.9, 6.0) 35.00 ft/s
(6.0, 6.1) 35.20 ft/s
(6.0, 6.2) 35.10 ft/s
(6.0, 6.5) 34.90 ft/s
EXAMPLE 2.9 Estimating Velocity Numerically
Suppose that a sprinter reaches the following distances in the given times. Estimate the
velocity of the sprinter at the 6-second mark.
t (s) 5.0 5.5 5.8 5.9 6.0 6.1 6.2 6.5 7.0
f (t) (ft) 123.7 141.01 151.41 154.90 158.40 161.92 165.42 175.85 193.1
Solution The instantaneous velocity is the limit of the average velocity as the time
interval shrinks. We first compute the average velocities over the shortest intervals
given, from 5.9 to 6.0 and from 6.0 to 6.1.
Since these are the best individual estimates available from the data, we could just
split the difference and estimate a velocity of 35.1 ft/s. However, there is useful
information in the rest of the data. Based on the accompanying table, we can conjecture
that the sprinter was reaching a peak speed at about the 6-second mark. Thus, we might
accept the higher estimate of 35.2 ft/s. We should emphasize that there is not a single
correct answer to this question, since the data are incomplete (i.e., we know the distance
only at fixed times, rather than over a continuum of times).
BEYOND FORMULAS
In sections 2.3–2.7, we derive numerous formulas for computing derivatives. As you
learn these formulas, keep in mind the reasons that we are interested in the derivative.
Careful studies of the slope of the tangent line to a curve and the velocity of a moving
objectled us to thesamelimit,whichwe named the derivative.Ingeneral,the derivative
represents the instantaneous rate of change of one quantity with respect to another
quantity.Thestudyofchangeinaquantifiablewayhasleddirectlytocountlessadvances
in modern science and engineering.
EXERCISES 2.2
WRITING EXERCISES
1. The derivative is important because of its many different
uses and interpretations. Describe four aspects of the deriva-
tive: graphical (think of tangent lines), symbolic (the deriva-
tive function), numerical (approximations) and applications
(velocity and others).
2. Mathematicians often use the word “smooth” to describe func-
tions with certain properties. Graphically, how are differen-
tiable functions smoother than functions that are continuous
but not differentiable, or functions that are not continuous?
3. Briefly describe what the derivative tells you about the original
function. In particular, if the derivative is positive at a point,
what do you know about the trend of the functionat that point?
What is different if the derivative is negative at the point?
4. Show that the derivative of f (x) = 3x − 5is f
(x) = 3.
Explain in terms of slope why this is true.
In exercises 1–4, compute f
(a) using the limits (2.1)
and (2.2).
1. f (x) = 3x + 1, a = 1 2. f (x) = 3x
2
+ 1, a = 1
3. f (x) =
√
3x + 1, a = 1 4. f (x) =
3
x + 1
, a = 2
............................................................
In exercises 5–12, compute the derivative function f
using (2.1)
or (2.2).
5. f (x) = 3x
2
+ 1 6. f (x) = x
2
− 2x + 1
7. f (x) = x
3
+ 2x − 1 8. f (x) = x
4
− 2x
2
+ 1
9. f (x) =
3
x + 1
10. f (x) =
2
2x − 1
11. f (t) =
√
3t + 1 12. f (t) =
√
2t + 4
............................................................
P1: OSO/OVY P2: OSO/OVY QC: OSO/OVY T1: OSO
MHDQ256-Ch02 MHDQ256-Smith-v1.cls December 9, 2010 19:59
LT (Late Transcendental)
CONFIRMING PAGES
2-19 SECTION 2.2
..
The Derivative 125
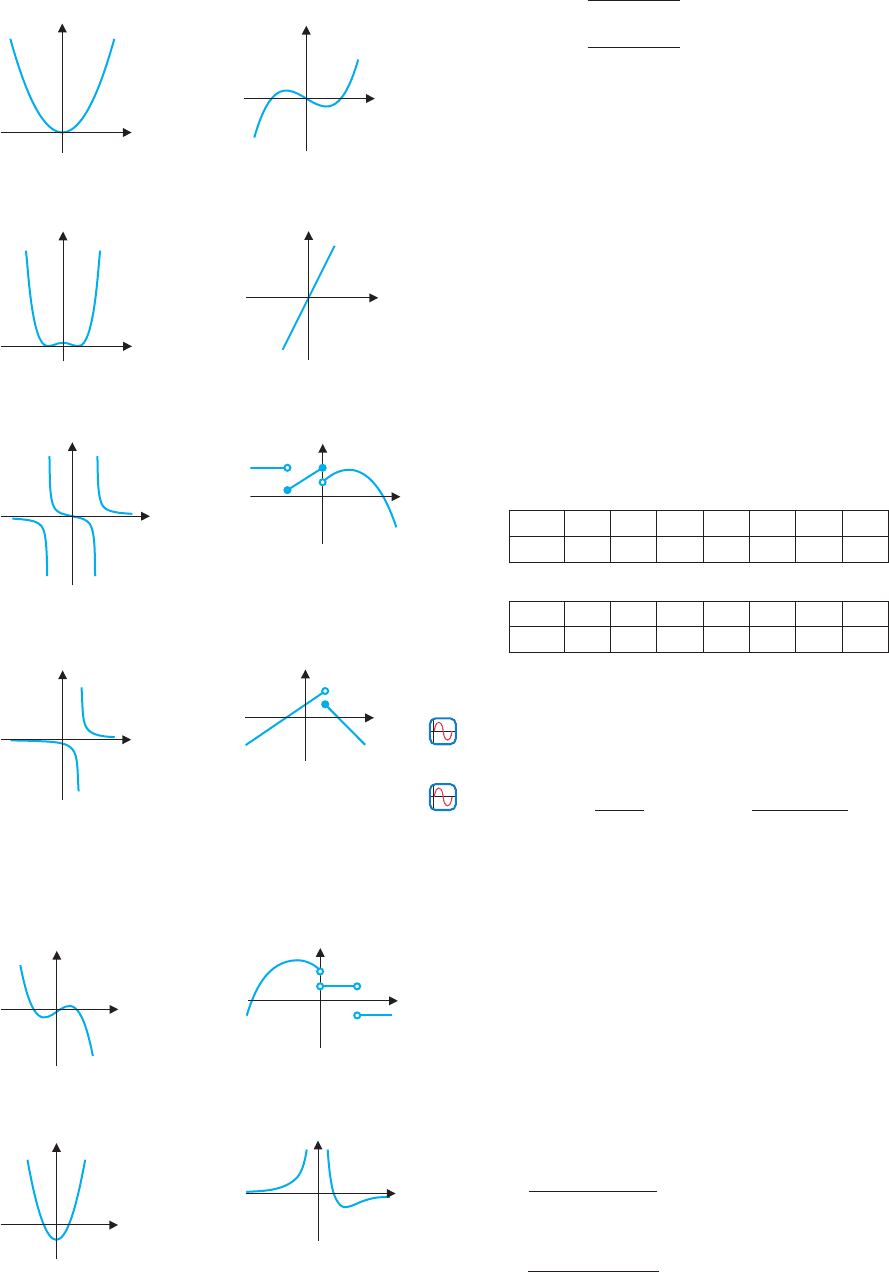
In exercises 13–16, use the graph of f to sketch a graph of f
.
13.
(a)
y
x
(b)
y
x
14.
(a)
y
x
(b)
y
x
15.
(a)
y
x
(b)
y
x
16.
(a)
y
x
(b)
y
x
............................................................
In exercises 17 and 18, use the given graph of f
to sketch a
plausible graph of a continuous function f .
17.
(a)
y
x
(b)
y
x
18.
(a)
y
x
(b)
y
x
............................................................
In exercises 19–22, compute the right-hand derivative
D
f (0) lim
h→0
f (h) − f (0)
h
and the left-hand derivative
D
−
f (0) lim
h→0
−
f (h) − f (0)
h
. Does f
(0) exist?
19. f (x) =
2x + 1ifx < 0
3x + 1ifx ≥ 0
20. f (x) =
0ifx < 0
2x if x ≥ 0
21. f (x) =
x
2
if x < 0
x
3
if x ≥ 0
22. f (x) =
2x if x < 0
x
2
+ 2x if x ≥ 0
............................................................
In exercises 23 and 24, use the distances f (t) to estimate the
velocity at t 2.
23.
t 1.7 1.8 1.9 2.0 2.1 2.2 2.3
f (t) 3.1 3.9 4.8 5.8 6.8 7.7 8.5
24.
t 1.7 1.8 1.9 2.0 2.1 2.2 2.3
f (t) 4.6 5.3 6.1 7.0 7.8 8.6 9.3
............................................................
25. Graphand identify all x-valuesatwhich f is not differentiable.
(a) f (x) =|x|+|x − 2|; (b) f (x) =|x
2
− 4x|
26. Graphand identify all x-valuesatwhich f is not differentiable.
(a) f (x) =
√
x
3
− x; (b) f (x) =
3
√
x
4
− 4x
2
+ 4
27. For f (x) = x
p
, find all real numbers p such that f
(0) exists.
28. For f (x) =
x
2
+ 2x, ifx ≤ 0
ax +b, if x > 0
find all numbers a and b
such that f
(0) exists.
29. Give an example showing that the following is not true for all
functions f :if f (x) ≤ x, then f
(x) ≤ 1.
30. Determine whether the following is true for all functions f :if
f (0) = 0, f
(x) exists for all x and f (x) ≤ x, then f
(x) ≤ 1
for all x.
31. If f is differentiable at x = a = 0, evaluate
lim
x→a
[ f (x)]
2
− [ f (a)]
2
x
2
− a
2
.
32. Prove that if f is differentiable at x = a, then
lim
h→0
f (a + ch) − f (a)
h
= cf
(a).
P1: OSO/OVY P2: OSO/OVY QC: OSO/OVY T1: OSO
MHDQ256-Ch02 MHDQ256-Smith-v1.cls December 8, 2010 18:21
LT (Late Transcendental)
CONFIRMING PAGES
126 CHAPTER 2
..
Differentiation 2-20
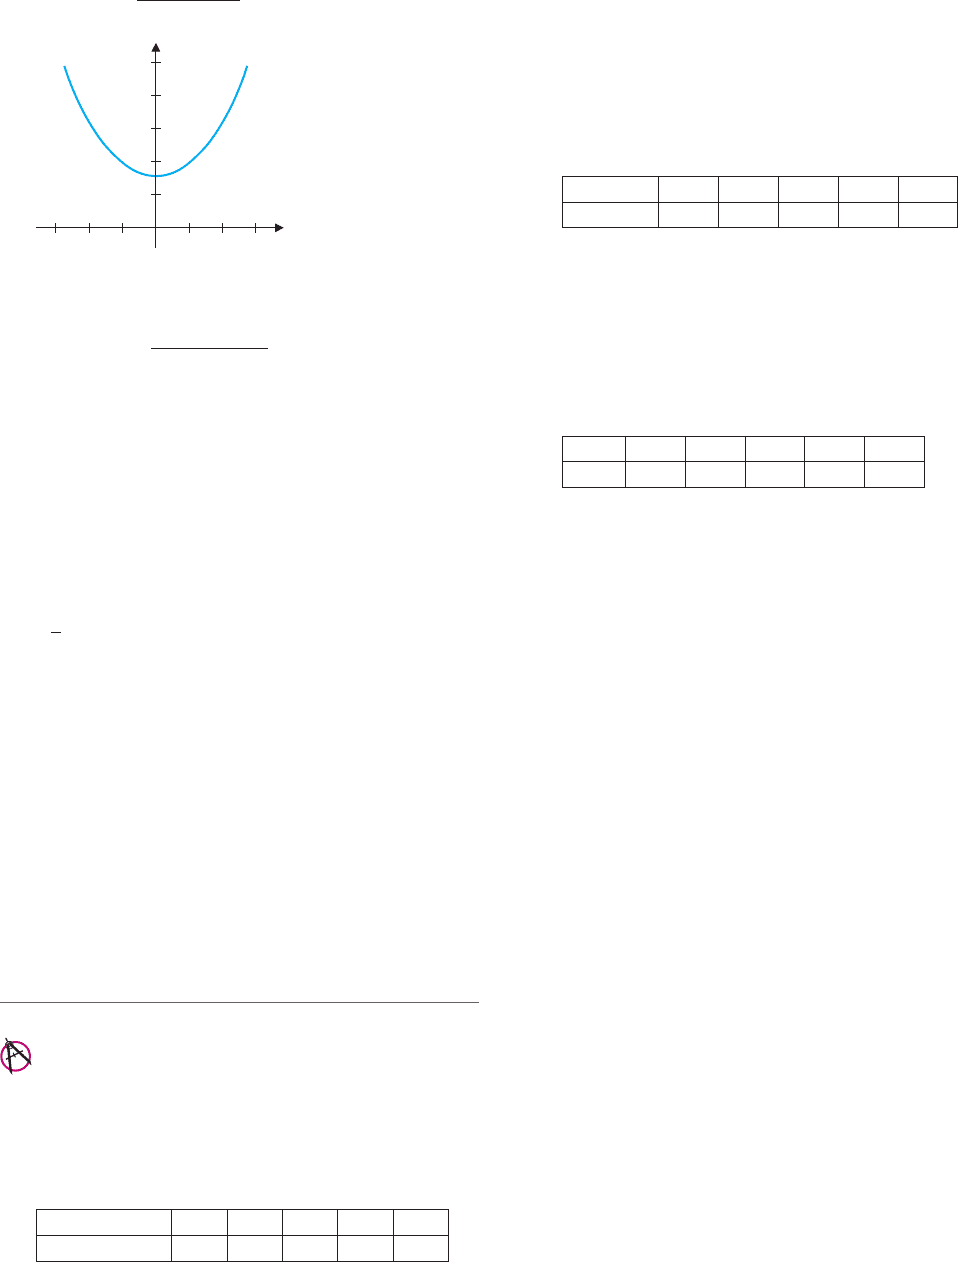
33. Use the graph to list the following in increasing order: f (1),
f (2) − f (1),
f (1.5) − f (1)
0.5
, f
(1).
y
x
2
6
4
8
10
3212 13
Exercises 33 and 34
34. Use the graph to list the following in increasing order: f (0),
f (0) − f (−1),
f (0) − f (−0.5)
0.5
, f
(0).
35. Sketch the graph of a function with the following prop-
erties: f (0) = 1, f (1) = 0, f (3) = 6, f
(0) = 0, f
(1) =−1
and f
(3) = 4.
36. Sketch the graph of a function with the following properties:
f (−2) = 4, f (0) =−2, f (2) = 1, f
(−2) =−2, f
(0) = 2
and f
(2) = 1.
37. Compute the derivative function for x
2
, x
3
and x
4
. Based on
your results, identify the pattern and conjecture a general for-
mula for the derivative of x
n
.
38. Test your conjecture from exercise 37 on the functions
√
x = x
1/2
and 1/x = x
−1
.
39. Assume that f (x) =
g(x)ifx < 0
k(x)ifx ≥ 0
.If f is continuous at
x = 0 and g and k are differentiable at x = 0, prove that
D
+
f (0) = k
(0) and D
−
f (0) = g
(0). Which statement is not
true if f has a jump discontinuity at x = 0?
40. Explain why the derivative f
(0) exists if and only if the one-
sided derivatives exist and are equal.
41. If f
(x) > 0 for all x, use the tangent line interpretation to ar-
gue that f is an increasing function; that is, if a < b, then
f (a) < f (b).
42. If f
(x) < 0 for all x, use the tangent line interpretation to
argue that f is a decreasing function; that is, if a < b, then
f (a) > f (b).
APPLICATIONS
43. The table showsthe marginof error in degreesfor tennis serves
hitfromaheightofx meters.(DatafromJakeBennett,Roanoke
College.) Estimate the value of the derivative of the margin of
error at x = 2.5 and interpret the derivative in terms of the
benefit of hitting a serve from greater heights.
x meters 2.39 2.5 2.7 2.85 3
Margin of error 1.11 1.29 1.62 1.87 2.12
44. Use the table in exercise 43 to estimate the derivative at
x = 2.85. Compare to the estimate in exercise 43.
45. The Environmental Protection Agency uses the measurement
of ton-MPG to evaluate the power-train efficiency of vehicles.
The ton-MPG rating of a vehicle is given by the weight of the
vehicle (in tons) multiplied by a rating of the vehicle’s fuel ef-
ficiency in miles per gallon. Several years of data for new cars
are given in the table. Estimate the rate of change of ton-MPG
in (a) 1994 and(b) 2000. Do your estimatesimply that cars are
becoming more or less efficient? Is the rate of change constant
or changing?
Year 1992 1994 1996 1998 2000
Ton-MPG 44.9 45.7 46.5 47.3 47.7
46. The fuel efficiencies in miles per gallon of cars from 1992 to
2000 are shown in the following table. Estimate the rate of
change in MPG in (a) 1994 and (b) 2000. Do your estimates
imply that cars are becoming more or less fuel efficient? Com-
paring your answers to exercise 45, what must be happening to
the average weight of cars? If weight had remained constant,
what do you expect would have happened to MPG?
Year 1992 1994 1996 1998 2000
MPG 28.0 28.1 28.3 28.5 28.1
............................................................
In exercises 47 and 48, give the units for the derivative function.
47. (a) f (t) represents position, measured in meters, at time
t seconds.
(b) f (x) represents the demand, in number of items, of a
product when the price is x dollars.
48. (a) c(t)represents the amount of a chemical present, in grams,
at time t minutes.
(b) p(x) represents the mass, in kg, of the first x meters of a
pipe.
............................................................
49. Let f (t) represent the trading value of a stock at time t days.
If f
(t) < 0, what does that mean about the stock? If you held
some shares of this stock, should you sell what you have or
buy more?
50. Suppose that there are two stocks with trading values f (t) and
g(t), where f (t) > g(t) and 0 < f
(t) < g
(t). Based on this
information, which stock should you buy? Briefly explain.
51. One model for the spread of a disease assumes that at first
the disease spreads very slowly, gradually the infection rate
increases to a maximum and then the infection rate decreases
back to zero, marking the end of the epidemic. If I (t) repre-
sents the number of peopleinfected at time t,sketch a graph of
both I(t) and I
(t), assumingthat thosewho getinfected donot
recover.
52. One model for urban population growth assumes that at first,
the population is growing very rapidly, then the growth rate
decreases until the population starts decreasing. If P(t) is the
population at time t, sketch a graph of both P(t) and P
(t).
53. A phone company charges 1 dollar for the first 20 minutes of a
call, then 10 cents per minute for the next 60 minutes and

P1: OSO/OVY P2: OSO/OVY QC: OSO/OVY T1: OSO
MHDQ256-Ch02 MHDQ256-Smith-v1.cls December 8, 2010 18:21
LT (Late Transcendental)
CONFIRMING PAGES
2-21 SECTION 2.3
..
Computation of Derivatives: The Power Rule 127
8 cents per minute for each additional minute (or partial
minute). Let f (t) be the price in cents of a t-minute phone
call, t > 0. Determine f
(t) as completely as possible.
54. A state charges 10% income tax on thefirst $20,000 of income
and 16% on income over $20,000. Let f (t) be the state tax on
$t of income. Determine f
(t) as completely as possible.
EXPLORATORY EXERCISES
1. Supposethereisacontinuousfunction F(x)suchthat F(1) = 1
and F(0) = f
0
, where 0 < f
0
< 1. If F
(1) > 1, show graph-
ically that the equation F(x) = x has a solution q where
0 < q < 1. (Hint: Graph y = x and a plausible F(x) and look
for intersections.) Sketch a graph where F
(1) < 1 and there
are no solutions to the equation F(x) = x with 0 < x < 1.
Solutions have a connection with the probability of the ex-
tinction of animals or family names. Suppose you and your
descendants have children according to the following prob-
abilities: f
0
= 0.2 is the probability of having no children,
f
1
= 0.3 is the probability of having exactly one child, and
f
2
= 0.5 is the probability of having two children. Define
F(x) = 0.2 + 0.3x + 0.5x
2
and showthat F
(1) > 1. Find the
solution of F(x) = x between x = 0 and x = 1; this number is
the probability that your “line” will go extinct some time into
the future. Find nonzero values of f
0
, f
1
and f
2
such that the
corresponding F(x) satisfies F
(1) < 1 and hence the proba-
bility of your line going extinct is 1.
2. Thesymmetric differencequotient ofafunction f centeredat
x = a has the form
f (a + h) − f (a − h)
2h
.If f (x) = x
2
+ 1
and a = 1, illustrate the symmetric difference quotient as a
slopeofasecantlinefor h = 1andh = 0.5.Based onyourpic-
ture, conjecture the limit of the symmetric difference quotient
as h approaches 0. Then compute the limit and compare to the
derivative f
(1) found in example 1.1. For h = 1, h = 0.5 and
h = 0.1, compare the actualvaluesofthe symmetric difference
quotient and the usual difference quotient
f (a + h) − f (a)
h
.
In general, which difference quotient provides a better esti-
mate of the derivative? Next, compare the values of the dif-
ference quotients with h = 0.5 and h =−0.5 to the derivative
f
(1). Explain graphically why one is smaller and one is larger.
Compare the average of these two difference quotients to the
symmetric difference quotient with h = 0.5. Use this result
to explain why the symmetric difference quotient might pro-
vide a better estimate of the derivative. Next, compute sev-
eral symmetric difference quotients of f (x) =
4ifx < 2
2x if x ≥ 2
centered at a = 2. Recall that in example 2.7 we showed that
the derivative f
(2) does not exist. Given this, discuss one
major problem with using the symmetric difference quotient
to approximate derivatives. Finally, show that if f
(a) exists,
then lim
h→0
f (a + h) − f (a − h)
2h
= f
(a).
2.3 COMPUTATION OF DERIVATIVES: THE POWER RULE
You have now computed numerous derivatives using the limit definition. In fact, you may
havecomputedenoughthatyouhavestartedtakingsomeshortcuts.Wecontinuethatprocess
in this section, by developing some basic rules.
The Power Rule
We first revisit the limit definition of derivative to compute two very simple derivatives.
For any constant c,
d
dx
c = 0. (3.1)
y
x
a
c
y c
FIGURE 2.20
A horizontal line
Notice that (3.1) says that for any constant c, the horizontal line y = c has a tangent
line with zero slope. That is, the tangent line to a horizontal line is the same horizontal line.
(See Figure 2.20.)
To prove equation (3.1), let f (x) = c, for all x. From the limit definition, we have
d
dx
c = f
(x) = lim
h→0
f (x +h) − f (x)
h
= lim
h→0
c −c
h
= lim
h→0
0 = 0.
P1: OSO/OVY P2: OSO/OVY QC: OSO/OVY T1: OSO
MHDQ256-Ch02 MHDQ256-Smith-v1.cls December 8, 2010 18:21
LT (Late Transcendental)
CONFIRMING PAGES
128 CHAPTER 2
..
Differentiation 2-22
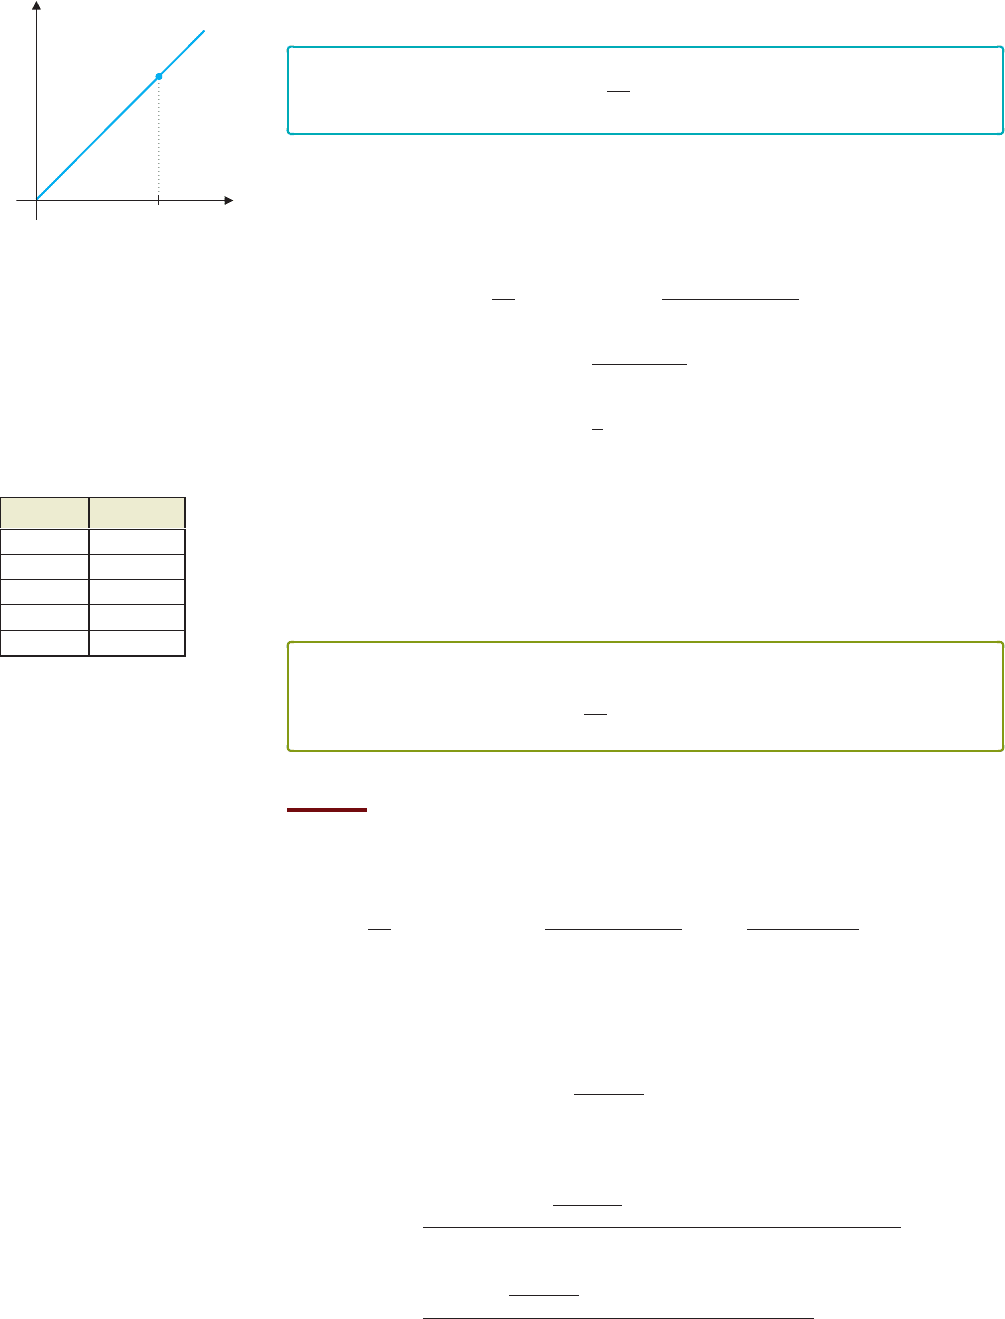
Similarly, we have
d
dx
x = 1. (3.2)
y
x
a
y x
FIGURE 2.21
Tangent line to y = x
Notice that (3.2) says that the tangent line to the line y = x is a line of slope one (i.e.,
y = x; see Figure 2.21), which is not surprising.
To verify equation (3.2), we let f (x) = x. From the limit definition, we have
d
dx
x = f
(x) = lim
h→0
f (x +h) − f (x)
h
= lim
h→0
(x + h) − x
h
= lim
h→0
h
h
= lim
h→0
1 = 1.
The table shown in the margin presents a short list of derivatives calculated previously
either as examples or in the exercises using the limit definition. Note that the power of x in
the derivative is always one less than the power of x in the original function. Further, the
coefficient of x in the derivative is the same as the power of x in the original function. This
suggests the following result.
f (x) f
(x)
1 = x
0
0
x = x
1
1x
0
= 1
x
2
2x
x
3
3x
2
x
4
4x
3
THEOREM 3.1 (Power Rule)
For any integer n > 0,
d
dx
x
n
= nx
n−1
.
PROOF
From the limit definition of derivative given in equation (2.3), if f (x) = x
n
, then
d
dx
x
n
= f
(x) = lim
h→0
f (x +h) − f (x)
h
= lim
h→0
(x + h)
n
− x
n
h
. (3.3)
To evaluate the limit, we will need to simplify the expression in the numerator. Recall that
(x + h)
2
= x
2
+ 2xh + h
2
and (x +h)
3
= x
3
+ 3x
2
h + 3xh
2
+ h
3
. More generally, you
may recall from the binomial theorem that for any positive integer n,
(x + h)
n
= x
n
+ nx
n−1
h +
n(n −1)
2
x
n−2
h
2
+···+nxh
n−1
+ h
n
. (3.4)
Substituting (3.4) into (3.3), we get
f
(x) = lim
h→0
x
n
+ nx
n−1
h +
n(n −1)
2
x
n−2
h
2
+···+nxh
n−1
+ h
n
− x
n
h
Cancel
x
n
terms.
= lim
h→0
nx
n−1
h +
n(n −1)
2
x
n−2
h
2
+···+nxh
n−1
+ h
n
h

P1: OSO/OVY P2: OSO/OVY QC: OSO/OVY T1: OSO
MHDQ256-Ch02 MHDQ256-Smith-v1.cls December 8, 2010 18:21
LT (Late Transcendental)
CONFIRMING PAGES
2-23 SECTION 2.3
..
Computation of Derivatives: The Power Rule 129
= lim
h→0
h
nx
n−1
+
n(n −1)
2
x
n−2
h
1
+···+nxh
n−2
+ h
n−1
h
Factor out
common h
and cancel.
= lim
h→0
nx
n−1
+
n(n −1)
2
x
n−2
h
1
+···+nxh
n−2
+ h
n−1
= nx
n−1
,
since every term but the first has a factor of h.
The power rule is very easy to apply, as we see in example 3.1.
EXAMPLE 3.1 Using the Power Rule
Find the derivative of (a) f (x) = x
8
and (b) g(t) = t
107
.
Solution (a) We have
f
(x) =
d
dx
x
8
= 8x
8−1
= 8x
7
.
(b) Similarly,
g
(t) =
d
dt
t
107
= 107t
107−1
= 107t
106
.
Recall that in section 2.2, we showed that
d
dx
1
x
=−
1
x
2
. (3.5)
Notice that we can rewrite (3.5) as
d
dx
x
−1
= (−1)x
−2
.
That is, the derivative of x
−1
follows the same pattern as the power rule that we just stated
and proved for positive integer exponents.
Likewise, in section 2.2, we used the limit definition to show that
d
dx
√
x =
1
2
√
x
. (3.6)
We can also rewrite (3.6) as
d
dx
x
1/2
=
1
2
x
−1/2
,
so that the derivative of this rational power of x also follows the same pattern as the power
rule that we proved for positive integer exponents.
REMARK 3.1
As we will see, the power rule
holds for any power of x.We
will not be able to prove this
fact for some time now, as the
proof of Theorem 3.1 does not
generalize, since the expansion
in equation (3.4) holds only for
positive integer exponents. Even
so, we will use the rule freely
for any power of x. We state this
in Theorem 3.2.
THEOREM 3.2 (General Power Rule)
For any real number r = 0,
d
dx
x
r
= rx
r−1
. (3.7)
The power rule is simple to use, as we see in example 3.2.
EXAMPLE 3.2 Using the General Power Rule
Find the derivative of (a) f (x) =
1
x
19
, (b) g(x) =
3
√
x
2
and (c) h(x) = x
π
.

P1: OSO/OVY P2: OSO/OVY QC: OSO/OVY T1: OSO
MHDQ256-Ch02 MHDQ256-Smith-v1.cls December 8, 2010 18:21
LT (Late Transcendental)
CONFIRMING PAGES
130 CHAPTER 2
..
Differentiation 2-24
Solution (a) From (3.7), we have
f
(x) =
d
dx
1
x
19
=
d
dx
x
−19
=−19x
−19−1
=−19x
−20
.
(b) If we rewrite
3
√
x
2
as a fractional power of x, we can use (3.7) to compute the
derivative, as follows.
g
(x) =
d
dx
3
√
x
2
=
d
dx
x
2/3
=
2
3
x
2/3−1
=
2
3
x
−1/3
.
(c) Finally, we have
h
(x) =
d
dx
x
π
= π x
π−1
.
Notice that there is the additional conceptual problem in example 3.2 (which we resolve in
Chapter 6) of deciding what x
π
means. Since the exponent isn’t rational, what exactly do
we mean when we raise a number to the irrational power π?
CAUTION
Be careful here to avoid a
common error:
d
dx
x
−19
=−19x
−18
.
The power rule says to
subtract 1 from the exponent
(even if the exponent is
negative).
General Derivative Rules
Thepowerrule givesus a largeclass of functions whose derivativeswe canquickly compute
without using the limit definition. The following rules for combining derivatives further
expand the number of derivatives we can compute without resorting to the definition. Keep
in mind that a derivative is a limit; the differentiation rules in Theorem 3.3 then follow
immediately from the corresponding rules for limits (found in Theorem 3.1 in Chapter 1).
THEOREM 3.3
If f and g are differentiable at x and c is any constant, then
(i)
d
dx
[ f (x) + g(x)] = f
(x) + g
(x),
(ii)
d
dx
[ f (x) − g(x)] = f
(x) − g
(x) and
(iii)
d
dx
[cf(x)] = cf
(x).
PROOF
We prove only part (i). The proofs of parts (ii) and (iii) are left as exercises. Let
k(x) = f (x) + g(x). Then, from the limit definition of the derivative (2.3), we get
d
dx
[ f (x) + g(x)] = k
(x) = lim
h→0
k(x + h) −k(x)
h
= lim
h→0
[ f (x + h) + g(x + h)] −[ f (x) + g(x)]
h
By definition of k(x).
= lim
h→0
[ f (x + h) − f (x)] + [g(x +h) − g(x)]
h
Grouping the f terms
together and the g terms
together.
= lim
h→0
f (x +h) − f (x)
h
+ lim
h→0
g(x + h) − g(x)
h
By Theorem 3.1
in Chapter 1.
= f
(x) + g
(x).
Recognizing the
derivatives of f and
of g.
We illustrate Theorem 3.3 by working through the calculation of a derivative step by
step, showing all of the details.
P1: OSO/OVY P2: OSO/OVY QC: OSO/OVY T1: OSO
MHDQ256-Ch02 MHDQ256-Smith-v1.cls January 21, 2011 7:48
LT (Late Transcendental)
CONFIRMING PAGES
2-25 SECTION 2.3
..
Computation of Derivatives: The Power Rule 131
EXAMPLE 3.3 Finding the Derivative of a Sum
Find the derivative of f (x) = 2x
6
+ 3
√
x.
Solution We have
f
(x) =
d
dx
(2x
6
) +
d
dx
3
√
x
By Theorem 3.3 (i).
= 2
d
dx
(x
6
) + 3
d
dx
(x
1/2
) By Theorem 3.3 (iii).
= 2(6x
5
) + 3
1
2
x
−1/2
By the power rule.
= 12x
5
+
3
2
√
x
.
Simplifying.
EXAMPLE 3.4 Rewriting a Function Before Computing the Derivative
Find the derivative of f (x) =
4x
2
− 3x + 2
√
x
x
.
Solution Since we don’t yet have any rule for computing the derivative of a quotient,
we first rewrite f (x) by dividing out the x in the denominator. We have
f (x) =
4x
2
x
−
3x
x
+
2
√
x
x
= 4x − 3 + 2x
−1/2
.
From Theorem 3.3 and the power rule (3.7), we get
f
(x) = 4
d
dx
(x) −3
d
dx
(1) + 2
d
dx
(x
−1/2
) = 4 − 0 + 2
−
1
2
x
−3/2
= 4 − x
−3/2
.
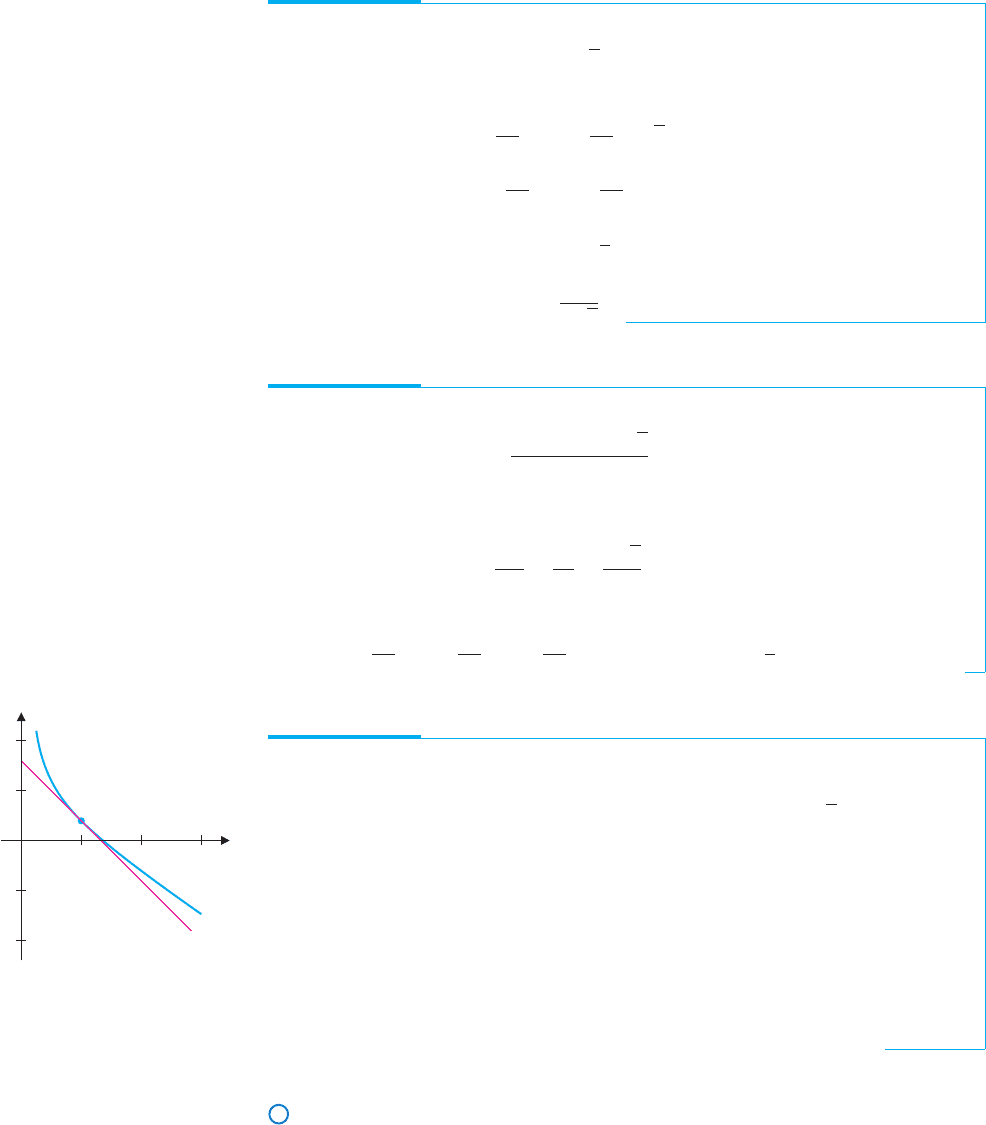
EXAMPLE 3.5 Finding an Equation of the Tangent Line
Find an equation of the tangent line to the graph of f (x) = 4 −4x +
2
x
at x = 1.
y
x
132
⫺10
⫺5
5
10
FIGURE 2.22
y = f (x) and the tangent line
at x = 1
Solution First, notice that f (x) = 4 −4x + 2x
−1
. From Theorem 3.3 and the power
rule, we have
f
(x) = 0 −4 − 2x
−2
=−4 −2x
−2
.
At x = 1, the slope of the tangent line is then f
(1) =−4 − 2 =−6. The line with
slope −6 through the point (1, 2) has equation
y − 2 =−6(x − 1).
We show a graph of y = f (x) and the tangent line at x = 1 in Figure 2.22.
Higher Order Derivatives
One consequence of having the derivative function is that we can compute the derivative of
a derivative. It turns out that such higher order derivatives have important applications.
Suppose we start with a function f and compute its derivative f
. We can then compute
the derivative of f
, called the second derivative of f and written f
. We can then compute
the derivative of f
, called the third derivative of f , written f
. We can continue to take
derivatives indefinitely. Next, we show common notations for the first five derivatives of f
[whereweassumethat y = f (x)].Notethatweuseprimesonlyforthefirstthreederivatives.
For fourth and higher derivatives, we indicate the order of the derivative in parentheses. Be
careful to distinguish these from exponents.

P1: OSO/OVY P2: OSO/OVY QC: OSO/OVY T1: OSO
MHDQ256-Ch02 MHDQ256-Smith-v1.cls December 8, 2010 18:21
LT (Late Transcendental)
CONFIRMING PAGES
132 CHAPTER 2
..
Differentiation 2-26
Order Prime Notation Leibniz Notation
1 y
= f
(x)
df
dx
2 y
= f
(x)
d
2
f
dx
2
3 y
= f
(x)
d
3
f
dx
3
4 y
(4)
= f
(4)
(x)
d
4
f
dx
4
5 y
(5)
= f
(5)
(x)
d
5
f
dx
5
Computing higher order derivatives is done by simply computing several first derivatives,
as we see in example 3.6.
EXAMPLE 3.6 Computing Higher Order Derivatives
If f (x) = 3x
4
− 2x
2
+ 1, compute as many derivatives as possible.
Solution We have
f
(x) =
df
dx
=
d
dx
(3x
4
− 2x
2
+ 1) = 12x
3
− 4x.
Then,
f
(x) =
d
2
f
dx
2
=
d
dx
(12x
3
− 4x) = 36x
2
− 4,
f
(x) =
d
3
f
dx
3
=
d
dx
(36x
2
− 4) = 72x,
f
(4)
(x) =
d
4
f
dx
4
=
d
dx
(72x) = 72,
f
(5)
(x) =
d
5
f
dx
5
=
d
dx
(72) = 0
and so on. It follows that
f
(n)
(x) =
d
n
f
dx
n
= 0, for n ≥ 5.
Acceleration
What information does the second derivative of a function give us? Graphically, we get a
property called concavity, which we develop in Chapter 3. One important application of the
second derivative is acceleration, which we briefly discuss now.
You are probably familiar with the term acceleration, which is the instantaneous rate
of change of velocity. Consequently, if the velocity of an object at time t is given by v(t),
then the acceleration is
a(t) = v
(t) =
dv
dt
.
EXAMPLE 3.7 Computing the Acceleration of a Skydiver
Suppose that the height of a skydiver t seconds after jumping from an airplane is given
by f (t) = 640 − 20t −16t
2
feet. Find the person’s acceleration at time t.
Solution Since acceleration is the derivative of velocity, we first compute velocity:
v(t) = f
(t) = 0 −20 −32t =−20 −32t ft/s.