Smith R., Minton R. Calculus
Подождите немного. Документ загружается.

P1: OSO/OVY P2: OSO/OVY QC: OSO/OVY T1: OSO
MHDQ256-Ch13 MHDQ256-Smith-v1.cls December 31, 2010 16:55
LT (Late Transcendental)
CONFIRMING PAGES
13-5 SECTION 13.1
..
Functions of Several Variables 813
as its argument (in this case, x
2
+ y
2
) approaches 0. This appears to be what is indicated
in Figure 13.4a, with the surface dropping sharply toward the center of the sketch. So,
z = f
3
(x, y) corresponds to Figure 13.4a.
The remaining two functions involve exponentials. The most important distinction
between them is that f
2
(x, y) lies between −1 and 1, due to the cosine term. This
suggests that the graph of f
2
(x, y) is given in Figure 13.4b. To avoid jumping to a
decision prematurely (after all, the domains used to produce these figures are all slightly
different and could be misleading), make sure that the properties of f
4
(x, y) correspond
to Figure 13.4d. Note that e
−xy
→ 0asxy →∞and e
−xy
→∞as xy →−∞. As you
move away from the origin in regions where x and y have the same sign, the surface
should approach the xy-plane (z = 0). In regions where x and y have opposite signs, the
surface should rise sharply. Notice that this behavior is exactly what you are seeing in
Figure 13.4d.
REMARK 1.1
The analysis we use in example 1.6 may seem a bit slow, but we urge you to practice
this on your own. The more you think (carefully) about how the properties of
functions correspond to the structures of surfaces in three dimensions, the easier this
chapter will be.
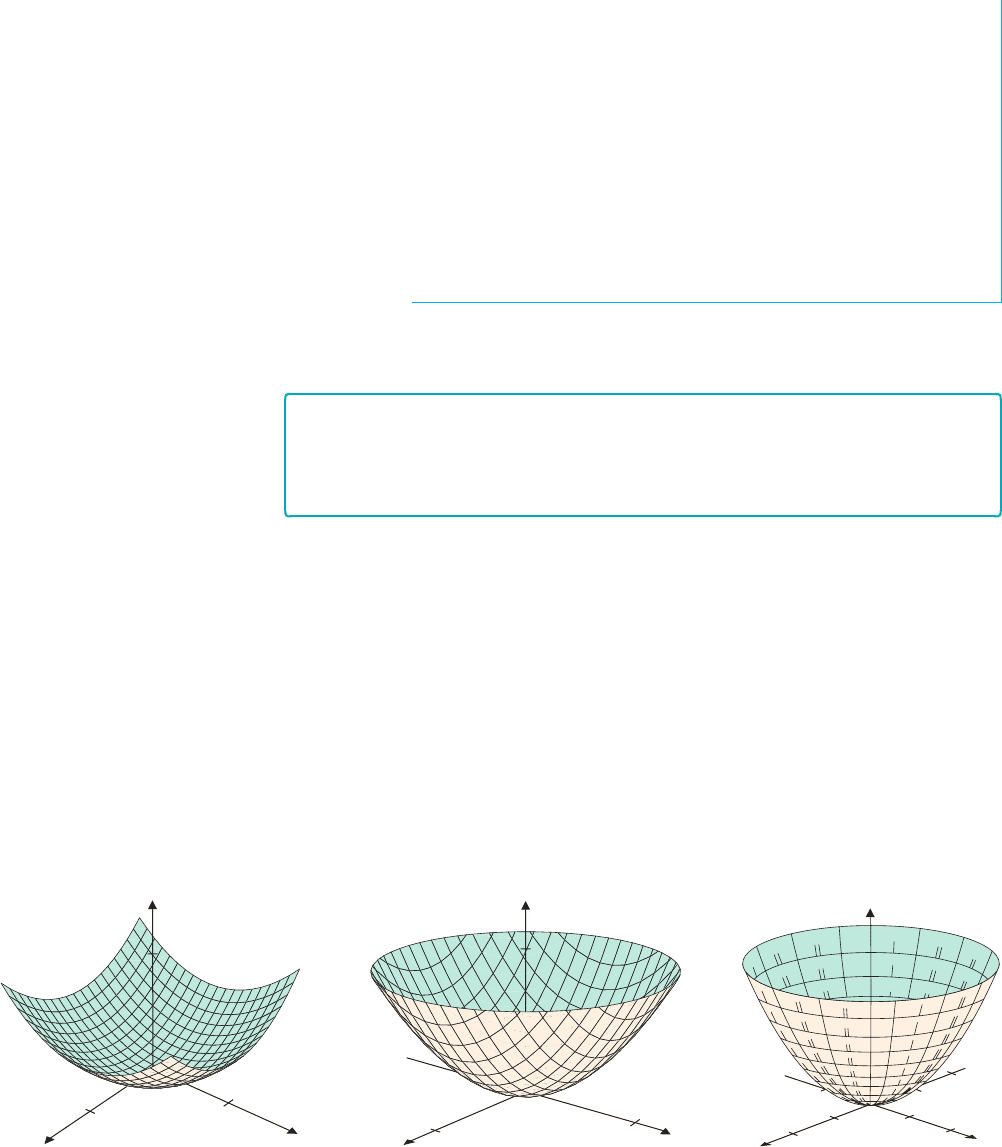
As with any use of technology, the creation of informative three-dimensional graphs
can require a significant amount of knowledge and trial-and-error exploration. Even when
you have an idea of what a graph should look like (and most often you won’t), you may
need to change the viewing window several times before you can clearly see a particular
feature. The wireframe graph in Figure 13.5a is a poor representation of f (x, y) = x
2
+ y
2
.
Noticethat this graphshowsnumeroustraces in the planes x = c and y = c for−5 ≤ c ≤ 5.
However, no traces are drawn in planes parallel to the xy-plane, so you get no sense that the
figure has circular cross sections. One wayto improve this is to limit the range of z-values to
0 ≤ z ≤ 20, as in Figure 13.5b. Observe that cutting off the graph here (i.e., not displaying
all values of z for the displayed values of x and y) reveals the circular cross section at
z = 20. An even better plot is obtained by using the parametric representation x = u cosv,
y = u sin v, z = u
2
, as shown in Figure 13.5c.
z
y
x
50
4
4
z
y
x
20
4
4
y
x
5
5
5
2.5
2.5
2.5
2.5
0
z
FIGURE 13.5a FIGURE 13.5b FIGURE 13.5c
z = x
2
+ y
2
z = x
2
+ y
2
z = x
2
+ y
2
An important feature of three-dimensional graphs is the viewpoint from which the
graphisdrawn.InFigures13.5aand13.5b,wearelookingattheparaboloidfromaviewpoint
thatisabovethexy-planeandbetweenthepositivex-andy-axes.Thisisthedefaultviewpoint
for many graphing utilities and is very similar to the way we have drawn graphs by hand.
Figure 13.3c shows the default viewpoint of f (x, y) = e
−x
2
(y
2
+ 1). In Figure 13.6a, we
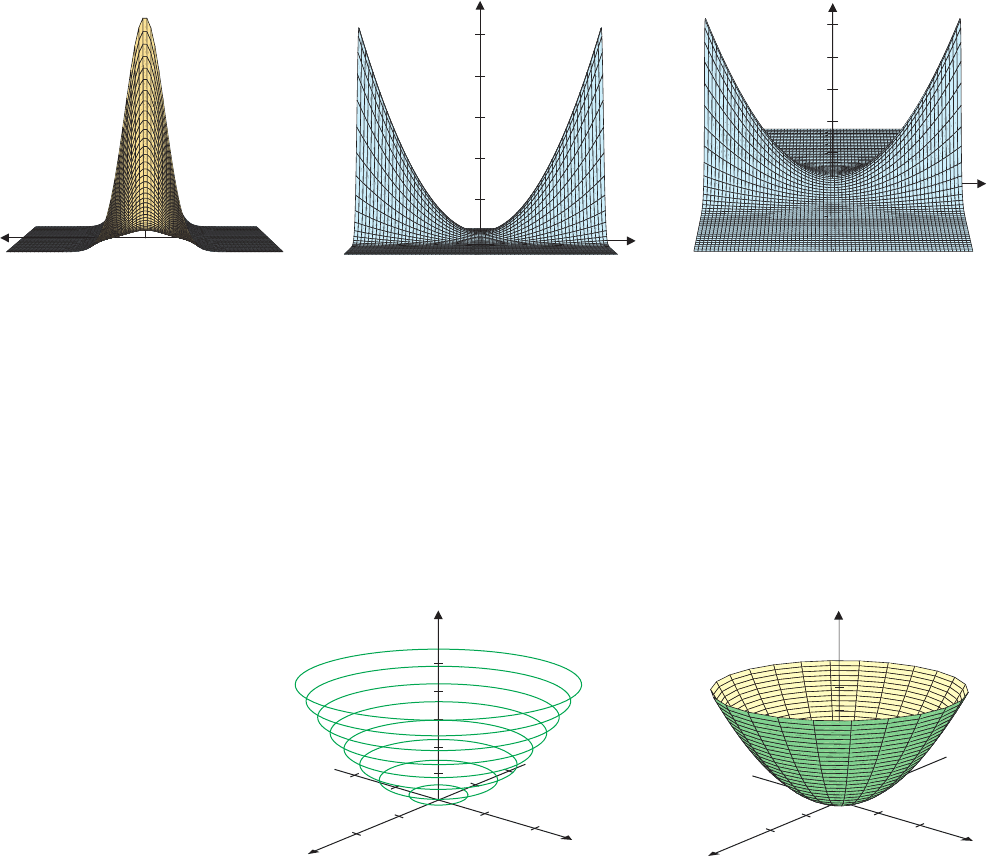
P1: OSO/OVY P2: OSO/OVY QC: OSO/OVY T1: OSO
MHDQ256-Ch13 MHDQ256-Smith-v1.cls December 31, 2010 16:55
LT (Late Transcendental)
CONFIRMING PAGES
814 CHAPTER 13
..
Functions of Several Variables and Partial Differentiation 13-6
switch the viewpoint to the positive y-axis, from which we can see the bell-shaped profile
of the graph. This viewpoint shows us several traces with y = c, so that we see a number of
curves of the form z = ke
−x
2
. In Figure 13.6b, the viewpoint is the positive x-axis, so that
we see parabolic traces of the form z = k(y
2
+ 1). Figure 13.6c shows the view from high
above the x-axis.
5
0
5
25
x
55
25
20
15
10
5
y
z
55
25
20
15
10
y
z
FIGURE 13.6a FIGURE 13.6b FIGURE 13.6c
z = e
−x
2
(y
2
+ 1) z = e
−x
2
(y
2
+ 1) z = e
−x
2
(y
2
+ 1)
Many graphing utilities offer alternatives to wireframe graphs. One deficiency of
wireframe graphs is the lack of traces parallel to the xy-plane. This is not a problem in
Figures 13.6a to 13.6c, where traces in the planes z = c are too complicated to be helpful.
However, in Figures 13.5a and 13.5b, the circular cross sections provide valuable informa-
tion about the structure of the graph. To see such traces, many graphing utilities provide
a “contour mode” or “parametric surface” option. These are shown in Figures 13.7a and
13.7b for f (x, y) = x
2
+ y
2
and are explored further in the exercises.
y
x
z
z = 3
z = 6
z = 9
z = 12
z = 15
z = 18
z = 21
z = 24
4
4
25
y
x
z
4
4
25
FIGURE 13.7a FIGURE 13.7b
z = x
2
+ y
2
(contour mode) z = x
2
+ y
2
(parametric plot)
Two other types of graphs, the contour plot and the density plot, provide the same
information condensed into a two-dimensional picture. Recall that for two of the surfaces
in example 1.6, it was important to recognize that the surface had circular cross sections,
since x and y appeared only in the combination x
2
+ y
2
. The contour plot and the density
plot will aid in identifying features such as this.
A level curve of the function f (x, y) is the (two-dimensional) curve defined by
f (x, y) = c,forsomeconstant c.(This correspondstothetraceof thesurfacez = f (x, y)in
theplane z = c.)Acontour plot of f (x, y) isagraph of numerouslevelcurves f (x, y) = c,
for representative values of c.
P1: OSO/OVY P2: OSO/OVY QC: OSO/OVY T1: OSO
MHDQ256-Ch13 MHDQ256-Smith-v1.cls December 31, 2010 16:55
LT (Late Transcendental)
CONFIRMING PAGES
13-7 SECTION 13.1
..
Functions of Several Variables 815
3
6
8
10
3
c = 4
c = 2
c = 0
c = 2
c = 4
y
x
FIGURE 13.8a
Contour plot of f (x, y) =−x
2
+ y
y
x
3
3
c = 1
c = 10
4
7
3
3
FIGURE 13.8b
Contour plot of g(x, y) = x
2
+ y
2
EXAMPLE 1.7 Sketching Contour Plots
Sketch contour plots for (a) f (x, y) =−x
2
+ y and (b) g(x, y) = x
2
+ y
2
.
Solution (a) First, note that the level curves of f (x, y) are defined by −x
2
+ y = c,
where c is a constant. Solving for y, you can identify the level curves as the parabolas
y = x
2
+ c. A contour plot with c =−4, −2, 0, 2 and 4 is shown in Figure 13.8a.
(b) The level curves for g(x, y) are the circles x
2
+ y
2
= c. In this case, note that
there are level curves only for c ≥ 0. A contour plot with c = 1, 4, 7 and 10 is shown in
Figure 13.8b.
Note that in example 1.7, we used values for c that were equally spaced. There is no
requirement that you do so, but it can help you to get a sense for how the level curves
would “stack up” to produce the three-dimensional graph. We show a more extensive
contour plot for g(x, y) = x
2
+ y
2
in Figure 13.9a. In Figure 13.9b, we show a plot of
the surface, with a number of traces drawn (in planes parallel to the xy-plane). Notice
that the projections of these traces onto the xy-plane correspond to the contour plot in
Figure 13.9a.
1
2
3
0
c = 1
c = 10
123
y
x
2
3
1
123
z
y
x
4
c = 1
c = 10
4
10
FIGURE 13.9a FIGURE 13.9b
Contour plot of g(x, y) = x
2
+ y
2
z = x
2
+ y
2
Look carefully at Figure 13.9a and observe that the contour plot indicates that the
increase in the radii of the circles is not constant as c increases.
As you might expect, for more complicated functions, the process of matching contour
plots with surfaces becomes more challenging.
4
4
44
x
y
c = ln 16
c = ln 25
c = ln 9
FIGURE 13.10a
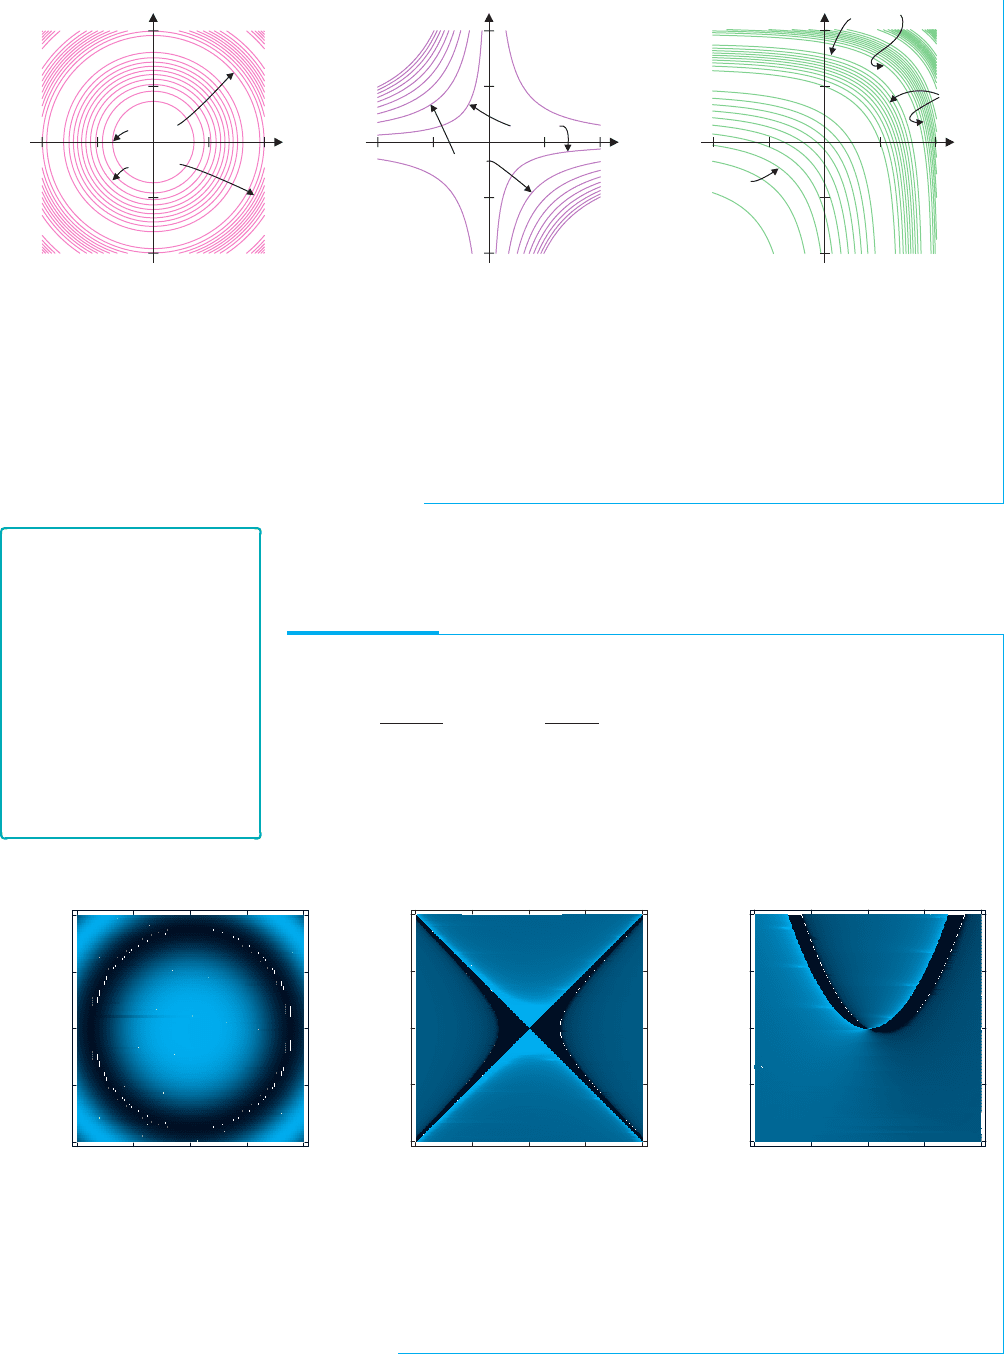
EXAMPLE 1.8 Matching Surfaces to Contour Plots
Match each of the surfaces of example 1.6 to the corresponding contour plot shown in
Figures 13.10a–13.10d.
Solution Note that only in Figures 13.4a and 13.4c are the level curves circular, so
these surfaces correspond to the contour plots in Figures 13.10a and 13.10b, but, which
is which? The principal feature of the surface in Figure 13.4a is the behavior near the
z-axis and the rapid change in the function near the z-axis results in a large number of
level curves near the origin. (Think about this.) By contrast, the oscillations in
Figure 13.4c would produce level curves that alternately get closer together and farther
apart. We can conclude that Figure 13.4a matches with Figure 13.10a, while
Figure 13.4c matches with Figure 13.10b. Next, intersecting the surface in Figure 13.4d
with the plane z = c > 0 results in two separate curves that open in opposite directions
(to the lower left and upper right of Figure 13.4d), corresponding to the hyperbolas seen
in Figure 13.10c. The final match of Figure 13.10d to Figure 13.4b is more difficult to
P1: OSO/OVY P2: OSO/OVY QC: OSO/OVY T1: OSO
MHDQ256-Ch13 MHDQ256-Smith-v1.cls December 31, 2010 16:55
LT (Late Transcendental)
CONFIRMING PAGES
816 CHAPTER 13
..
Functions of Several Variables and Partial Differentiation 13-8
2
1
c = 0.8
c = 0.5
1
2
2 112
x
y
2
1
c = 2
c = 0.5
c = 1.3
c = 0.5
1
2
2 112
x
y
2
c = 0.8
c = 0.5
c = 0.5
c = 0.8
1
1
2
2 112
x
y
FIGURE 13.10b FIGURE 13.10c FIGURE 13.10d
see, but notice how the curves of Figure 13.10d correspond to the curve of the peaks in
Figure 13.4b. (To see this, you will need to adjust for the y-axis pointing up in Figure
13.10d and to the right in Figure 13.4b.) As an additional means of distinguishing the
last two graphs, notice that Figure 13.4d is very flat near the origin. This corresponds to
the lack of level curves near the origin in Figure 13.10c. By contrast, Figure 13.4b
shows oscillation near the origin and there are several level curves near the origin in
Figure 13.10d.
REMARK 1.2
If the level curves in a contour
plot are plotted for equally
spaced values of z, observe that
a tightly packed region of the
contour plot will correspond to
a region of rapid change in the
function. Alternatively, blank
space in the contour plot
corresponds to a region of slow
change in the function. For this
reason, we typically draw
contour plots using equally
spaced values of z.
In a density plot, each pixel is shaded according to the size of the function value at a
point representing the pixel, with different colors and shades indicating different function
values. Level curves can then be seen as curves formed by a specific shade.
EXAMPLE 1.9 Matching Functions and Density Plots
Match the density plots in Figures 13.11a–13.11c with the functions
f
1
(x, y) =
1
y
2
− x
2
, f
2
(x, y) =
2x
y − x
2
and f
3
(x, y) = cos(x
2
+ y
2
).
Solution As we did with contour plots, we start with the most obvious properties of
the functions and try to identify the corresponding properties in the density plots. Both
f
1
and f
2
have gaps in their domains due to divisions by zero. Near the gaps, you should
expect large function values (large in absolute value). Notice that Figure 13.11b shows a
lighter color band in the shape of a hyperbola (like y
2
− x
2
= c for a small number c)
2
2
1
0
1
2
10 1 2
x
y
2
2
1
0
1
2
10 1 2
x
y
2
2
1
0
1
2
10 1 2
x
y
FIGURE 13.11a FIGURE 13.11b FIGURE 13.11c
and Figure 13.11c shows a lighter color band in the shape of a parabola (like
y − x
2
= 0). This tells you that the density plot for f
1
(x, y) is Figure 13.11b and the
density plot for f
2
(x, y) is Figure 13.11c. That leaves Figure 13.11a for f
3
(x, y). You
should be able to see the circular bands in the density plot arising from the x
2
+ y
2
term
in f
3
(x, y).
P1: OSO/OVY P2: OSO/OVY QC: OSO/OVY T1: OSO
MHDQ256-Ch13 MHDQ256-Smith-v1.cls December 31, 2010 16:55
LT (Late Transcendental)
CONFIRMING PAGES
13-9 SECTION 13.1
..
Functions of Several Variables 817
60E
40E
20W0 20E
992
1010
1004
1010
1010
1011
1010
1020
1020
1020
1020
1034
1030
1030
1000
30N
40N
50N
60N
70N
FIGURE 13.12a
Weather map showing
barometric pressure
FIGURE 13.12b
Weather maps showing bands of
temperature and precipitation
FIGURE 13.12c
Ocean heat content
FIGURE 13.12d
Ocean heat content
y
x
z
2
2
2
FIGURE 13.13a
x
2
+ y
2
+ z
2
= 1
y
x
z
2
2
2
FIGURE 13.13b
x
2
+ y
2
+ z
2
= 2
There are many examples of contour plots and density plots that you see every day.
Weather maps often show level curves of atmospheric pressure. (See Figure 13.12a.) In
this setting, the level curves are called isobars (that is, curves along which the barometric
pressure is constant). Other weather maps represent temperature or degree of wetness with
color coding (as in Figure 13.12b), which are essentially density plots.
Scientistsalso use density plots while studyingotherclimaticphenomena.Forinstance,
in Figures 13.12c and 13.12d, we show two density plots indicating sea-surface height
(which correlates with ocean heat content) indicating changes in the El Ni˜no phenomenon
over a period of several weeks.
We close this section by briefly looking at the graphs of functions of three variables,
f (x, y, z). We won’t actually graph any such functions, since a true graph would require
four dimensions (three independent variables plus one dependent variable). We can, how-
ever,gainimportantinformation from looking at graphs of thelevel surfaces of a function f.
These are the graphs of the equation f (x, y, z) = c, for different choices of the constant c.
Much as level curves do for functions of two variables, level surfaces can help you identify
symmetries and regions of rapid or slow change in a function of three variables.
EXAMPLE 1.10 Sketching Level Surfaces
Sketch several level surfaces of f (x, y, z) = x
2
+ y
2
+ z
2
.
Solution The level surfaces are described by the equation x
2
+ y
2
+ z
2
= c.Of
course, these are spheres of radius
√
c for c > 0. Surfaces with c = 1 and c = 2 are
shown in Figures 13.13a and 13.13b, respectively.

P1: OSO/OVY P2: OSO/OVY QC: OSO/OVY T1: OSO
MHDQ256-Ch13 MHDQ256-Smith-v1.cls December 31, 2010 16:55
LT (Late Transcendental)
CONFIRMING PAGES
818 CHAPTER 13
..
Functions of Several Variables and Partial Differentiation 13-10
BEYOND FORMULAS
Our main way of thinking about surfaces in three dimensions is to analyze two-
dimensional cross sections and build them up into a three-dimensional image. This
allows us to use our experience with equations and graphs in two dimensions to
determine properties of the graphs. Contour plots and density plots do essentially the
same thing, with the one restriction that the cross sections represented are in parallel
planes (for example, all parallel to the xy-plane). These two-dimensional plots do not
show the distortions that result from trying to represent a three-dimensional object on
two-dimensional paper. Thus, we can often draw better conclusions from a contour
plot than from a three-dimensional graph.
EXERCISES 13.1
WRITING EXERCISES
1. Explain why neither a full hyperboloid nor an ellipsoid would
be the graph of afunction of two variables. Develop a “vertical
line test” for determining whether a given surface is the graph
of a function of two variables.
2. In example 1.4, we used traces to help sketch the surface, but
in example 1.5 the traces were less helpful. Discuss the differ-
ences in the functions involved and how you can tell whether
or not traces will be helpful.
3. Given a contour plot, what can be said about the function? For
example, explain why a contour plot without labels (identify-
ing the value of z)could correspond to morethan one function.
If the contour plot shows a set of concentric circles around a
point, explain why you would expect that point to be the lo-
cation of a local extremum. Explain why, without labels, you
could not distinguish alocal maximum from a localminimum.
4. Imagine a contour plot that shows level curves for equally
spaced z-values (e.g., z = 0, z = 2 and z = 4). Near point A,
several level curves are very close together, but near point B,
there are no level curves showing at all. Discuss the behavior
of the function near points A and B, especially commenting on
whether the function is changing rapidly or slowly.
In exercises 1–6, describe and sketch the domain of the function.
1. f (x, y) =
1
x + y
2. f (x, y) =
3xy
y − x
2
3. f (x, y) = ln(x
2
+ y
2
− 1) 4. f (x, y) =
4 − x
2
− y
2
x
2
+ y
2
− 1
5. f (x, y, z) =
2xz
4 − x
2
− y
2
− z
2
6. f (x, y, z) =
e
yz
z − x
2
− y
2
............................................................
In exercises 7–10, describe the range of the function.
7. (a) f (x, y) =
2 + x − y (b) f (x, y) =
4 − x
2
− y
2
8. (a) f (x, y) = cos(x
2
+ y
2
) (b) f (x, y) = cos
π x
2
2x
2
+ y
2
9. (a) f (x, y) = x
2
+ y
2
− 1 (b) f (x, y) = tan
−1
(x
2
+ y
2
− 1)
10. (a) f (x, y) = e
x−y
(b) f (x, y) = e
2−x
2
−y
2
............................................................
In exercises 11 and 12, use the table in example 1.3.
11. Find (a) R(150, 1000), (b) R(150, 2000) and (c) R(150, 3000).
(d) Based on your answers, how much extra distance is gained
from an additional 1000 rpm of backspin?
12. Find (a) R(150, 2000), (b) R(160, 2000) and (c) R(170, 2000).
(d) Based on your answers, how much extra distance is gained
from an additional 10 ft/s of initial velocity?
............................................................
13. The heat index is a combination of temperature and humid-
ity that measures how effectively the human body is able to
dissipate heat; in other words, the heat index is a measure of
how hot it feels. The more humidity there is, the harder it is
for the body to evaporate moisture and cool off, so the hotter
you feel. The table shows the heat index for selected tempera-
tures and humidities in shade with a light breeze. For the func-
tion H(t, h), find H(80, 20), H(80, 40) and H(80, 60). At 80
◦
,
approximately how many degrees does an extra 20% humidity
add to the heat index?
20% 40% 60% 80%
70
◦
65.1 66.9 68.8 70.7
80
◦
77.4 80.4 82.8 85.9
90
◦
86.5 92.3 100.5 112.0
100
◦
98.8 111.2 129.5 154.0
14. Use the preceding heat index table to find H(90, 20), H(90, 40)
and H(90, 60). At 90
◦
, approximately how many degrees does
an extra 20% humidity add to the heat index? This answer is
larger than the answer to exercise 13. Discuss what this means
in terms of the danger of high humidity.
............................................................
In exercises 15–20, sketch the indicated traces and graph
z f (x, y).
15. f (x, y) = x
2
+ y
2
; x = 0, z = 1, z = 2, z = 3
16. f (x, y) = x
2
− y
2
; x = 0, y = 0, z = 1, z =−1
P1: OSO/OVY P2: OSO/OVY QC: OSO/OVY T1: OSO
MHDQ256-Ch13 MHDQ256-Smith-v1.cls December 31, 2010 16:55
LT (Late Transcendental)
CONFIRMING PAGES
13-11 SECTION 13.1
..
Functions of Several Variables 819
17. f (x, y) =
x
2
+ y
2
; x = 0, z = 1, z = 2, z = 3
18. f (x, y) = 2x
2
− y; x = 0, z = 0, z = 1, z = 2
19. f (x, y) =
4 − x
2
− y
2
; x = 0, y = 0, z = 0, z = 1
20. f (x, y) =
4 + x
2
− y
2
; x = 0, x = 1, x =−1, z = 0
............................................................
In exercises 21–26, use a graphing utility to sketch graphs of
z f (x, y) from two different viewpoints, showing different
features of the graphs.
21. (a) f (x, y) =
xy
2
x
2
+ y
4
(b) f (x, y) =
xy
2
x
2
+ y
2
22. (a) f (x, y) = 4xy − x
4
− y
4
(b) f (x, y) = x
3
− 3xy + y
3
23. (a) f (x, y) = xe
−x
2
−y
3
+y
(b) f (x, y) = xye
−x
2
−y
2
24. (a) f (x, y) = cos
x
2
+ y
2
(b) f (x, y) = sin
2
x + cos
2
y
25. (a) f (x, y) = ln(x
2
+ y
2
− 1) (b) f (x, y) = 2x sin xyln y
26. (a) f (x, y) = 5xe
y
− x
5
− e
5y
(b) f (x, y) = 2x
4
+ e
4y
− 4x
2
e
y
............................................................
27. In parts a–d, match the functions to the surfaces.
(a) f (x, y) = x
2
+ 3x
7
(b) f (x, y) = x
2
+ 3y
7
(c) f (x, y) = x
2
− y
3
(d) f (x, y) = y
2
− x
3
y
x
z
y
x
z
SURFACE 1 SURFACE 2
z
x
y
2
10
2
x
y
z
2
100
50
50
100
2
1
5
SURFACE 3 SURFACE 4
28. In parts a–d, match the functions to the surfaces.
(a) f (x, y) = cos
2
x + y
2
(b) f (x, y) = cos (x
2
+ y
2
)
(c) f (x, y) = sin (x
2
+ y
2
)
(d) f (x, y) = e
−x
2
−y
2
y
x
z
y
x
z
SURFACE 1 SURFACE 2
y
x
z
y
x
z
SURFACE 3 SURFACE 4
............................................................
In exercises 29–34, sketch a contour plot.
29. f (x, y) = x
2
+ 4y
2
30. f (x, y) = cos
x
2
+ y
2
31. f (x, y) = y − 4x
2
32. f (x, y) = y
3
− 2x
33. f (x, y) = e
y−x
3
34. f (x, y) = ye
x
............................................................
In exercises 35–38, use a CAS to sketch a contour plot.
35. f (x, y) = xye
−x
2
−y
2
36. f (x, y) = x
3
− 3xy + y
2
37. f (x, y) = sin x sin y 38. f (x, y) = sin(y − x
2
)
............................................................
39. If your graphing utility can draw three-dimensional para-
metric graphs, compare the wireframe graph of z = x
2
+ y
2
with the parametric graph of x(r, t) = r cos t, y(r, t) = r sint
and z(r, t) = r
2
. (Change parameter letters from r and t to
whichever letters your utility uses.)
40. If your graphing utility can draw three-dimensional parametric
graphs, compare the wireframe graph of z = ln(x
2
+ y
2
) with
the parametric graph of x(r, t) = r cos t, y(r, t) = r sin t and
z(r, t) = ln(r
2
).
41. If your graphing utility can draw three-dimensional paramet-
ric graphs, find parametric equations for z = cos(x
2
+ y
2
) and
compare the wireframe and parametric graphs.
42. If your graphing utility can draw three-dimensional parametric
graphs, compare the wireframe graphs of z =±
1 − x
2
− y
2
with the parametric graph of x(u,v) = cos u sin v,
y(u,v) = sinu sin v and z(u,v) = cosv.
P1: OSO/OVY P2: OSO/OVY QC: OSO/OVY T1: OSO
MHDQ256-Ch13 MHDQ256-Smith-v1.cls December 31, 2010 16:55
LT (Late Transcendental)
CONFIRMING PAGES
820 CHAPTER 13
..
Functions of Several Variables and Partial Differentiation 13-12
43. In parts a–d, match the surfaces to the contour plots.
y
z
x
y
z
x
(a) (b)
y
z
x
y
z
x
(c) (d)
2
2
1
0
1
2
10 1 2
x
y
2
2
1
0
1
2
10 1 2
x
y
CONTOUR 1 CONTOUR 2
2
2
1
1
2
10 1 2
x
0
y
2
2
1
0
1
2
10 1 2
x
y
CONTOUR 3 CONTOUR 4
44. In parts a–d, match the density plots to the contour plots of
exercise 43.
2
2
1
1
2
10 1 2
x
0
y
2
2
1
1
2
10 1 2
x
0
y
(a) (b)
2
2
1
1
2
10 1 2
x
0
y
2
2
1
1
2
10 1 2
x
0
y
(c) (d)
............................................................
In exercises 45–48, sketch several level surfaces of the given
function.
45. f (x, y, z) = x
2
− y
2
+ z
2
46. f (x, y, z) = x
2
+ y
2
− z
47. f (x, y, z) = z −
x
2
+ y
2
48. f (x, y, z) = x
2
− y
2
− z
2
............................................................
49. The graph of f (x, y) = x
2
− y
2
is shown from two different
viewpoints. Identify which is viewed from (a) the positive x-
axis and (b) the positive y-axis.
VIEW A VIEW B
50. Thegraph of f (x, y) = x
2
y
2
− y
4
+ x
3
isshownfrom twodif-
ferentviewpoints.Identifywhichisviewedfrom(a)thepositive
x-axis and (b) the positive y-axis.
VIEW A VIEW B
51. Suppose that a contour plot of f (x, y) includes several level
curves that appear to intersect at a point P. Explain why dif-
ferent contours cannot intersect.
52. In exercise 51, possibilities include (1) the level curves just get
very close together and (2) the point P is a “hole” in each level
curve. Sketch possible contour plots that illustrate (1) and (2)
and discuss the behavior of the function near P in each case.
P1: OSO/OVY P2: OSO/OVY QC: OSO/OVY T1: OSO
MHDQ256-Ch13 MHDQ256-Smith-v1.cls December 31, 2010 16:55
LT (Late Transcendental)
CONFIRMING PAGES
13-13 SECTION 13.1
..
Functions of Several Variables 821
APPLICATIONS
53. The topographical map shows level curves for the height of
a hill. For each point indicated, identify the height and sketch
a short arrow indicating the direction from that point that cor-
responds to “straight up” the hill; that is, show the direction of
the largest rate of increase in height.
A
C
B
460
470
470
490
500
480
480
490
54. Forthetopographicalmapfromexercise53,therearetwopeaks
shown. Identify the locations of the peaks and use the labels to
approximate the height of each peak.
55. Suppose that the accompanying contour plot represents the
temperature in a room. If it is winter, identify likely positions
for a heating vent and a window. Speculate on what the circular
level curves might represent.
56. Suppose that theaccompanying contour plot represents the co-
efficient of restitution (the “bounciness”) at various locations
on a tennis racket. Locate the point of maximum power for the
racket, and explainwhy you know it’s maximum powerand not
minimum power. Racket manufacturers sometimes call one of
the level curves the “sweet spot” of the racket. Explain why
this is reasonable.
57. A well-knowncollege uses the followingformulato predict the
grade average of prospective students:
PGA = 0.708(HS) +0.0018(SATV) +0.001(SATM) − 1.13
Here, PGA is the predicted grade average, HS is the student’s
highschool gradeaverage(incore academic courses, on a four-
pointscale),SATV is thestudent’sSATverbalscoreandSATM
is the student’s SAT math score. Use your scores to compute
yourownpredictedgradeaverage.Determine whether it ispos-
sible to have a predicted average of 4.0, or a negative predicted
grade average. In this formula, the predicted grade average is
a function of three variables. State which variable you think is
the most important and explain why you think so.
58. In The Hidden Game of Football, Carroll, Palmer and Thorn
give the following formula for the probability p that the team
with the ball will win the game:
ln
p
1 − p
= 0.6s + 0.084
s
√
t/60
− 0.0073(y − 74).
Here, s is the current score differential (+ if you’re winning,
– if you’re losing), t is the number of minutes remaining and
y is the number of yards to the goal line. For the function
p(s, t, y),compute p(2, 10, 40), p(3, 10, 40), p(3, 10, 80)and
p(3, 20, 40), and interpret the differences in football terms.
59. Suppose that you drive x mph for d miles and then y mph
for d miles. Show that your average speed S is given by
S(x, y) =
2xy
x + y
mph. On a 40-mile trip, if you average
30 mph for the first 20 miles, how fast must you go to av-
erage 40 mph for the entire trip? How fast must you go to
average 60 mph for the entire trip?
60. The price-to-earnings ratio of a stock is defined by R =
P
E
,
where P is the price per share of the stock and E is the earn-
ings. The yield of the stock is defined by Y =
d
P
, where d isthe
dividends per share. Find the yield as a function of R, d and E.
EXPLORATORY EXERCISES
1. Graphically explore the results of the transforma-
tions g
1
(x, y) = f (x, y) +c, g
2
(x, y) = f (x, y +c) and
g
3
(x, y) = f (x + c, y). [Hint: Take a specific function like
f (x, y) = x
2
+ y
2
and look at the graphs of the transformed
functions x
2
+ y
2
+ 2, x
2
+ (y + 2)
2
and (x +2)
2
+ y
2
.] De-
termine what changes occur when the constant is added.
Test your hypothesis for other constants (be sure to try
negative constants, too). Then, explore the transformations
g
4
(x, y) = cf(x, y) and g
5
(x, y) = f (c
1
x, c
2
y).
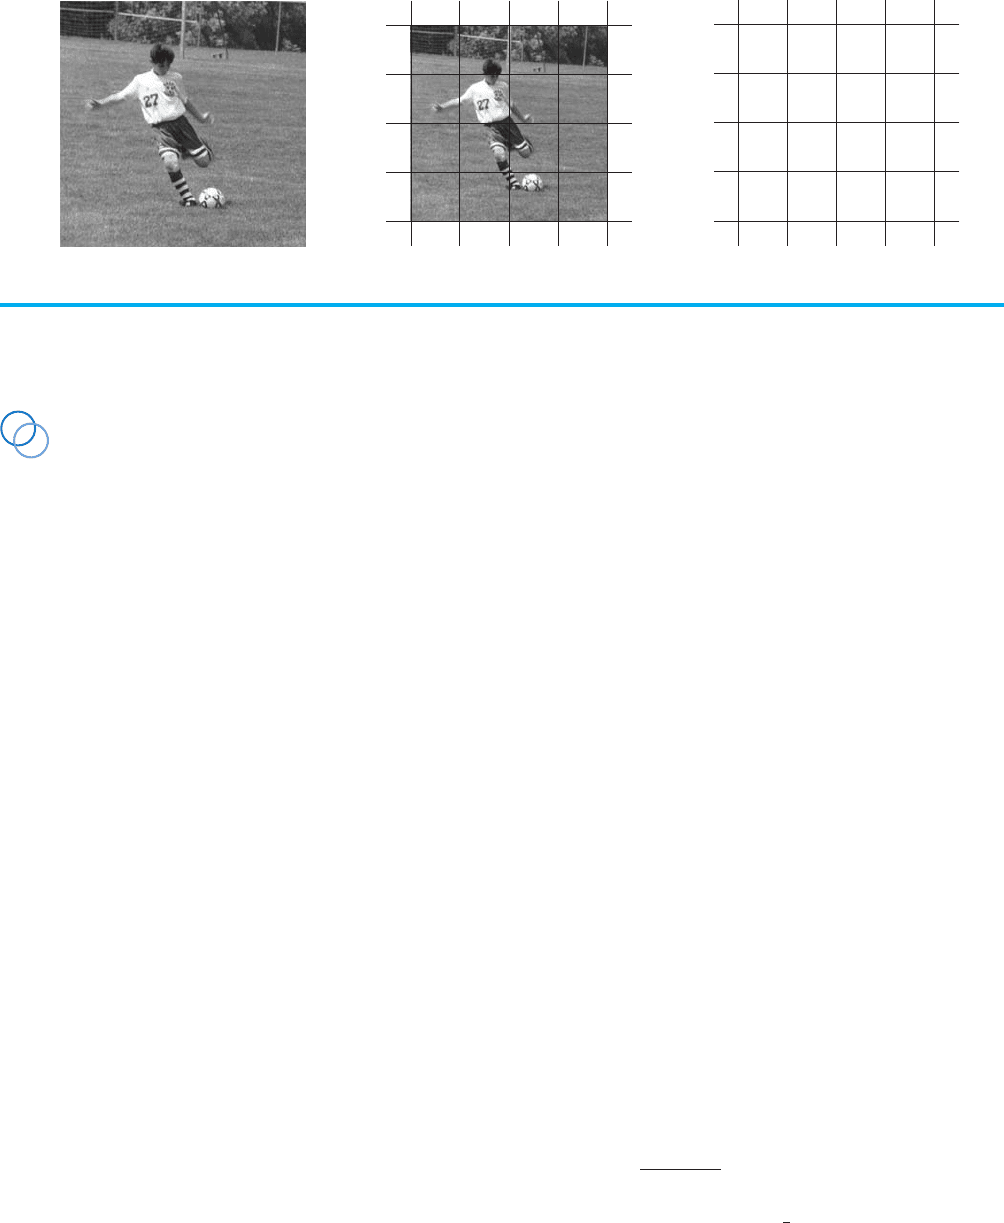
2. To digitize a black-and-white photograph, superimpose a rec-
tangular grid and assign to each subrectangle a number repre-
senting the brightness of that portion of the photograph. The
grid defines the x- andy-values and thebrightness numbers are
the function values. Briefly describe how this function differs
from other functions in this section. Near the soccer jersey in
the photograph shown on next page, describe how the bright-
ness function behaves. To “sharpen” the picture by increasing
the contrast, should you transform the function values to make
them closer together or farther apart?
P1: OSO/OVY P2: OSO/OVY QC: OSO/OVY T1: OSO
MHDQ256-Ch13 MHDQ256-Smith-v1.cls December 31, 2010 16:55
LT (Late Transcendental)
CONFIRMING PAGES
822 CHAPTER 13
..
Functions of Several Variables and Partial Differentiation 13-14
7889
5256
6776
6646
B & W PHOTO PHOTO WITH GRID DIGITIZED PHOTO
13.2 LIMITS AND CONTINUITY
At the beginning of our study of the calculus and again when we introduced vector-valued
functions, we have followed the same progression of topics, beginning with graphs of
functions, then limits, continuity, derivatives and integrals. We continue this progression
now by extending the concept of limit to functions of two (and then three) variables. As
you will see, the increase in dimension causes some interesting complications.
First, recall that for a function of a single variable, if we write lim
x→a
f (x) = L, we mean
that as x gets closer and closer to a, f (x) gets closer and closer to the number L. Here, for
functions of several variables, the idea is very similar. When we write
lim
(x,y)→(a,b)
f (x, y) = L,
we mean that as (x, y) gets closer and closer to (a, b), f (x, y) is getting closer and closer
to the number L. In this case, (x, y) may approach (a, b) along any of the infinitely many
different paths passing through (a, b).
Forinstance, lim
(x,y)→(2,3)
(xy − 2)asks us to identify what happens to the function xy − 2
as x approaches 2 and y approaches 3. Clearly, xy − 2 approaches 2(3) −2 = 4 and we
write
lim
(x,y)→(2,3)
(xy − 2) = 4.
Similarly, you can reason that
lim
(x,y)→(−1,π )
(sin xy − x
2
y) = sin(−π) − π =−π.
In other words, for many (nice) functions, we can compute limits simply by substituting
into the function.
However,aswithfunctionsofasinglevariable,thelimitsinwhichwe’remostinterested
cannot be computed by simply substituting values for x and y. For instance, for
lim
(x,y)→(1,0)
y
x + y − 1
,
substituting in x = 1 and y = 0 gives the indeterminate form
0
0
. To evaluate this limit, we
must investigate further.
Youmayrecallfromourdiscussioninsection1.6thatforafunction f ofasinglevariable
definedonanopenintervalcontaining a (butnot necessarily at a),wesaythat lim
x→a
f (x) = L
if given any number ε>0, there is another number δ>0 such that | f (x) − L| <εwhen-
ever 0 < |x −a| <δ. In other words, no matter how close you wish to make f (x)toL (we