Takadoum J. Materials and Surface Engineering in Tribology
Подождите немного. Документ загружается.

Surfaces 5
1.2.2.2. Micrometer-scale topographic state [MIC 89, THOMASTR 99,
THOMAST 05]
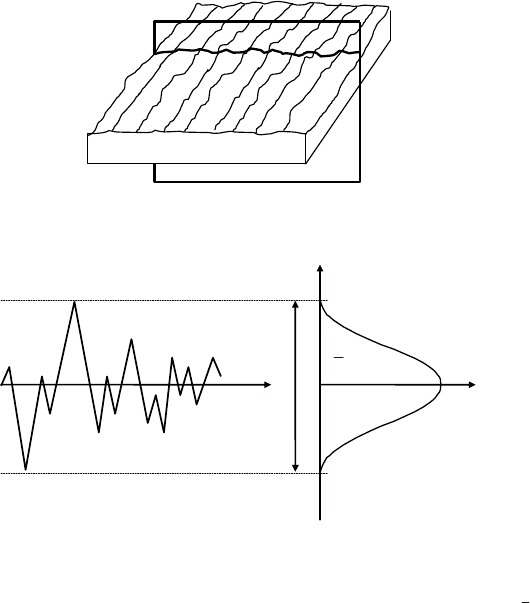
Surface machining processes such as turning, milling, polishing or sintering
inevitably induce some degree of superficial roughness (see Figure 1.5a) which can be
described by a function z(x,y) defining the topographic defects at a point (x,y) as
shown in Figures 1.5b and 1.5c.
a)
z
x
i
p(z)
z
Rt
b) c)
Figure 1.5. a) 3D analysis of a surface and cross-section of a profile of that surface; b)
roughness profile of cross-section (a); c) p(z) is the function of height distribution, (
z
) the
mean height and (Rt) the total roughness height
In order to describe the height distribution, we consider the function z(x,y) as a
random value, introducing the probability density function p(z) as follows:
^
`
() prob (, )pzdz z zxy z dz dd
[1.1]

6 Materials and Surface Engineering in Tribology
where
( ) 1 for ( ) 0pzdz pz
f
f
t
³
[1.2]
such that p(z)dz represents the probability that the height at a coordinate point (x,y)
is between z and z+dz.
The asymmetry parameter (Sk: Skewness) and peakedness parameter (Ek:
Kurtosis) of the height distribution relative to a Gaussian
1
distribution are given in
terms of centered moments (m) of order 2, 3 and 4 by the following expressions:
(3)
3
(2)
2
m
Sk
m
and
(4)
2
(2)
m
Ek
m
[1.3]
The nth-order centered moment of p(z) is defined by:
max
min
()
()
z
n
n
z
mzzpzdz
³
[1.4]
with Sk = 0 and Ek = 3 for a Gaussian distribution.
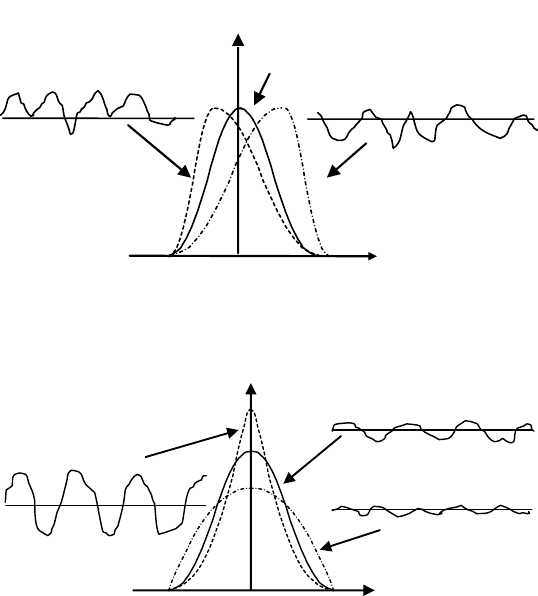
Skewness characterizes the asymmetry of p(z) relative to a Gaussian distribution.
A surface profile where the total area of holes is less than the total area of bumps will
give a positive Sk (and a peak-type profile) whereas in the opposite case (with a
valley-type profile) Sk will be negative (see Figure 1.6).
Kurtosis characterizes the peakedness of p(z) relative to a Gaussian
distribution. For Ek less than 3, the total number of points in the neighborhood of
the mean line is greater than that of a normal distribution (flattened profile).
Conversely, when Ek is greater than 3, the majority of points are far from the
mean curve, which results in a highly peaked profile (see Figure 1.7).
1 A random variable x will follow a Gaussian (or normal) distribution if its probability density is
expressed in terms of mean m and variance ı
2
as follows:
2
2
2
)(
2
1
)(
V
SV
mx
exf
Surfaces 7
z (x)
p (z)
S
k
>0 Sk < 0
Sk = 0
Figure 1.6. Asymmetry coefficient (Sk) of a roughness profile relative to a Gaussian
p (z)
z
Ek > 3
Ek = 3
Ek < 3
Figure 1.7. Peakedness coefficient (Ek) of a roughness profile relative to a Gaussian
We can also define a cumulative probability density function by:
0
min
() ()
z
z
P
zpzdz
³
[1.5]
where P(z) is the probability for the variable z to be less than or equal to z
0
. The
quantity 1 – P(z
0
) represents the fraction of the load-bearing surface of a profile cut
at a height of z
0.
This corresponds to the bearing ratio at z
0
, i.e. the probability that z
is greater than or equal to z
0
.
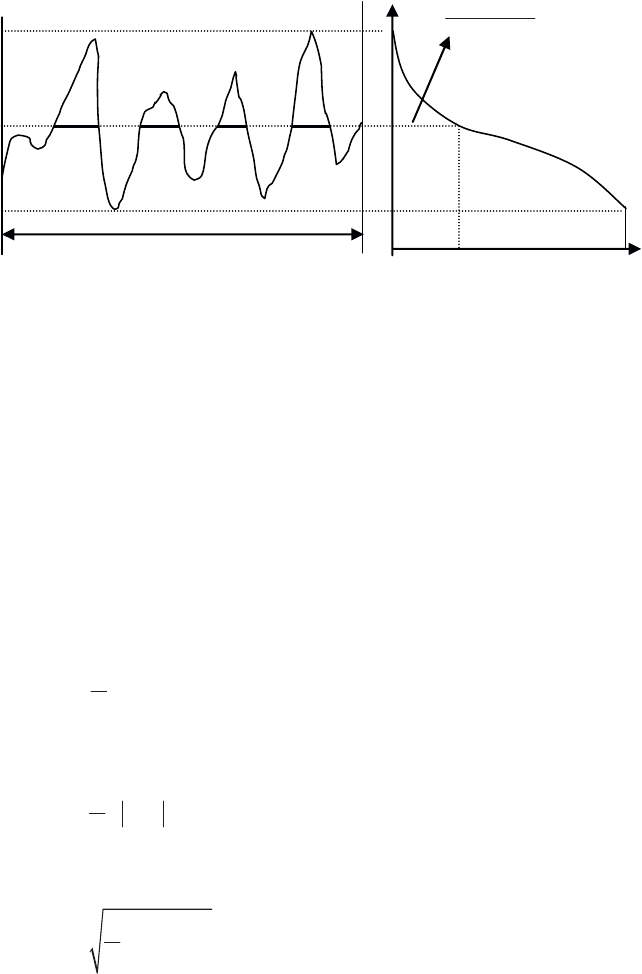
A plot of 1 – P(z) (expressed as a percentage) shows the evolution of the surface
(or profile) bearing ratio as a function of z, and is known as the bearing area curve or
the Abbott or Firestone curve (see Figure 1.8).
8 Materials and Surface Engineering in Tribology
Figure 1.8. Surface bearing area curve (or Abbott curve)
1.2.2.2.1. Normalized height distribution parameters
These parameters are given relative to a mean profile line that is defined as the
least-squares line:
– Rt: total roughness depth. This corresponds to the difference between the
maximum and minimum height in the interval considered.
Rt
max min
zz
[1.6]
– Rp: mean roughness depth. This corresponds to the mean of the distribution
z(x) for a given profile of length L:
Rp
0
1
()
L
zxdx
L
³
[1.7]
– Ra: mean arithmetic deviation. This is defined by:
Ra
0
1
()
L
zx dx
L
³
[1.8]
– Rq (or RMS): the root mean square deviation. This is defined by:
Rq
2
0
1
L
zx dx
L
³
[1.9]
z
100 %
L
aaaa
4321
a
1
a
2
a
3
a
4
z
0
L : longueur du profil
0 %
Taux de portance
L: Sampling length
Bearing area curve

Surfaces 9
1.2.2.2.2. Frequency parameters
In order to analyze periodic surface defects and to quantify the degree of
correlation between two given points, we use spectral analysis. In this respect, the
basic tool is the Fourier transform of the function z(x):
2
()
isx
Ts zxe dx
S
f
f
³
[1.10]
The energy spectral density G(s), defined as the square modulus of the Fourier
transform of z(x), can be used to analyze the periodicity of the microgeometric
surface state:
2
() ()Gs Ts
[1.11]
The autocorrelation function C(μ) is also used to analyze the anisotropy of the
state of the surface, and to establish the degree of correlation between two
coordinates separated by a distance μ:
0
1
() lim ()( )
L
L
Czxzxdx
L
PP
of
³
[1.12]
where C(μ) gives the probability of finding two points, at the same height, separated
by a distance μ. C(μ) equals 1 when μ = 0 and decreases pseudo-exponentially,
tending asymptotically to zero for large μ. If the surface contains a periodic defect of
period Ȝ (induced, for example, by a machining process), the curve C(μ) will show a
peak each time μ is a multiple of Ȝ.
1.2.2.3. Experimental techniques
1.2.2.3.1. Stylus profilometers
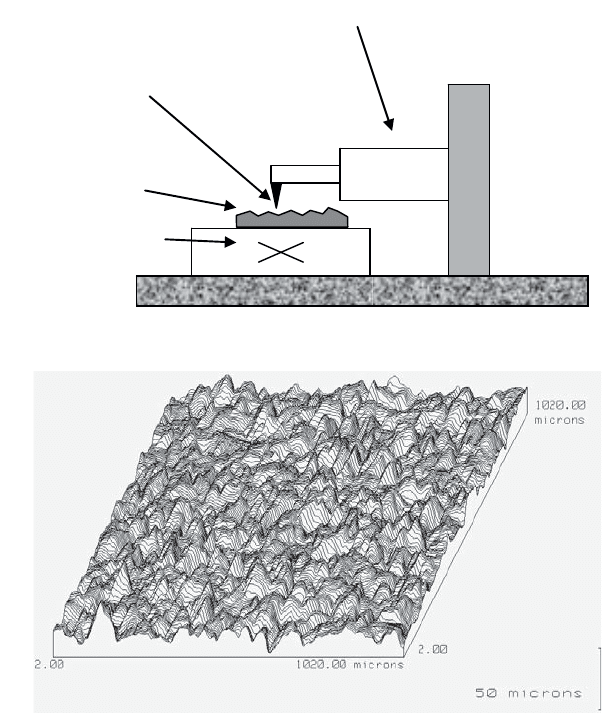
Stylus profilometers (or 3D profilometers) are devices equipped with a
mechanical stylus consisting of a diamond tip whose radius of curvature is generally
between 1 and 2 μm. The surface to be analyzed is moved under the stylus by two
stepping motors that allow orthogonal movements with micron-level steps. The
vertical movements of the stylus follow the topographic defects of the surface and
are analyzed using a sensor that generates an electrical signal which is in turn
digitized and processed by computer (see Figure 1.9). Figure 1.10 shows an example
of 3D topographic measurement of a surface.
10 Materials and Surface Engineering in Tribology
Figure 1.9. 3D stylus profilometer
Figure 1.10. Sandblasted aluminum surface
roughness parameters of the surface:
Ra = 3.1 μm, Rt = 40 μm, Sk = 0.03, Ek = 4.36
1.2.2.3.2. Optical systems [CHENF 00, GAS 95]
Measuring the state of a surface through optical (non-contact) methods uses a
laser beam or white light beam to scan the sample surface. In certain cases, it is
possible to use “full field” methods employing cameras to avoid the need for
scanning.
Moteurs pas à pas
(déplacement x y)
Surface à analyser
Capteur
Statif
Pointe diamant
Diamond stylus
Sensor
Sample
Stepping motors
(displacement x-y)
Surfaces 11
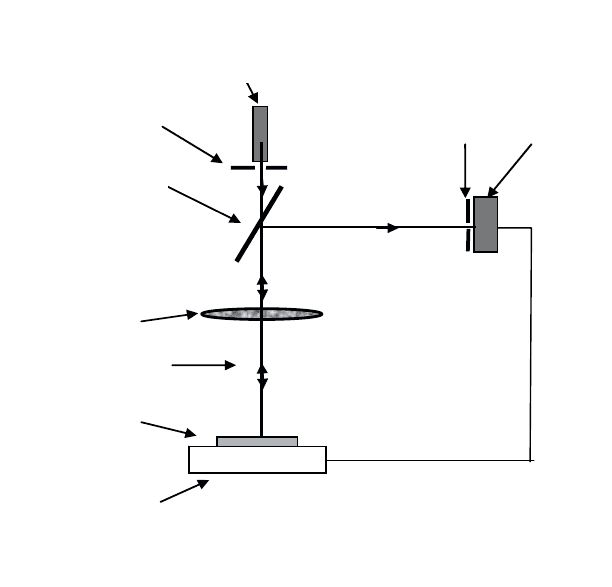
The confocal microscope
The principle of the laser scanning confocal microscope is shown in Figure 1.11.
Small diaphragms (of a few microns in diameter) are placed in front of the laser
source and just before the detector, allowing the size of the light source to be
reduced to a point. The two diaphragms are placed in conjugate focal planes such
that a single lens can focus both incident and reflected beams.
Diaphragme
m
e
a
ser
n
Sample holder
(vertical displacement ¨z)
Laser source
(displacement x-y)
Diaphragm
Mirror
Lens
Laser beam
Sample
Diaphragm Detector
Figure 1.11. Principle of the confocal microscope
The laser scans the sample surface point-by-point along a line with a step x,
repeated along parallel lines separated by a step y. The beam is reflected from the
surface and then focused on the detector. This allows data collection of the 2D
topography of the surface xy at a given height z as determined by the focal plane of
the laser beam. The height of the sample is then moved by a step ǻz and a new
phase of data collection is carried out. The 3D representation of the surface is
12 Materials and Surface Engineering in Tribology
obtained through the combination of the data extracted from the different images
obtained at different heights z, with vertical and lateral resolutions of the order of
200 nm.
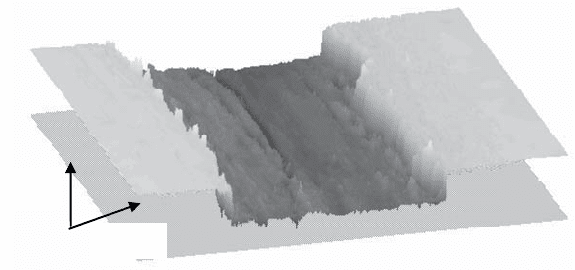
The interferometric microscope
The interferometric microscope consists of an optical microscope coupled to a
two-beam optical interferometer of the Michelson, Mirau or Linnik type. In practice,
an optical microscope can be converted to an interferometric microscope by
replacing the standard objective with an interferometric objective, and by the
addition of a high-resolution vertical translation stage.
The device operates as follows: a CDD camera records and digitizes a series of
interferograms formed by the combination of a reference beam (reflected from the
internal mirror of the interferometric objective) and the beam reflected from the
surface of the sample. The interferograms recorded at different heights are processed
by specialized software able to reconstruct the surface topography (see Figure 1.12).
50 μm
5 μm
Figure 1.12. Impression of a spherical aluminum oxide indenter on a copper surface
(topographic mapping achieved with an interferometric microscope)
Inferometric microscopes are easy to set up and have rapid data acquisition
times. It takes only a few seconds to map a surface with nanometer-scale resolution.
1.2.2.3.3. Local probe microscopes
Local probe microscopes (or near-field microscopes) are very high resolution
instruments for surface characterization that exhibit dramatically improved
performance compared with stylus or optically based profilometry. Local probe
microscopes exploit very short-range interactions between a fine probe and the
Surfaces 13
sample surface to yield ultra-high resolution, ranging from a micron to a fraction of
a nanometer. They systematically use a scanning technique, with the image obtained
resulting from the complete scanning of the surface, which can lead to relatively
long acquisition times. The resolution of these images essentially depends on two
factors: the size of the probe and the way in which the probe–surface interaction
varies as a function of the distance to the surface.
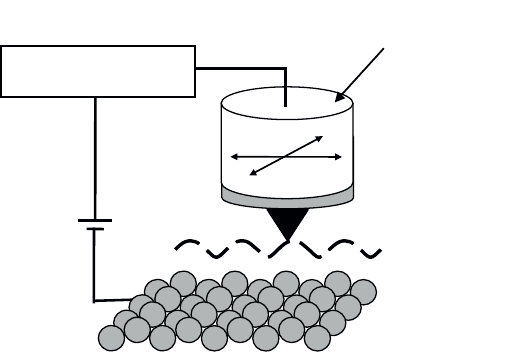
Scanning tunneling microscope (STM)
STMs (see Figure 1.13) enable the study of topography and the local properties
of metallic and semi-conductor surfaces with angström-level resolution [STI 04].
The principle of operation of the STM is based on measuring the electric current that
arises due to the tunneling effect between a fine probe and the sample surface when
these are separated by a few angströms (0.3–1 nm), and subject to a potential
difference of a few tens of millivolts (10 mV to 1 V). The probes used are generally
made of tungsten or of platinum-iridium and have radii of curvature of a few
nanometers.
Figure 1.13. Principle of the scanning tunneling microscope
As the probe scans the surface, an electronic control system measures the
tunneling current and moves the probe tip away from or towards the surface to
ensure a constant current intensity (see Figure 1.13). By recording the variations of
the distance between the probe and the surface as a function of the coordinates of the
Tube
piézoélectrique
x
y
Electronique de régulation
(
boucle d’asservissement
)
Piezoelectric
tube
Detector and feedback
electronics
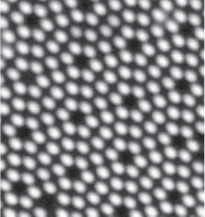
14 Materials and Surface Engineering in Tribology
scanned points, an atomic-scale 3D representation of the topographic surface is
obtained (see Figure 1.14).
Figure 1.14. Silicon surface Si (111): the silicon atoms appear clearly on the picture
(STM image courtesy of Frank Palmino (FEMTO-ST, LPMO Dpt))
Atomic force microscope (AFM)
One of the main limitations of the STM is that it cannot be used to analyze non-
conducting materials. To overcome this, other techniques such as the atomic force
microscope (AFM) have been developed [BIN 86, BIN 87, FRE 04].
This microscope is sensitive to forces resulting from the interactions (see section
2.5.1) between the surface and a fine probe fixed to the tip of a coil spring plate or
cantilever with a low spring constant (0.1–10 N m
–1
). When subjected to these forces
(with intensity ranges of 10
–13
–10
–6
N) the cantilever is subject to a deflection of a
few tens of nanometers which is recorded by measuring the variation of the laser
beam position reflected by the extremity of the cantilever (see Figure 1.15). The 3D
image of the surface can therefore be reconstructed after computer analysis of the
recorded deflections as a function of the coordinates of the points examined (see
Figure 1.16). The probes used are usually made of silicon nitride (Si
3
N
4
) and have
radii of curvature ranging from a few nanometers to a few tens of nanometers.
Atomic-scale resolution can also be achieved with this type of microscope, using an
ultrafine probe with a single atom at its tip.