Takadoum J. Materials and Surface Engineering in Tribology
Подождите немного. Документ загружается.

Surfaces 15
Faisceau laser
Photodétecteur à quatre cadrans
Signal AFM : (A + B) - (C + D)
Signal LFM : (A + C) - (B + D)
Miroir
Photodiodes
Echantillon
Pointe
Microlevie
r
(cantilever)
Tube piézo-électrique
(déplacement vertical)
A
B
C
D
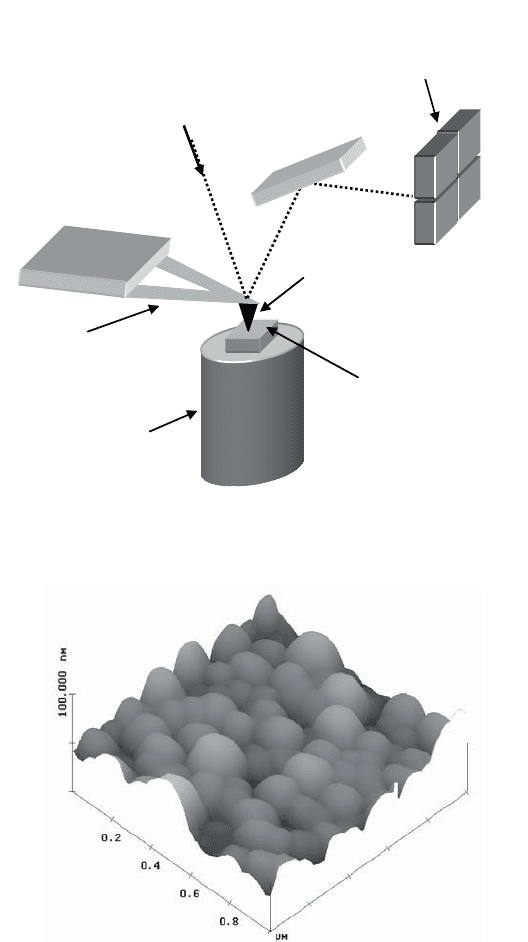
Four-quadrant photo detector
AFM signal: (A+B)–(C+D)
LFM signal: (A+C)–(B+D)
Photodiodes
Sample
Piezoelectric tube
(vertical displacement)
AFM tip
Mirror
Laser beam
Cantilever
Figure 1.15. Atomic force microscope
Figure 1.16. Atomic force microscope image of a copper coating deposited on silicon by
reactive magnetron sputtering
16 Materials and Surface Engineering in Tribology
When in contact mode, the tip of the atomic force microscope remains in contact
with the surface and scans its topography. The drawback of this method for soft
materials, however, is that it can scratch or deform the sample surface. In such cases,
we use the AFM in vibration mode where the probe is maintained a few nanometers
from the sample surface and subject to vibratory movement.
In contact mode, it is also possible to measure friction between the probe and the
sample. This is referred to as the friction mode and the device used is called a lateral
force microscope (LFM) [MAT 87]. As a result of frictional forces, the cantilever is
subject to distortions which modify the trajectory of the reflected laser beam (see
Figure 1.17).
The use of a four-quadrant photodetector allows the simultaneous detection of
the vertical and lateral deviations of the light beam: the former defining the
topographic state of the surface and the latter allowing friction measurements (see
Figure 1.15).
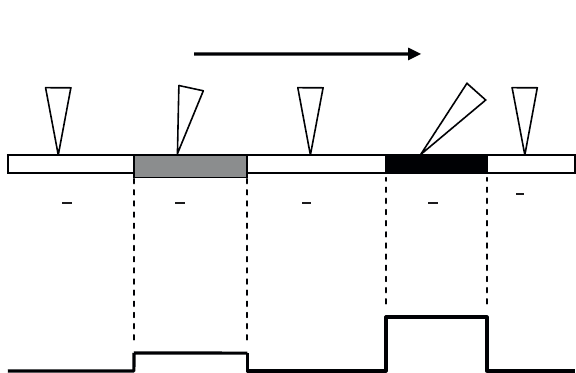
Figure 1.17. Displacement of the tip of an atomic force microscope on the surface of a
sample comprising three areas (1, 2, 3) of a different nature. (a) The higher the friction
between tip and surface, the greater the distortion will be for the tip; (b) illustrates the
recorded signal and the evolution of lateral forces during the displacement of the tip
Atomic force microscopes can also detect and map the electrostatic and magnetic
forces at the surface of a sample. In order to do this, the AFM is used in vibration
mode with the probe placed about 0.5 micron from the surface (far field vibration
1 2 1 3
1
a)
b)
Sens du déplacement de la pointe
Displacement of the tip
Surfaces 17
mode). At that distance, only electric and magnetic forces can be detected. Other
forces, such as the Van der Waals, chemical bonds or capillary forces (see section
2.5.1) are only detectable at closer distances (a few tens of nanometers).
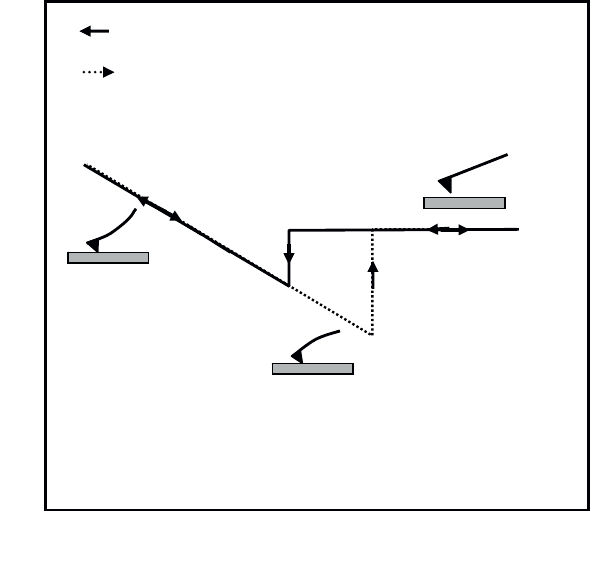
Force curves
Force curves show the variations in the interaction force between the tip and
the surface within a charge/discharge (or approach/withdrawal) cycle (see Figure
1.18).
When the AFM probe is far from the sample’s surface, molecular interaction
forces are weak and the cantilever’s deflection is near zero (see Figure 1.18a).
When the piezo-electric tube is actioned in order to bring the sample into contact
with the probe, two things can occur when the surfaces are sufficiently close
together (see Figure 1.15):
1) There is attraction and we observe that the probe jumps towards the surface
of amplitude į
1
> 0. This jump is due to Van der Waals-type interactions and reveals
information about their strength (this case is shown in Figure 1.18).
2) There is repulsion between the two surfaces (į
1
< 0).
If, once contact is established, the sample continues to be displaced towards the
probe, we observe a deflection of the cantilever (see Figure 1.18b) that varies
linearly with the displacement. Because the cantilever is flexible, it deforms
proportionally to the sample displacement, provided the probe does not indent the
surface.
If we now consider the withdrawal phase, we observe that the interruption of the
probe-sample contact occurs well beyond the position that would correspond to zero
force. We note in particular that į
2
, which represents the non-contact jump, is greater
than į
1
. į
2
accounts for the adhesion force between surfaces. With increased
adhesion, more energy will be required to break the contact and hence there will be
greater deflection of the cantilever į
2
(see Figure 1.18c).
The adhesion force is simply obtained by multiplying į
2
by k, the spring constant
of the cantilever (F
ad
= kį
2
).
18 Materials and Surface Engineering in Tribology
Figure 1.18. Force curve achieved with an atomic force microscope
1.2.3. Surface energy
A solid’s surface energy is a particularly important property in the understanding
and prediction of many surface phenomena such as adhesion, friction and bonding.
It accounts for the reactivity of materials and is associated with the asymmetric force
field to which the surface atoms are subjected. As we have discussed previously, it is
this asymmetry that leads to the appearance of dangling bonds that allow the solid’s
surface to interact with its environment.
The surface energy of a solid is commonly noted J (J m
–2
), and corresponds to
the energy that must be provided to overcome the cohesion forces of the solid in
order to create a new unit area of surface [CARRE 83, COG 00, DAR 97,
DEGE 85].
Déplacement vertical de l’échantillon
Déflexion du microlevier
b)
G
1
G
2
L’aller (approche)
Le retour (retrait)
a)
c)
Approach
Withdrawal
Vertical displacement of the sample
Deflection of the cantilever
Surfaces 19
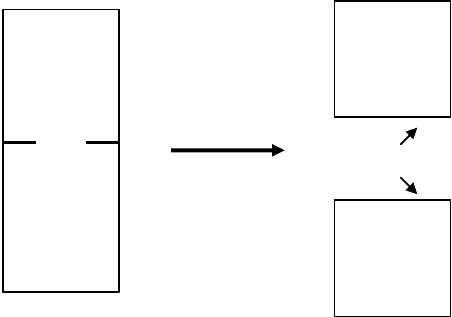
Consider two solids A and B in contact (see Figure 1.19); the energy needed to
separate them is called adhesion energy. It is expressed in the fundamental adhesion
relationship:
ABAB
W
J
JJ
[1.13]
where J
A
and J
B
are the surface energy of A and B, respectively, and J
AB
is the
interfacial energy.
In the case of a homogenous body, or when the surface energies of A and B are
the same, J
AB
is zero and the adhesion energy simplifies to:
AB
W
J
J
[1.14]
A
B
A
J
A
J
B
B
J
AB
Figure 1.19. Interfacial energy
J
AB
characterizes the contact between the two solids A and B;
the breaking of the contact yields two new surfaces of surface energy
J
A
and
J
B
A solid’s surface energy is therefore directly related to the nature of the bonds
between its atoms. These bonds can be chemical (covalent, ionic or metallic) or
physical (intermolecular Van der Waals or hydrogen bonds). Covalent materials are
characterized by a surface energy between 1000 and 3000 mJ m
–2
, while ionic
crystals have surface energies from 100 to 500 mJ m
–2
. Molecular crystals have even
lower surface energies that are generally less than 100 mJ m
–2
(see Table 1.1).

20 Materials and Surface Engineering in Tribology
Material
Surface energy
(mJ m
–2
)
Polytetrafluoroethylene (PTFE) 17
Polyethylene (PE) 32
Polyvinylchloride (PVC) 39
Polymethyl methacrylate (PMMA) 40
Polyamide (PA6) 42
Silicon dioxide 593
Aluminum oxide 1088
Copper (111) 2499
Copper (100) 2892
Tungsten (110) 3320
Tungsten (100) 4680
Table 1.1. Surface energy values for a few materials
Surface energy is sensitive to temperature. With increased temperature the
network atoms vibrate with increasing amplitude, leading to a decrease in the
cohesion energy of the material and a decrease in surface energy.
The adsorption of contaminants on a material’s surface, or its oxidation, can also
lead to a significant drop in surface energy that can decrease by over an order of
magnitude. Mica, for instance, has a surface energy of 5000 mJ m
–2
in ultra vacuum,
while measurements in air yield a value of 300 mJ m
–2
.
Surface energy is generally calculated from measurements of the contact angle of
a liquid with the surface of the solid studied (see Figure 1.20). The contact angle
results from the equilibrium between the three interfacial tensions:
Ȗ
SL
(solid/liquid), Ȗ
SV
(solid/vapor), Ȗ
LV
(liquid/vapor)
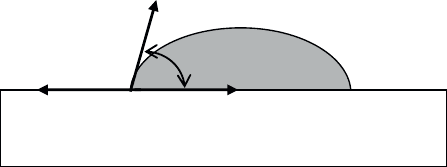
Surfaces 21
SL
J
LV
J
SV
J
T
Figure 1.20. Drop of liquid
in equilibrium on the surface of a solid
The equilibrium of the drop in the presence of the liquid’s vapor is represented
by Young’s equation:
cos
SV SL LV
J
JJ T
[1.15]
For the case of liquid–solid contact, equation [1.13] can be written:
L
VSVSL
W
J
JJ
[1.16]
Combining equations [1.15] and [1.16] yields:
(1 cos )
LV
W
J
T
[1.17]
W represents the adhesion energy between the liquid and the solid. When
T
= 0
(perfect wetting of the solid by the liquid), W has its maximum value:
LV
W
J
2
[1.18]
1.2.3.1 Surface energy measurements
1.2.3.1.1. The Fowkes [FOW 67], Owens and Wendt [OWE 69] method
The surface energy of a solid
J
SV
and the surface tension of a liquid
J
LV
can be
written as the sum of two components
J
d
and
J
p
:
p
LV
d
LVLV
JJJ
[1.19]
and
p
SV
d
SVSV
JJJ
[1.20]
22 Materials and Surface Engineering in Tribology
where
J
d
is the dispersive component of the surface energy and
J
p
is the polar
component. The former results from the interaction between instantaneous and
induced dipoles (London’s dispersion forces between non-polar molecules; see
section 2.5.1). The latter results from interactions including at least one polar
molecule (either two permanent dipoles or one permanent and one induced dipole)
(see section 2.5.1).
Table 1.2 gives values for
L
V
J
,
p
L
V
J
and
d
L
V
J
for some liquids.
Liquid
J
LV
(mJ m
–2
)
p
L
V
J
(mJ m
–2
)
d
L
V
J
(mJ m
–2
)
Water 72.6 51 21.6
Formamide 58.2 18.7 39.5
Diiodomethane 50.8 2.3 48.5
Ethylene glycol 48.3 19 29.3
D-bromonaphtalene 44.6 0 44.6
Tricresylphosphate 40.9 1.7 39.2
Dimethyl formamide 37.5 5 32.5
Octane 21.3 0 21.3
Hexane 18.4 0 18.4
Table 1.2. Surface tension values (
J
LV
) for a few liquids;
p
L
V
J
and
d
L
V
J
represent the dispersive and polar components
Interfacial solid-liquid energy can be expressed as either of the two following
equations:
2
ddd
SL SV LV
JJJ
[1.21]
and
2
ppp
SL SV LV
JJJ
[1.22]
We can therefore write:
Surfaces 23
22
dp d d p p
SL SL SL SV LV SV LV
JJJ J J J J
[1.23]
By combining equations [1.16, 1.17, 1.19–1.23], we obtain the following:
1cos
2
p
LV
p
d
LV
SV SV
d
d
LV
LV
JT
J
J
J
J
J
§·
¨¸
¨¸
©¹
[1.24]
The experimental determination of surface energy
J
SV
is achieved through the
measurement of the contact angle ș of two liquids of a known surface tension
J
LV
and its two components (one polar, one dispersive).
Equation [1.24] will enable us to write a two-equation system which, when
solved, will yield the polar and dispersive components of the surface energy.
However, greater precision for
J
SV
will be achieved if several (five to ten) liquids are
used.
In this case, if we plot
(1 cos ) / 2
d
L
VLV
J
TJ
as a function of
/
p
d
L
VLV
J
J
,
we obtain
a curve with a slope of
p
SV
J
and with ordinate-axis interception at
d
SV
J
.
1.2.3.1.2. The Good-Van Oss-Chaudhury method [VANO 88a, VANO 88b]
With this approach, we distinguish the dispersive interactions of the Lifshitz-Van
der Waals (or LW) type from acido-basic (or AB) type interactions, the latter being a
variant of polar interactions and occurring via the exchange/interchange of a pair of
electrons (Lewis acid). We write:
L
WAB
J
JJ
[1.25]
with:
2
AB
J
JJ
[1.26]
where Ȗ
+
and Ȗ
–
are parameters which show the contribution of the electron-acceptor
(Lewis acid) and the electron-donor (Lewis base), respectively.
The following equations have been proposed:
2
AB
SL SV SV LV LV SV LV SV LV
JJJJJJJJJ
[1.27]
24 Materials and Surface Engineering in Tribology
and
2
LW LW LW
SL SV LV
JJJ
[1.28]
By combining equations [1.16–1.17, 1.25–1.28], we obtain:
1cos 2
LW LW
L
VSVLVSVLVSVLV
JTJJJJJJ
[1.29]
The experimental determination of surface energy
J
SV
is achieved based on the
measurement of the contact angle ș of three liquids of a known superficial tension
J
LV
as well as its three components
LV
LW
LV
JJ
,
and
LV
J
.
Equation [1.29] will allow us to write a three-equation system which, once
solved, will enable us to obtain the different components of surface energy.
1.2.4. Mechanical state of a surface
The mechanical state of a surface can be characterized using four quantities:
1) hardness, which describes the resistance of materials to plastic deformation;
2) Young’s modulus and the elasticity limit (or plastic flow threshold), which
characterizes a material’s elastic properties;
3) toughness, which accounts for the relative brittleness of a material;
4) residual stresses, which play an important part in the resistance of the
material to wear and cracking.
1.2.4.1. Hardness
Hardness tests consist of using indenters to make an impression on a sample
material under a normal load (F) in order to measure the surface area (S) of the
residual impression that is left. The hardness is given by the ratio F/S.
Indenters can be of various shapes: a square-based pyramid is needed for the
Vickers test while spherical indenters are used for the Brinell test. For the Rockwell
test, we use either conical or spherical indenters and Shore hardness measurements
use two types of cones. Table 1.3 presents some values for hardness.