Tidwell J. Designing Interfaces (Second Edition)
Подождите немного. Документ загружается.

The Basics of Information Graphics 283
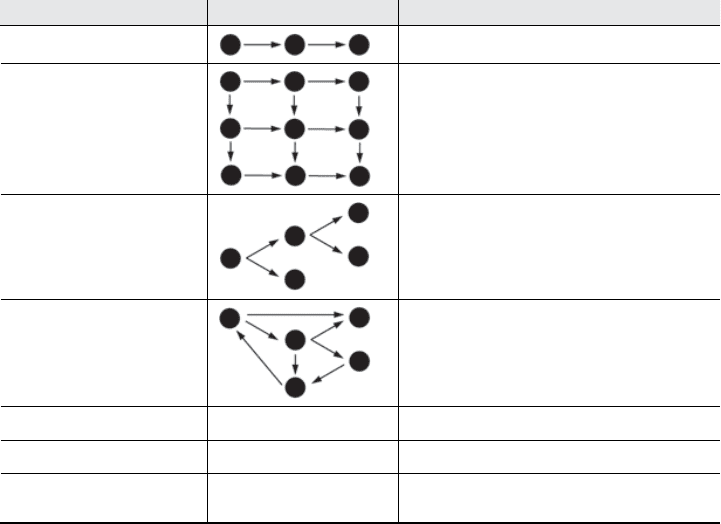
Table 7-1.
Organizational models
Model Diagram Common graphics
Linear
List, single-variable plot
Tabular
Spreadsheet, multicolumn list, Sor table Table, Radial
Table, Multi-Y Graph, other multivariable plots
Hierarchical Tree, Cascading Lists, Tree Table, Treemap, Radial
Table, directed graph
Network of interconnections
Directed graph, flowchart, Radial Table
Geographic (or spatial) Map, schematic, scatter plot
Textual Word cloud, directed graph
Other Plots of various sorts, such as parallel coordinate plots,
Treemaps, etc.
Try these out against the data you’re trying to show. If two or more might fit, consider
which ones play up which aspects of your data. If your data could be both geographic
and tabular, for instance, showing it as only a table may obscure its geographic nature—a
viewer may miss interesting features or relationships in the data if it’s not shown as a map,
too.
Preattentive Variables: What’s Related to What?
The organizational model you choose tells the user a lot about the shape of the data.
Part of this message operates at a subconscious level; people recognize trees, tables, and
maps, and they immediately make some assumptions about the underlying data before
they even start to think consciously about it. But it’s not just the shape that does this. The
look of the individual data elements also works at a subconscious level in the user’s mind:
things that look alike must be associated with each other.
If you’ve read Chapter 4, that should sound familiar—you already know about the Gestalt
principles. (If you jumped ahead in the book, this might be a good time to go back and
read the introduction to Chapter 4.) Most of those principles, especially similarity and
continuity, will come into play here, too. I’ll tell you a little more about how they work.
Do wnl oa d fr om W ow! e Bo ok < ww w.w ow eb oo k. co m>
284 Chapter 7: Showing Complex Data: Trees, Charts, and Other Information Graphics
Certain visual features operate preattentively: they convey information before the viewer
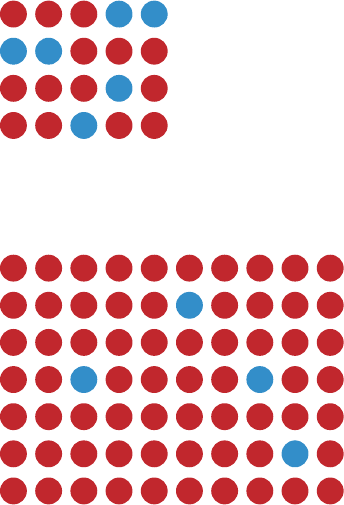
pays conscious attention. Take a look at Figure 7-1 and find the blue objects.
Figure 7-1.
Find the blue objects
I’m guessing that you can do that pretty quickly. Now look at Figure 7-2 and do the same.
Figure 7-2.
Find the blue objects again
You did that pretty quickly too, right? In fact, it doesn’t matter how many red objects there
are; the amount of time it takes you to find the blue ones is constant! You might think it
should be linear with the total number of objects—order-N time, in algorithmic terms—
but it’s not. Color operates at a primitive cognitive level. Your visual system does the hard
work for you, and it seems to work in a “massively parallel” fashion.
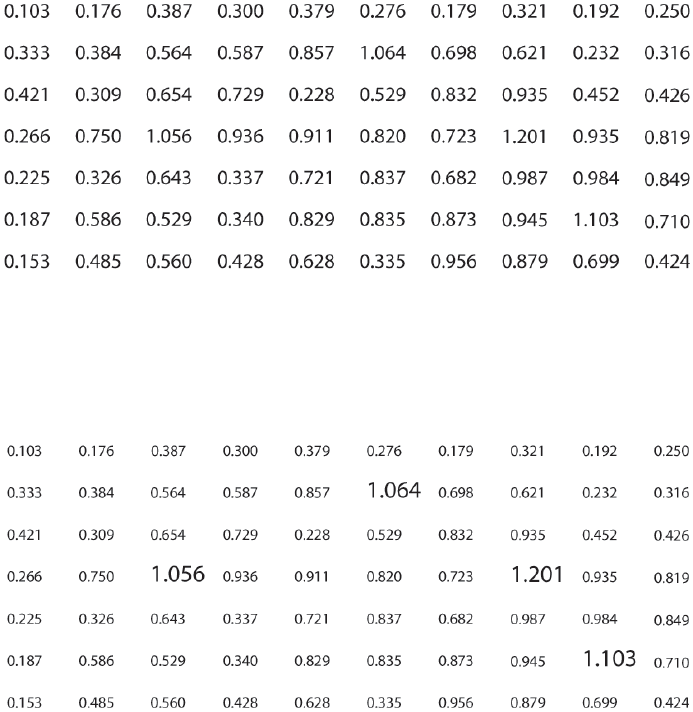
On the other hand, visually monotonous text forces you to read the values and think
about them. Figure 7-3 shows exactly the same problem with numbers instead of colors.
How fast can you find the numbers that are greater than one?
The Basics of Information Graphics 285
Figure 7-3.
Find the values greater than one
When dealing with text such as this, your “search time” really is linear with the number
of items. But what if we still used text, but made the target numbers physically larger than
the others, as in Figure 7-4?
Figure 7-4.
Find the values greater than one again
Now we’re back to constant time again. Size is, in fact, another preattentive variable. The
fact that the larger numbers protrude into their right margins also helps you find them—
alignment is yet another preattentive variable.
Figure 7-5 shows many known preattentive variables.
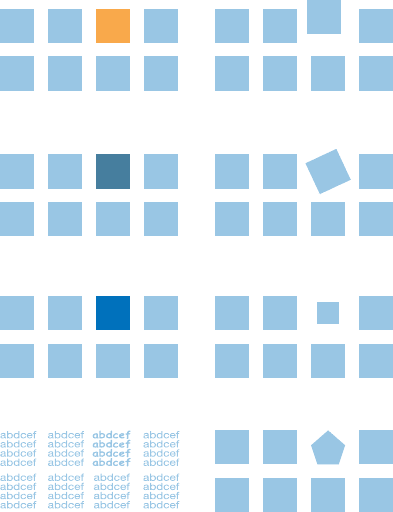
286 Chapter 7: Showing Complex Data: Trees, Charts, and Other Information Graphics
Color hue
Color brightness
Color saturation
Texture
Position and alignment
Orientation
Size
Shape
Figure 7-5.
Eight preattentive variables
This concept has profound implications for text-based information graphics, like the table
of numbers shown earlier in Figure 7-3. If you want some data points to stand out from
the others, you have to make them look different by varying their color, size, or some other
preattentive variable. More generally, you can use these variables to differentiate classes or
dimensions of data on any kind of information graphic. This is sometimes called encoding.
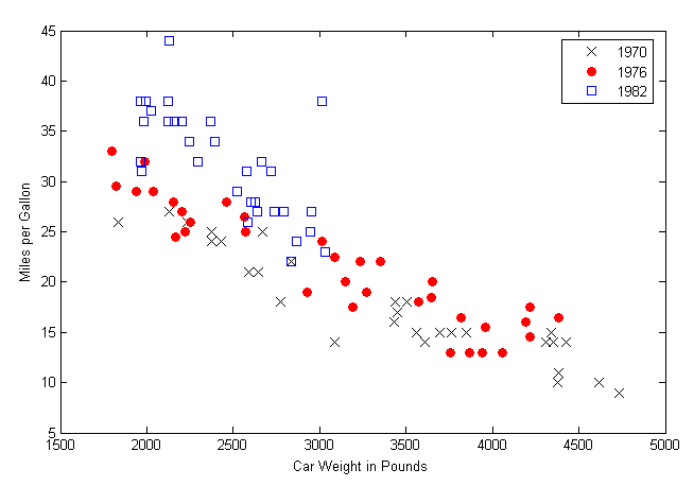
When you have to plot a multidimensional data set, you can use several different visual
variables to encode all those dimensions in a single static display. Consider the scatter plot
shown in Figure 7-6. Position is used along the x- and y-axes; color hue encodes a third
variable. The shape of the scatter markers could encode yet a fourth variable, but in this
case, shape is redundant with color hue. The redundant encoding helps a user visually
separate the three data groups.
All of this is related to a general graphic design concept called layering. When you look
at well-designed graphics of any sort, you perceive different classes of information on
the page. Preattentive factors such as color cause some of them to “pop” out of the page,
and similarity causes you to see those as connected to each other, as though each was on
a transparent layer over the base graphic. It’s an extremely effective way of segmenting
data—each layer is simpler than the whole graphic, and the viewer can study each in turn,
but relationships among the whole are preserved and emphasized.
The Basics of Information Graphics 287
Figure 7-6.
Encoding three variables in a scatter plot
Navigation and Browsing: How Can I Explore This Data?
A user’s first investigation of an interactive data graphic may be browsing—just looking
around to see what’s there. He may also navigate through it to find some specific thing
he’s seeking. Filtering and searching can serve that purpose too, but navigation through
the “virtual space” of a data set is often better.
Spatial Memory (Chapter 1) kicks in, and the
user can see points of interest in context with the rest of the data.
There’s a famous mantra in the information visualization field: “Focus plus context.” A
good visualization should permit a user to focus on a point of interest, while simultane-
ously showing enough stuff around that point of interest to give the user a sense of where
it is in the big picture.
Here are some common techniques for navigation and browsing:
Scroll and pan
If the whole data display won’t fit on-screen at once, you could put it in a scrolled
window, giving the user easy and familiar access to the off-screen portions. Scrollbars
are familiar to almost everyone and are easy to use. However, some displays are too
big, or their size is indeterminate (thus making scrollbars inaccurate), or they have
data beyond the visible window that needs to be retrieved or recalculated (thus making
scrollbars too slow to respond). Instead of using scrollbars in those cases, try setting
288 Chapter 7: Showing Complex Data: Trees, Charts, and Other Information Graphics
up buttons that the user has to click to retrieve the next screenful of data. Other ap-
plications do panning instead, in which the information graphic is “grabbed” with the
cursor and dragged until the point of interest is found, like in Google Maps.
These are appropriate for different situations, but the basic idea is the same: to in-
teractively move the visible part of the graphic. Sometimes
Overview Plus Detail can
help the user stay oriented. A small view of the whole graphic can be shown with an
indicator rectangle showing the visible “viewport”; the user might pan by dragging
that rectangle, in addition to using scrollbars or however else it’s done.
Zoom
Zooming changes the scale of the section being viewed, whereas scrolling changes the
location. When you present a data-dense map or graph, consider offering the user the
ability to zoom in on points of interest. It means you don’t have to pack every single
data detail into the full view—if you have lots of labels, or very tiny features (espe-
cially on maps), that may be impossible anyway. As the user zooms in, those features
can emerge when they have enough space.
Most zooms are triggered with a mouse click or button press, and the whole viewing
area changes scale at once. But that’s not the only way to zoom. Some applications
create nonlinear distortions of the information graphic as the user moves the mouse
pointer over the graphic: whatever is under the pointer is zoomed, but the stuff far
away from the pointer stays the same scale. See the
Local Zooming pattern for more
information.
Open and close points of interest
Tree views typically let users open and close parent items at will, so they can inspect
the contents of those items. Some hierarchically structured diagrams and graphs also
give users the chance to open and close parts of the diagram “in place,” without hav-
ing to open a new window or go to a new screen. With these mechanisms, the user
can explore containment or parent/child relationships easily, without leaving that
window. The
Cascading Lists pattern (Chapter 5) describes another effective way to
explore a hierarchy; it works entirely on single-click opening and closing of items.
Drill down into points of interest
Some information graphics just present a “top level” of information. A user might
click or double-click on a map to see information about the city she just clicked on, or
she might click on key points in a diagram to see subdiagrams. This “drilling down”
might reuse the same window, use a separate panel on the same window, or bring up
a new window. This technique is similar to opening and closing points of interest, ex-
cept that the viewing occurs separately from the graphic and is not integrated into it.
If you also provide a search facility for an interactive information graphic, consider link-
ing the search results to whichever of the aforementioned techniques is in use. In other
words, when a user searches for the city of Sydney on a map, show the map zooming and/
or panning to that point. The search user thus gets some of the benefits of context and
spatial memory.
The Basics of Information Graphics 289
Sorting and Rearranging: Can I Rearrange This Data to
See It Differently?
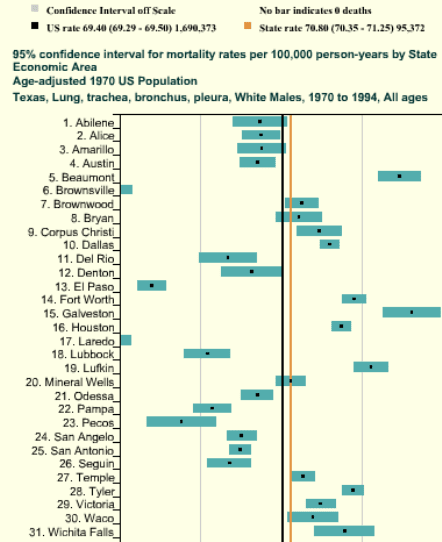
Sometimes just rearranging an information graphic can reveal unexpected relationships.
Look at Figure 7-7, taken from the National Cancer Institute’s online mortality charts.
It shows the number of deaths from lung cancer in the state of Texas. The major metro-
politan regions in Texas are arranged alphabetically—not an unreasonable default order
if you’re going to look up specific cities, but as presented, the data doesn’t lead you to ask
very many interesting questions. It’s not clear why Abilene, Alice, Amarillo, and Austin all
seem to have similar numbers, for instance; it may just be chance.
Figure 7-7.
Cancer data by city, sorted alphabetically
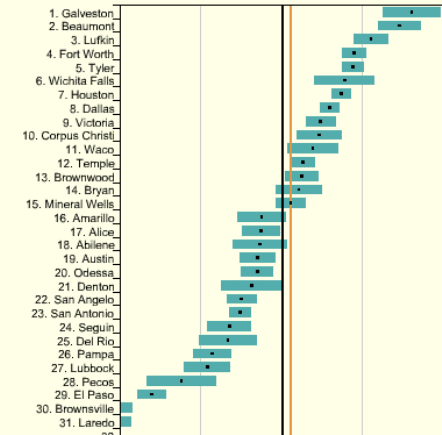
But this chart lets you reorder the data into numerically descending order, as in Figure
7-8. Suddenly the graph becomes much more interesting. Galveston is ranked first—
why is that, when its neighbor, Houston, is further down the scale? What’s special about
Galveston? (OK, you need to know something about Texas geography to ask these ques-
tions, but you get my point.) Likewise, why the difference between neighbors Dallas and
Fort Worth? And apparently the Mexico-bordering southern cities of El Paso, Brownsville,
and Laredo have less lung cancer than the rest of Texas; why might that be? You can’t an-
swer these questions with this data set, but at least you can ask them.
290 Chapter 7: Showing Complex Data: Trees, Charts, and Other Information Graphics
Figure 7-8.
The same chart, sorted numerically
People who can interact with data graphics this way have more opportunities to learn
from the graphic. Sorting and rearranging puts different data points next to each other,
thus letting users make different kinds of comparisons—it’s far easier to compare neigh-
bors than widely scattered points. And users tend to zero in on the extreme ends of scales,
as I did in the preceding example.
How else can you apply this concept? The
Sortable Table pattern talks about one obvious
way: when you have a many-columned table, users might want to sort the rows according
to their choice of column. This pattern is pretty common. (Many table implementations
also permit rearrangement of the columns themselves, by dragging.) Trees might allow
reordering of their child nodes. Diagrams and connected graphs might allow spatial re-
positioning of their elements, while retaining their connectivity. Use your imagination!
Consider these methods of sorting and rearranging:
• Alphabetically
• Numerically
• By date or time
• By physical location
• By category or tag
• By popularity—heavily used versus lightly used
The Basics of Information Graphics 291
• User-designed arrangement
• Completely random (you never know what you might see)
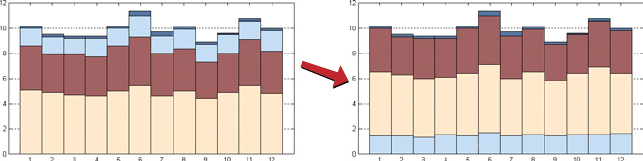
For a subtle example, take a look at Figure 7-9. Bar charts that show multiple data values
on each bar (known as stacked bar charts) might also be amenable to rearranging—the
bar segments nearest the baseline are the easiest to evaluate and compare, so you might
want to let users determine which variable is next to the baseline.
The light blue variable in this example might be the same height from bar to bar. Does it
vary, and how? Which light blue bars are the tallest? You really can’t tell until you move
that data series to the baseline—that transformation lines up the bases of all those blue
rectangles. Now a visual comparison is easy: light-blue bars 6 and 12 are the tallest, and
the variation seems loosely correlated to the overall bar heights.
Figure 7-9.
Rearrangement of a stacked bar chart
Searching and Filtering: How Can I See Only the Data That I Need?
Sometimes you don’t want to see an entire data set at once. You might start with the whole
thing and narrow it down to what you need—filtering—or you might build up a subset
of the data via searching or querying. Most users won’t even distinguish between filtering
and querying (though there’s a big difference from, say, a database’s point of view). The
user’s intent is the same: to zero in on whatever part of the data is of interest, and get rid
of the rest.
The simplest filtering and querying techniques offer users a choice of which aspects of the
data to view. Checkboxes and other one-click controls turn parts of the interactive graphic
on and off. A table might show some columns and not others, per the user’s choice; a map
might show only the points of interest (e.g., restaurants) selected by the user. The
Dynamic
Queries
pattern, which can offer very rich interaction, is a logical extension of simple filter
controls such as these.
Sometimes simply highlighting a subset of the data, rather than hiding or removing the
rest, is sufficient. That way a user can see that subset in context with the rest of the data.
Interactively, you can do this with simple controls, as described earlier. The
Data Brushing
pattern describes a variation of data highlighting; it highlights the same data in several
data graphics at once.
292 Chapter 7: Showing Complex Data: Trees, Charts, and Other Information Graphics
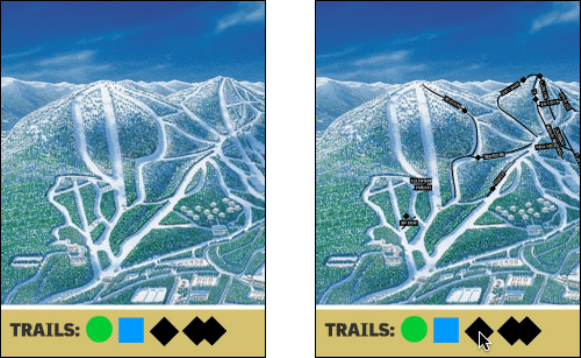
Look at Figure 7-10. This interactive ski-trail map can show four categories of trails,
coded by symbol, plus other features such as ski lifts and base lodges. When everything
is “turned on” at once, it’s so crowded that it’s hard to read anything! But users can click
on the trail symbols, as shown, to turn the data “layers” on and off. The screenshot on
the left shows no highlighted trails; the one on the right switches on the trails rated black
diamond with a single click.
Figure 7-10.
Interactive ski map
Searching mechanisms vary heavily from one type of graphic to another. A table or tree
should permit textual searches, of course; a map should offer searches on addresses and
other physical locations; numeric charts and plots might let users search for specific data
values or ranges of values. What are your users interested in searching on?
When the search is done and results obtained, you might set up the interface to show the
results in context, on the graphic—you could scroll the table or map so that the searched-
for item is in the middle of the viewport, for instance. Seeing the results in context with
the rest of the data helps the user understand the results better. The
Jump to Item pattern
in Chapter 5 is a common way to search and scroll in one step.
The best filtering and querying interfaces are:
Highly interactive
They respond as quickly as possible to the user’s searching and filtering. (Don’t react
to individual keystrokes if it significantly slows down the user’s typing, however.)