Tidwell J. Designing Interfaces (Second Edition)
Подождите немного. Документ загружается.


The Patterns 313
A larger principle here is coordinated or linked views. Multiple views on the same data can
be linked or synchronized so that certain manipulations—zooming, panning, selection,
and so forth—done to one view are simultaneously shown in the others. Coordination re-
inforces the idea that the views are simply different perspectives on the same data. Again,
the user focuses on the same data in different contexts, which can lead to insight.
How
First, how will users select or “brush” the data? It’s the same problem you’d have with any
selectable collection of objects: users might want one object or several, contiguous or
separate, selected all at once or incrementally. Consider these ideas:
• Drawing a rubber-band box around the data points (this is very common)
• Single selection by clicking with the mouse
• Selecting a range (if that makes sense) by Shift-clicking, as one can often do with lists
• Adding and subtracting points by Ctrl-clicking, also like lists
• Drawing an arbitrary “lasso” shape around the data points
• Inverting the selection via a menu item, button, or key
If you go exclusively with a rubber-band box, consider leaving the box on-screen after the
selection gesture. Some systems, such as Cornerstone, permit interactive resizing of the
brushing box. Actually, the user can benefit from any method of interactively expanding
or reducing the brushed set of points, because she can see the newly brushed points “light
up” immediately in the other views, which creates more possibility for insight.
As you can see, it’s important that the other views react immediately to
Data Brushing.
Make sure the system can handle a fast turnaround.
If the brushed data points appear with the same visual characteristics in all the data views,
including the graphic where the brushing occurs, the user can more easily find them and
recognize them as being brushed. They also form a single perceptual layer (see the section
“Preattentive Variables: What’s Related to What?” on page 283). Color hue is the preattentive
variable most frequently used for brushing, probably because you can see a bright color
so easily even when your attention is focused elsewhere.
Examples
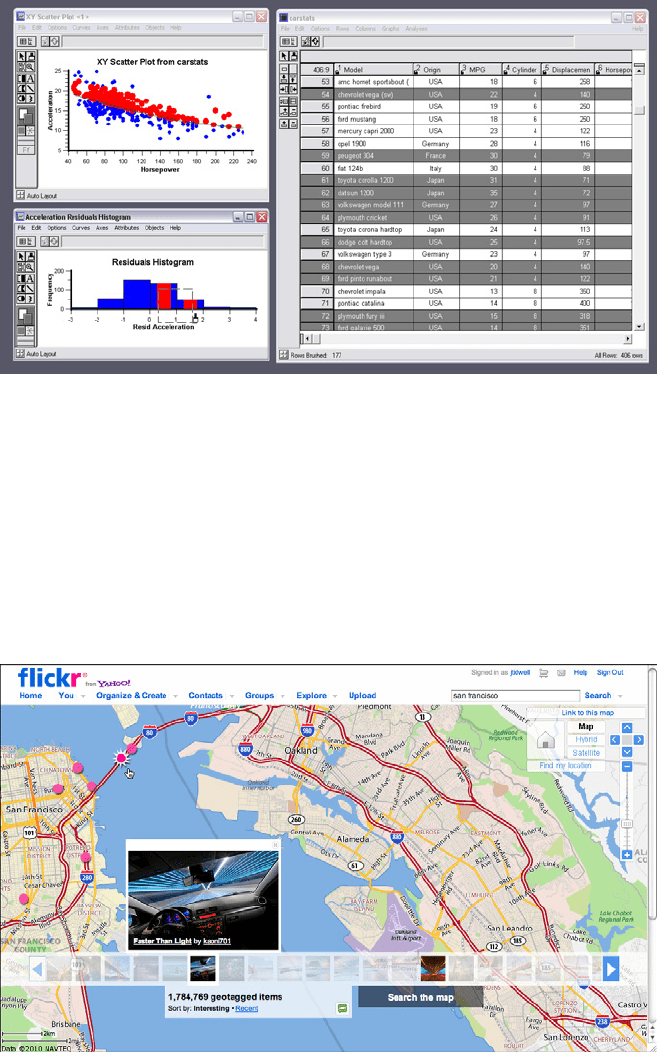
The screenshots shown in both Figures 7-26 and 7-27 are taken from Cornerstone, a sta-
tistics and graphing package. The three windows in Figure 7-27 represent a scatter plot,
a histogram of the residuals of one of the plotted variables, and a table of the raw data.
All views afford brushing; you can see the brushing box around two of the histogram’s
columns. Both plots show the brushed data in red, while the table shows it in gray. If you
“brushed” a car model in the table, you would see the dot representing that model appear
in red in the top plot, plus a red strip in the histogram.
314 Chapter 7: Showing Complex Data: Trees, Charts, and Other Information Graphics
Figure 7-27.
BBN Cornerstone, again
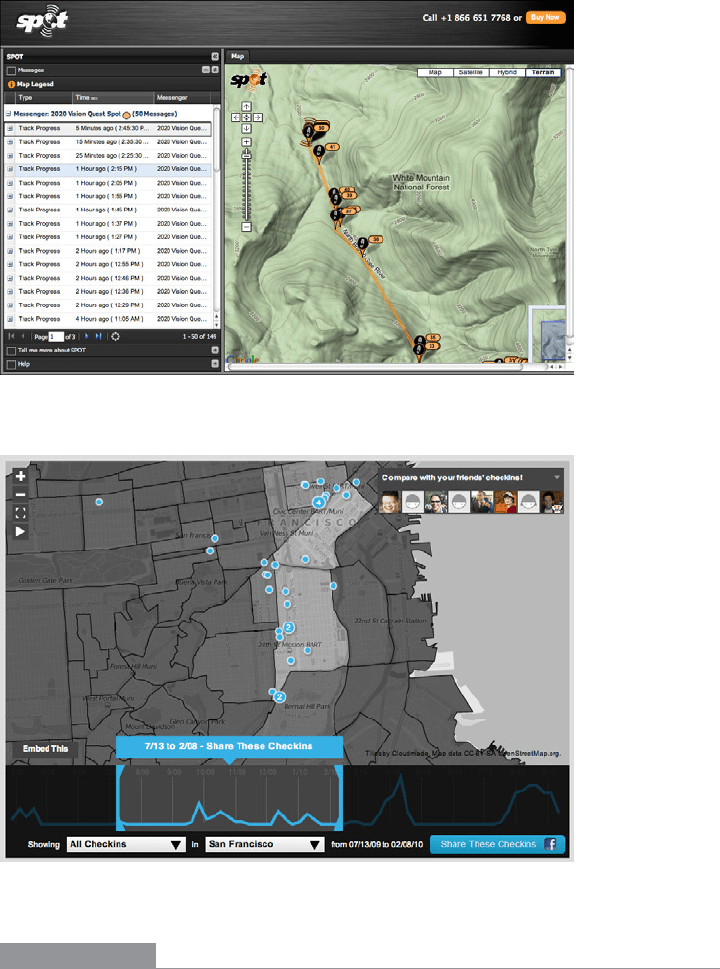
Maps lend themselves well to Data Brushing, because data shown in a geographic context
can often be organized and rendered in other ways as well. The following three examples
show map-based
Data Brushing: images in a filmstrip-like line (from Flickr, Figure 7-28),
GPS tracker locations in chronological order (from SPOT Adventures, Figure 7-29), and
Foursquare checkins by a person going from one social event to another, also in chrono-
logical order (from Weeplaces, Figure 7-30). In all three examples, selection of items in
the linear view causes the items to “light up” in the map view. Flickr and SPOT also do the
reverse—they let the user select items on the map itself, so they light up in the linear view.
Figure 7-28.
Flickr map (http://www.flickr.com/map/)
The Patterns 315
Figure 7-29.
SPOT Adventures live map
Figure 7-30.
Weeplaces (http://weeplaces.com)
In other libraries
http://quince.infragistics.com/Patterns/Data%20Brushing.aspx
This pattern, called Linked Multiples, is a generalization of
Data Brushing:
http://patternbrowser.org/code/pattern/pattern_anzeigen.php?4,225,17,0,0,246
316 Chapter 7: Showing Complex Data: Trees, Charts, and Other Information Graphics
Local Zooming
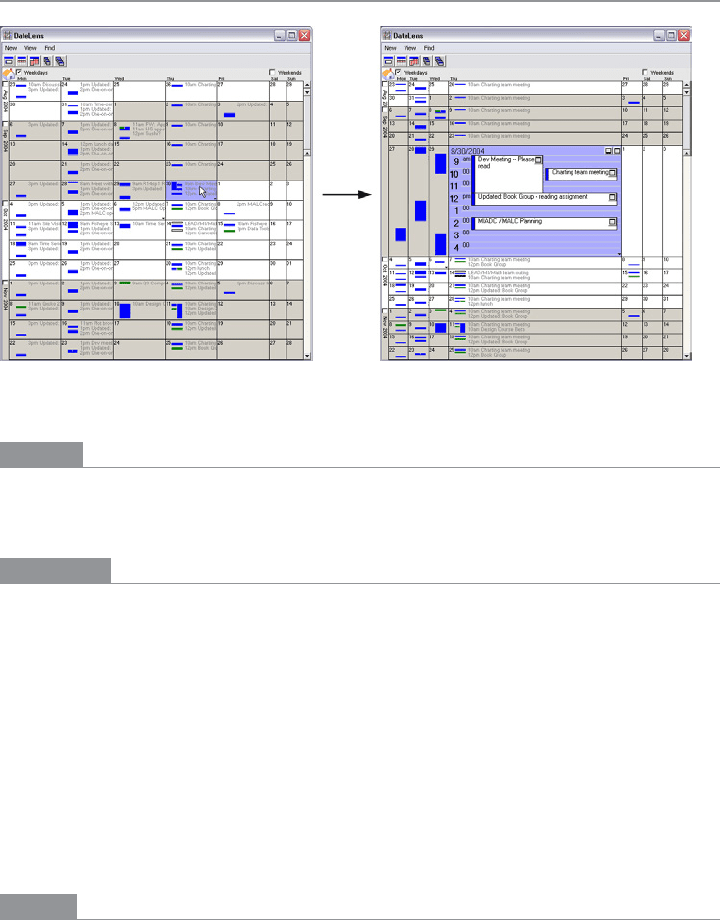
Figure 7-31.
The DateLens calendar
What
Show all the data in a single dense page, with small-scale data items. Wherever the mouse
goes, distort the page to make those data items large and readable.
Use when
You’re showing a large data set using any organizational form—plots, maps, networks,
or even tables—on either a large or a small screen. The user is able to “point at” places of
interest with a mouse cursor or a touch screen.
Users will browse through the data or search for points of interest within that organiza-
tional structure (e.g., finding a date in a calendar). High-level overviews are necessary for
finding those points of interest, but users don’t need to see all available detail for all data
points at once—zooming in is sufficient for getting fine detail.
Some forms of
Local Zooming, especially fisheye lenses, are appropriate only if your users
are willing to learn a new interaction technique to gain proficiency with a particular ap-
plication. Using
Local Zooming can require patience.
Why
Ordinary zooming works well for most high-density information graphics, but it takes
away context: a fully zoomed view no longer shows an overview of the whole data set.
Local Zooming focuses on local detail while retaining context. The user remains in the
same conceptual space.

The Patterns 317
One possible cost of Local Zooming, however, is distortion of that conceptual space. Notice
how the introduction of a fisheye—a type of local zoom that maintains topological con-
tinuity between the zoomed area and the rest of the view—changes the landscape in
Figure 7-31. Suddenly the overview doesn’t look the same as it did before: landmarks have
moved, and spatial relationships have changed (“It used to be halfway down the right side
of the screen, but it’s not there anymore”).
Other kinds of
Local Zooming don’t introduce distortion, but instead hide parts of the
overview. With a virtual magnifying glass, for instance, the user can see the zoomed area
and part of the larger context, but not what’s hidden by the magnifying glass “frame.”
The
Overview Plus Detail pattern is a viable alternative to Local Zooming. It too offers both
detail (focus) and a full overview (context) in the same page, but it separates the two levels
of scale into two side-by-side views, rather than integrating them into one distorted view.
If
Local Zooming is too difficult to implement or too hard for users to interact with, fall
back to
Overview Plus Detail.
The
Datatips pattern is another viable alternative. Again, you get both overview and detail,
but the information shown isn’t really a “zoom” as much as a description of the data at
that point. And a
Datatip is an ephemeral item layered over the top of the graphic, whereas
Local Zooming can be an integral part of the graphic and can therefore be printed and
screen-captured.
How
Fill all the available space with the whole data set, drawn very small. Stretch it to fill the
window dynamically (see the
Liquid Layout pattern in Chapter 4). Remove detail as neces-
sary. If text is an important element, use tiny fonts where you can; if the text still won’t fit,
use abstract visual representations such as solid rectangles or lines that approximate text.
Offer a local zoom mode. When the user turns it on and moves the pointer around, en-
large the small area directly under the pointer.
What the enlargement actually looks like depends on the kind of information graphic
you use—it doesn’t have to be literal, like a magnifying glass on a page. The DateLens,
in Figure 7-31, uses both horizontal and vertical enlargement and compression. But the
TableLens, in Figure 7-32, uses only a vertical enlargement and compression because the
data points of interest are whole rows, not a single cell in a row. A map or image, however,
needs to control both directions tightly in order to preserve its scale. In other words, don’t
stretch or squish a map. It’s harder to read that way.
Local zoom lenses can be finicky to drive, because the user might be aiming at very tiny
hit targets. They don’t look tiny—they’re magnified under the lens!—but the user actually
moves the pointer through the overview space, not the zoomed space. A small motion be-
comes a big jump. So when the data points are discrete, like table cells or network nodes,
you might consider jumping directly from one focal point to another.
318 Chapter 7: Showing Complex Data: Trees, Charts, and Other Information Graphics
It should be noted that fisheye views are an “advanced maneuver” in data visualization.
Fisheye views distort the area immediately around the zoom to achieve topological con-
tinuity with the rest of the graphic. (The DateLens is a fisheye, but the other examples
in this pattern are not.) This distortion can cause discomfort for the user who moves it
around a lot, for instance.
Examples
The DateLens, shown in Figure 7-31 at the top of the pattern, was a calendar application
that worked on both the desktop and a mobile device. (It was experimental, and support
for it ceased back around 2004.) It shows an overview of your calendar—each row is a
week—with blue blocks where your appointments are. For details, click on a cell. That cell
then expands, using an
Animated Transition (Chapter 3), to show the day’s schedule. In this
design, the entire graphic compresses to allow room for the focused day, except for the
row and the column containing that cell. (That actually provides useful information about
the week’s schedule and about other weeks’ Thursday appointments.)
The Inxight TableLens permitted the user to open arbitrary numbers of rows and move
that “window” up and down the table. Figure 7-32 shows four magnified rows. Note that
the only enlargement here is in the vertical direction.
Figure 7-32.
Inxight TableLens
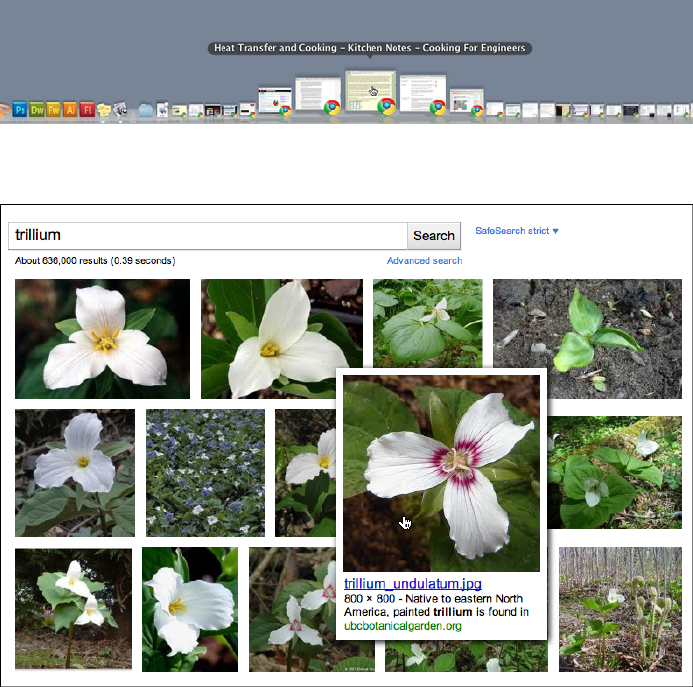
The Mac OS dock does a simple version of Local Zooming (Figure 7-33), as does Google
Images (Figure 7-34).
The Patterns 319
Figure 7-33.
Mac OS dock
Figure 7-34.
Google Images
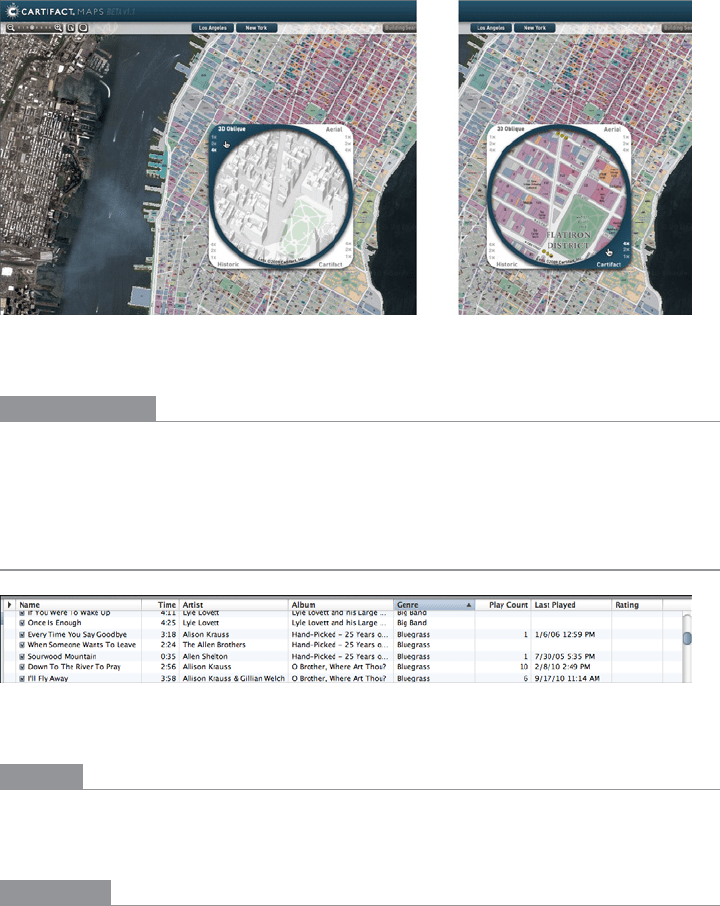
Cartifact’s map lenses—literal ones, yet remarkably beautiful—allow the user to set both
the magnification level and the drawing style inside the lens (see Figure 7-35). These
remove much of the user’s need to keep zooming into the map for detail, then back out
again for context, then back in again for more detail. The alternate drawing styles (aerial,
Cartifact, historic, and 3D oblique) let the user see one area in several complementary
ways, without affecting the entire map.
320 Chapter 7: Showing Complex Data: Trees, Charts, and Other Information Graphics
Figure 7-35.
Cartifact map lenses (http://cartifact.com/webmaps/)
In other libraries
http://patternbrowser.org/code/pattern/pattern_anzeigen.php?4,222,17,0,0,243
http://quince.infragistics.com/Patterns/Local%20Zooming.aspx
Sortable Table
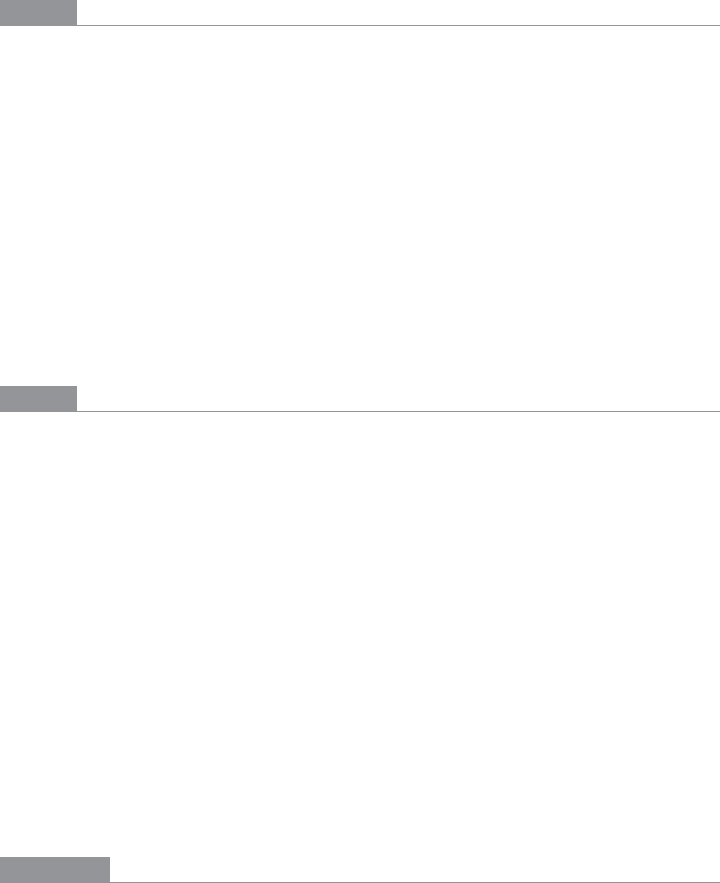
Figure 7-36.
iTunes sortable table header
What
Show the data in a table, and let the user sort the table rows according to the cell values
in a selected column.
Use when
The interface shows multivariate information that the user may want to explore, reorder,
customize, search through for a single item, or simply understand on the basis of those
different variables.
The Patterns 321
Why
Giving the user the ability to change the sorting order of a table has powerful effects. First,
it facilitates exploration. A user can now learn things from the data that she may never
have been able to otherwise. How many of this kind? What proportion of this to that? Is
there only one of these? What’s first or last? Suddenly it becomes easier to find specific
items, too; a user need only remember one attribute of the item in question (e.g., its last-
edited date), sort on that attribute, and look up the value she remembers.
Furthermore, if the sort order is retained from one invocation of the software to another,
this is a way for the user to effectively customize the UI for her preferred usage patterns.
Some users want the table sorted first to last, some last to first, and some by a variable no
one else thinks is interesting. It’s good to give a user that kind of control.
Finally, the clickable-header concept is familiar to many users now, and they may expect
it even if you don’t provide it.
How
Choose the columns (i.e., the variables) carefully. What would a user want to sort by or
search for? Conversely, what doesn’t need to be shown in this table? What can be hidden
until the user asks for more detail about a specific item?
The table headers should have some visual affordance that can be clicked on. Many have
beveled, button-like borders, or blue underlined text. You should use up or down arrows
to show whether the sort is in ascending or descending order. (And the presence of an
arrow shows which column was last sorted on—a fortuitous side effect!) Consider using
rollover effects, such as highlighting or cursor changes, on the headers to reinforce the
impression of clickability.
Use a stable sort algorithm. This means that if a user sorts first by name and then by date,
the resultant list will show ordered groups of same-date items that are each sorted by
name within the group. In other words, the current sort order will be retained in the next
sort to the extent possible—subtle, but very useful.
If your UI technology permits, you might let users reorder columns by dragging and
dropping.
Examples
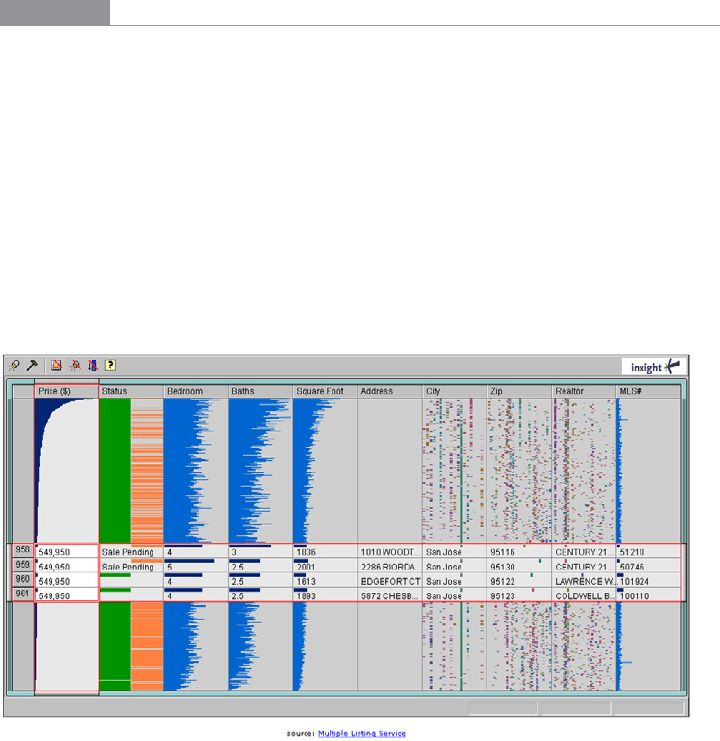
Inxight’s TableLens is a table whose rows compress down into tiny bars, the lengths of
which represent the values of the table cells. (Users can click on specific rows to see ordinary-
looking table rows, but that’s not what I want to talk about here.) One of the wonderful
things about this visualization is the ability to sort on any column—when the data is
highly correlated, as in this example, the user can see that correlation before her eyes.
Do wnl oa d fr om W ow! e Bo ok < ww w.w ow eb oo k. co m>
322 Chapter 7: Showing Complex Data: Trees, Charts, and Other Information Graphics
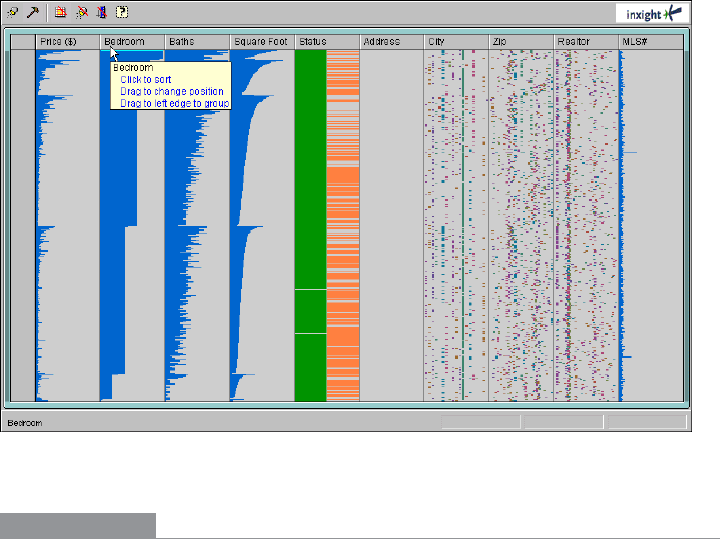
The data set shown in Figure 7-37 comprises houses for sale in Santa Clara County,
California. In this screenshot, the user has clicked on the Bedroom column header, thus
sorting on that variable: the more bedrooms, the longer the blue bar. Previously, the stable-
sorted table had been sorted on Square Foot (representing the size of the house), so you
see a secondary “saw-tooth” pattern there; all houses with four bedrooms, for instance, are
sorted by size. The Baths variable almost mirrors the Square Foot attribute, and so does
Price, which indicates a rough correlation. And it makes intuitive sense—the more bed-
rooms a house has, the more bathrooms it’s likely to have, and the bigger it’s likely to be.
You can imagine other questions that can be answered by this kind of interactive graphic.
Does zip code correlate to price? How strong is the correlation between price and square
footage? Do certain realtors work only in certain cities? How many realtors are there?
And so on.
Figure 7-37.
Inxight TableLens
In other libraries
http://ui-patterns.com/patterns/SortByColumn
http://www.welie.com/patterns/showPattern.php?patternID=table-sorter
http://quince.infragistics.com/Patterns/Sortable%20Table.aspx
http://patternbrowser.org/code/pattern/pattern_anzeigen.php?4,233,17,0,0,254