Tsoulos George (ред.) MIMO System Technology for Wireless Communications
Подождите немного. Документ загружается.

294 MIMO System Technology for Wireless Communications
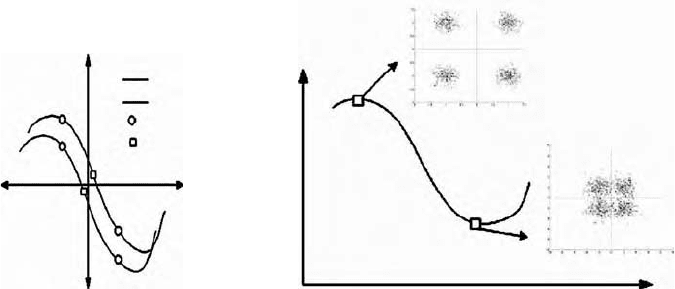
a channel makes a trajectory in the complex plane that goes near the origin.
If the pilot symbols are distorted by ISI, the reconstructed channel trajectory
will be in error. When the channel gain is relatively large, a small bias in
channel estimates will not have a big impact. When channel gain is near
zero in amplitude, a small bias in the channel value can actually result in a
deterministic error. This is observed on the left side of Figure 10.14 where
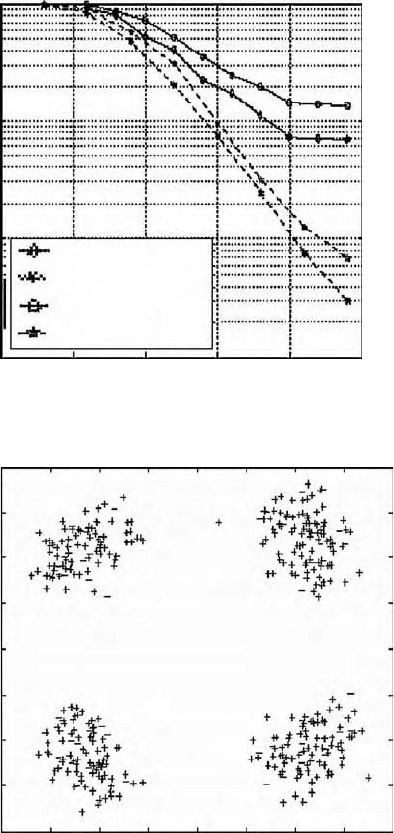
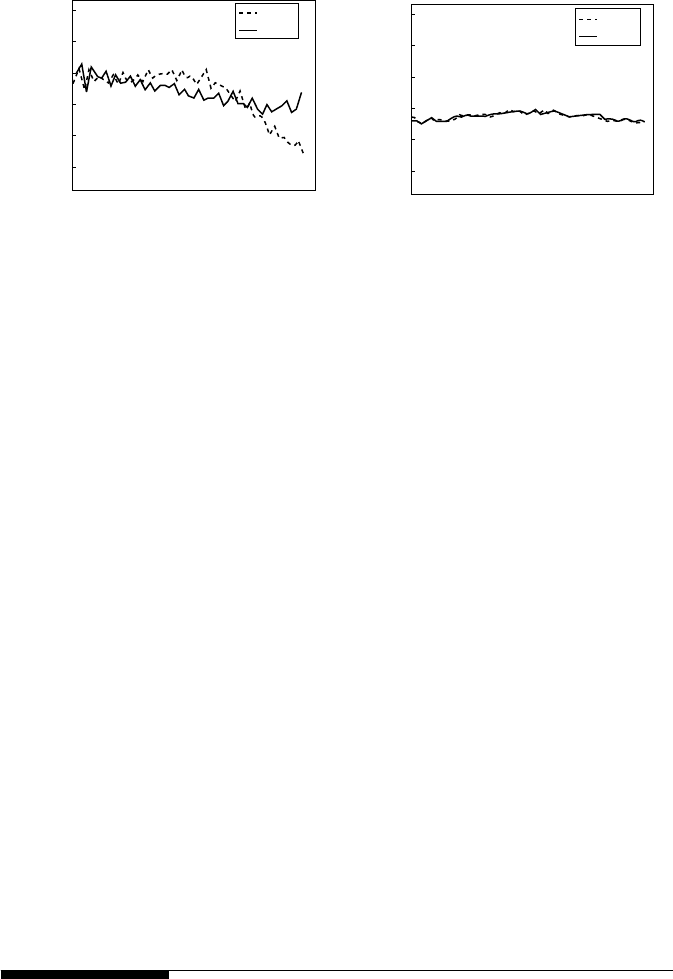
FIGURE 10.13
An example of an error floor in a space–time modem. (a) Frame error rate, (b) Scatter plot.
10
0
10
−1
10
−2
10
−3
0 5 10
Eb/NO dB
15 20
25
8000
6000
4000
2000
0
−2000
−4000
−6000
−8000
−8000
−6000
−4000
−2000
2000
4000
6000
8000
0
(b)
(a)
Benchtest f
D
= 20 Hz
Benchtest f
D
= 32 Hz
Simulation f
D
= 20 Hz
Simulation f
D
= 32 Hz
FER
4190_book.fm Page 294 Tuesday, February 21, 2006 9:14 AM
Multi-Antenna Testbeds for Wireless Communications 295
the actual channel estimation error is relatively small in magnitude but will
cause a very high error rate since the phase channel estimate is roughly 180°
out of phase with the true channel estimate. Simulation showed that this
bias in channel estimation leads to an error floor. Without companion sim-
ulation and emulation systems, this error floor would have been tough to
diagnose.
10.4.6 Frequency Offset Calibration
Accurate frequency offset calibration (i.e., compensation) is fundamental in
channel sounding applications of testbeds. In these cases, the transmissions
rarely have provisions for running synchronization algorithms at the receiver.
Therefore, the frequency offset must be measured between all transmitter-
receiver branch pairs prior to the field measurement campaign. This section
describes the corresponding procedure.
The sequel derives the mathematical model for the effect of frequency
offset among transceiver branches in the most general case, which corre-
sponds to the second approach discussed in Section 10.4.1 on distribution
of signals in MIMO systems. The first and third approaches are special cases
of the results that follow.
The baseband signal at the m
th
transmitter branch is modeled as:
(10.3)
where is the relative frequency and relative initial phase
modulation introduced by the transmitter branch m with respect to the ideal
carrier frequency and phase. x
m
(t) is the nominal transmit signal. Similarly,
the baseband signal at each receiver branch is modeled as:
FIGURE 10.14
Causes of performance degradation in rapid fading.
Ci(t)
True channel
Channel due to ISI
Pilot position
Channel estimate
Cq(t)
t
C(t)
ˆ
xktxt
mm m
() ()
kt e
m
j
m
t
m
()=
+2U^ V
4190_book.fm Page 295 Tuesday, February 21, 2006 9:14 AM
296 MIMO System Technology for Wireless Communications
(10.4)
where is the relative frequency and relative initial phase mod-
ulation introduced by the receiver branch n and y
n
(t) is the nominal received
signal. The frequency offsets and phase offsets are represented by the vari-
ables {^
m
, ^
n
} and {V
m
, V
n
}. The time index, t, is implied in the variables {k
m
, g
n
}
for notational simplicity.
The frequency and initial phase offset are incorporated in the MIMO signal
models according to:
(10.5)
where the distorted channel matrix is given by:
(10.6)
which assumes the channel matrix H to be static during the observation time,
and with K and G corresponding to the unitary (time-dependent) distortion
matrices due to the frequency offsets at transmitter and receiver branches,
respectively. K and G are given by:
(10.7)
The model of Equation 10.6 shows that all the frequency offset distortion
can be removed at the receiver. This requires estimating all the )
^
(m, n) =
^
m
– ^
n
and all the )
V
(m, n) = V
m
– V
n
. For channel capacity calculations, the
initial phase offset between the m
th
transmit branch and n
th
receiver branch,
)
V
(m, n) = V
m
– V
n
, can be neglected. Note that for an M × N MIMO system,
there are MN frequency offsets between the transmitter and receiver radios
that must be determined.
ˆ
ygtyt
nn n
() ()
gt e
n
j
n
t
n
()=
+2U^ V
YYt
HtXt Nt
HX N
()
=
() ()
+
()
+
H
HHt
KHG
kh g kh g kh g
kh g k
NN
()
=
=
1111 112 2 11
2211 22222
11 1
hg
khg kh g
MMMNN
¬
®
¼
¾
½
½
½
½
½
K
k
k
k
G
g
g
g
MN
=
¬
®
¼
¾
½
½
½
½
½
=
¬
®
1
2
1
2
0
0
0
0
,
¼
¾
½
½
½
½
½
4190_book.fm Page 296 Tuesday, February 21, 2006 9:14 AM
Multi-Antenna Testbeds for Wireless Communications 297
A method for estimating all )
^
(m, n) and )
V
(m, n) in MIMO-OFDM sys-
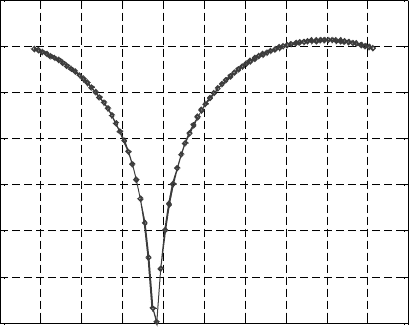
tems by measuring Inter-Carrier Interference (ICI) is described next. The
effect of a frequency offset in OFDM systems is to cause ICI at the receiver’s
FFT output. The sensitivity of the ICI to frequency offset is illustrated in
Figure 10.15, where the ICI power is plotted for a single subcarrier as a
function of a parameter called the tuning offset, )
T
(m, n). The tuning offset
sweeps all the possible compensation values for )
^
(m, n). When it takes the
value )
T
(m, n) = –)
^
(m, n), it eliminates ICI, revealing )
^
(m, n).
With this idea, benchtop calibration of the MN frequency offsets in a
MIMO-OFDM system is attained using a pilot signaling scheme similar to
that described in [33]. This scheme uses pilot tones distributed orthogonally
in space and time. The transmitter branches broadcast these pilot signals
over the air, and the received signal in the n
th
receiver is tuned across a range
of frequencies as shown in Figure 10.15. The ISI due to the m
th
transmitter
will be minimized when )
T
(m, n) = –)
^
(m, n). Repeating this tuning proce-
dure for each of the MN transmitter/receiver pairs will then fully character-
ize the frequency offset between all radios. Finally, the frequency offset may
vary slowly as a function of time due to changes in temperature in the radio
hardware. In this case, the characterization must be repeated regularly.
10.4.7 Frequency Response Calibration
Wideband transceivers almost never have flat frequency responses in their
passband. Figure 10.16 shows the measured frequency response for one of
the upconverter radios used in the 2.4 GHz MIMO-OFDM testbed. There is
FIGURE 10.15
Power as a function of tuning frequency for a single subcarrier in an OFDM system ()
f
(1,1) =
12.5 kHz).
−50 −40 −30 −20 −10 0 10 20 30 40 50
−80
−75
−70
−65
−60
−55
−50
−4
5
Tunin
g
offset (kHz)
ISI power(dB)
4190_book.fm Page 297 Tuesday, February 21, 2006 9:14 AM
298 MIMO System Technology for Wireless Communications
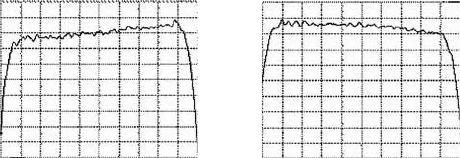
a notable 2-dB slope and ripples across the passband. More severe cases with
a 5-dB change across the passband were measured for other radio units. The
ripple and slope in the transceiver’s power spectrum is not usually an
important issue for tests involving error rate measurements in data commu-
nications because these non-idealities are considered part of the channel
response. However, uncharacterized non-ideal power spectra are problem-
atic when the testbed is used for MIMO channel sounding. For such appli-
cations, each radio’s frequency response must be characterized as part of the
calibration procedure. The basic procedure to calibrating a M × N MIMO
transceiver is outlined next.
10.4.7.1 Calibration of Transmitters
The strategy is to generate a known signal that can be used to probe the
transceiver’s spectrum across the entire transmission band. Two approaches
are feasible for generating such a signal: a sweep-frequency tone generator
or a wideband signal generator together with a spectrum analyzer.
The swept-frequency tone generator approach is simplest and involves
exciting the transmitter with a single tone whose frequency is stepped at
regular frequency intervals across the input band. An attenuator is placed
between the transmitter and spectrum analyzer to reduce the signal power
to a level that is safe for the analyzer. The spectrum analyzer then records
the (attenuated) transmitter output signal in peak-hold mode. Figure 10.16
is an example of the resulting spectrum using this technique. The disadvan-
tage of this method is that the peak-hold function records the larger peak
noise, instead of an average noise.
The second approach is to excite the transmitter with a set of evenly spaced
tones across its input band. This approach requires a wideband signal gen-
erator that can synthesize a user-defined signal. A suitable signal design is
proposed in [33]. The spectrum analyzer then records the transmitter’s out-
put in averaging mode. The benefit of this method is that zero mean AWGN
is cancelled out by averaging. The drawback is that the equipment required
to generate the wideband excitation signal can be more sophisticated and,
FIGURE 10.16
The measured frequency response spectrum of a transceiver radio in (a) transmit mode and
(b) receive mode.
−12 dBm −27 dBm
2.43 GHz
2.45 GHz
(a) (b)
8 dBm
−12 dBm
60 MHz
80 MHz
4190_book.fm Page 298 Tuesday, February 21, 2006 9:14 AM
Multi-Antenna Testbeds for Wireless Communications 299
hence, more expensive than the signal generator used to generate a swept-
frequency tone. Another benefit of using the wideband signal generator in
[33] is that the multiple transmitters in a MIMO system can be calibrated
simultaneously using a M-to-1 RF combiner and a single spectrum analyzer.
This is possible because spatial orthogonality in the excitation signal allows
the combined TX spectra to be separated in post-processing. An example of
the spectrum generated by this approach for a case with four radios is shown
in Figure 10.17. The four transmitter radios used are the same design as the
one shown in Figure 10.16a.
10.4.7.2 Calibration of Receivers
The procedure for calibrating the receivers is the same as that for calibrating
the transmitters except that connections to the inputs and outputs are
swapped. In the case that the signal generator cannot generate an excitation
signal at the radio frequency required by the receiver radio’s input, a calibrated
transmitter radio can be used to up-convert the excitation signal. The trans-
mitter’s output can then be connected through an attenuator to the receiver’s
input.
Once the frequency responses of all transmitter and all receiver branches
have been quantified, precise channel sounding measurements can be con-
ducted by pre-compensating the signal transmitted on each transmitter
branch, and by post-compensating the received signal of each receiver branch.
10.5 Field Test Administration
Once a testbed is fully calibrated in the laboratory and for its intended
environment, it is ready to be deployed for field tests and measurements.
FIGURE 10.17
(a) Measured power spectrum at the transmitter antenna port before pre-equalization by the
transmit DSP and (b) after pre-equalization.
−21
TX1
TX2
TX1
TX2
−22
−23
−24
Power spectrum(dBm)
−25
−26
−21
−22
−23
−24
Power spectrum(dBm)
−25
−26
2.43 2.45
(a)
(b)
Frequency(GHz)
2.43 2.45
Frequency(GHz)
4190_book.fm Page 299 Tuesday, February 21, 2006 9:14 AM

300 MIMO System Technology for Wireless Communications
At this point, the logistics of testbed deployment and data collection become
an important issue. A well-designed Graphical User Interface (GUI) greatly
facilitates setting up the testbed in the field and monitoring its operation.
Similarly, the collection of data tends to be cumbersome and labor-intensive
when performed manually, while automating the process allows for exten-
sive data collection in a variety of environments in an efficient and reliable
way. Both topics are addressed in the following sections.
10.5.1 Automated Field Measurements
The following example illustrates the value of automating measurements in
an experiment that tested space–time codec performance. Consider the chan-
nel experienced by a receiver as its antenna array moves within a square
area of 10 wavelengths on a side. The channel variation in such a small area
is due mainly to multipath interference. A typical spatial sampling pattern
used for testing the aforementioned space–time codec is specified below in
Table 10.3. For comparison, equivalent requirements for testing a SISO codec
are provided. For each spatial sample within the area, a full range of SNRs
is required to stress the codec in both the low and high capacity regions of
the channel realization associated with that spatial sample. This sampling
strategy ensures that the codec is subjected to a sufficient range of channels
and noise realizations to give a good approximation of its performance at
the microscopic (local) level. Several areas have to be measured in this way
to subject the codec to a range of macroscopic channel characteristics in the
larger environment.
A measurement proceeds according to the pseudo code given below. Lines
2–10 in the Measurement Pseudo Code can be executed automatically by a
single component in a MIMO testbed provided that (1) all components of
the testbed are able to communicate and (2) the spatial sampling can be
performed robotically. The 5 seconds allocated to each measurement (cf.
Table 10.3) include the time to execute lines 3–6 in the pseudo code. It is
clear from this example that acquiring a large data set requires a significant
TABLE 10.3
Measurement Budget
SISO Case MIMO Case
Sampling grid size 10Q x 10Q square 10Q x 10Q square
Spacing between grid points 0.5Q 0.5Q
Antenna array geometry Not applicable Linear
Antenna spacings Not applicable 0.5Q, 1Q, 1.5Q, 2Q
Total number of spatial samples 21*21 = 441 21*21*4 = 1764
Measurement interval 5 seconds 5 seconds
Measurement time per grid 441*5 = 38 minutes 1764*5 = 2.4 hours
Number of locations in environment 10 10
Total Experiment Time 38*10 = 6 hours 2.4*10 = 24 hours
4190_book.fm Page 300 Tuesday, February 21, 2006 9:14 AM

Multi-Antenna Testbeds for Wireless Communications 301
time investment. It would be impossible to manually place the antenna array
and to trigger the radio hardware with the allotted time per measurement
(and, at any rate, it would be a very inefficient use of qualified personnel).
Measurement repeatability and system reliability are other essential charac-
teristics that would be challenging for the test engineer to achieve but are
easily achieved with automation.
A testbed configuration with the above capabilities is illustrated in Figure
10.18. Robotic antenna arrays are responsible for spatial sampling by moving
the transmitter and receiver antenna arrays according to the spatial pattern
defined in Table 10.3. TCP/IP connectivity allows any terminal on the Inter-
net to control both radios and robots remotely.
An effective and affordable solution to automating spatial sampling can
be realized from LEGO
TM
Mindstorms components and open source software
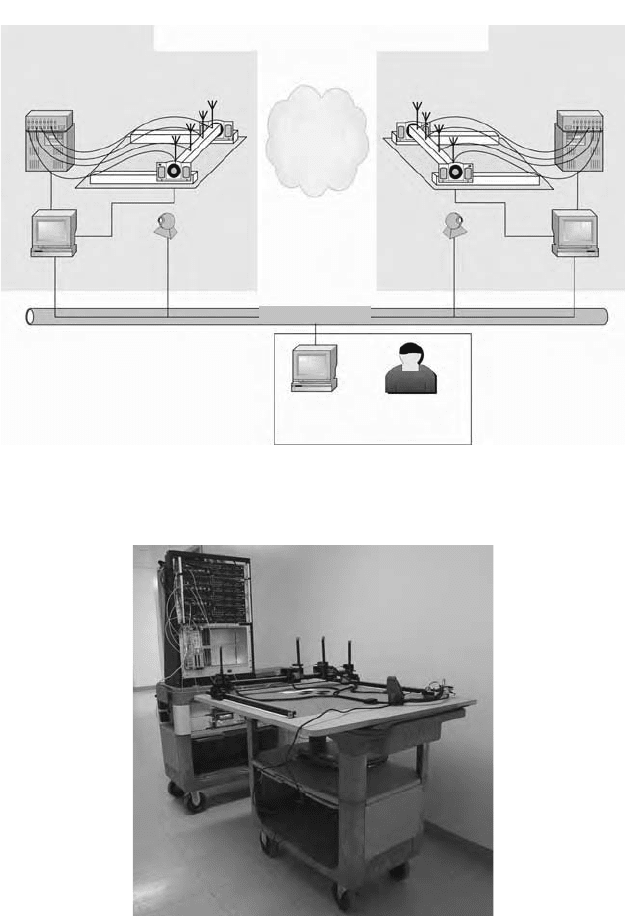
[32]. Two such robots are shown in Figure 10.19 and Figure 10.20. These
robots have a 1.59 mm positioning resolution and a 70 × 70 cm positioning
range. These dimensions are well suited to communications within the
1–10 GHz band where wavelengths (30–3 cm) are on the same order of
magnitude that can be achieved by Lego structures. The Lego system allows
the robots to be configured modularly so that as many as four antennas can
be move independently in azimuth. The software that controls the robots is
comprised entirely of Java-based code and allows the end user to control
the robot with high level commands (move, reset, calibrate, etc.). These
commands can be issued via TCP/IP as text strings, thereby enabling control
from any application that supports TCP socket communications (C++,
MATLAB, web browser, etc.).
Remote control of the robots is enhanced by using a web camera to stream
live video of the robot’s activity over the Internet. In the case of a mechanical
failure, the robots can alert the remote user of the problem by e-mail. This
affords the user the option of checking the experiment’s progress intermittently,
Measurement Pseudo Code
1 For each location in the environment
2 For each antenna separation
3 For each point in the sample grid
4 Encode data and transmit signal
5 Receive signal decode data
6 Tabulate information error rate
7 Move to the next point in sample grid
8 end
9 Change array geometry
10 end
11 move to the next location in the environment
4190_book.fm Page 301 Tuesday, February 21, 2006 9:14 AM
302 MIMO System Technology for Wireless Communications
instead of requiring constant vigil over long and tedious experiments.
Another great convenience of the automation system is that it allows a single
user to simultaneously control and monitor both the transmitter and receiver
FIGURE 10.18
A highly automated MIMO testbed.
FIGURE 10.19
Four-antenna transmitter and robotic antenna array.
Space–time
digital radio
Transmitter node Receiver node
Space–time
digital radio
Video
camera
Video
camera
Control
terminal
Control
terminal
Robotic
antenna array
Robotic
antenna array
Radio
channel
TCP/IP internet
Remote
control
terminal
Operator
(anywhere)
4190_book.fm Page 302 Tuesday, February 21, 2006 9:14 AM
Multi-Antenna Testbeds for Wireless Communications 303
units even though they may be located in different parts of a building or
neighborhood. This would otherwise require a minimum of two users.
10.5.2 Graphical User Interface Design
One vital feature of a testbed is to have well-designed Graphical User Inter-
face (GUI) for controlling its operation. In the authors’ experience, the test-
bed’s capabilities can be exploited at a maximum if the GUI provides the
following features:
1. Immediate (quasi real-time) feedback of test results and environ-
mental conditions
2. High flexibility for configuring and controlling system parameters
“on the fly”
3. A clear and easy-to-understand interface for demonstrating the test-
bed’s capabilities and features to third parties
Each of these three points is described in detail next.
Quasi real-time feedback: A GUI’s capability for reporting transmission
results and testbed status in real-time or immediately following transmission
simplifies the data collection and speeds up the measurement process. It
maximizes the efficiency of field measurement campaigns by allowing for
early detection of system failure, quick troubleshooting, and on-site assess-
ment of the environment’s validity for the desired test (e.g., channel condi-
tion, SNR, etc.). Useful information to display includes error statistics, signal
and noise power, scatter plots, instantaneous channel state information,
channel capacity, etc.
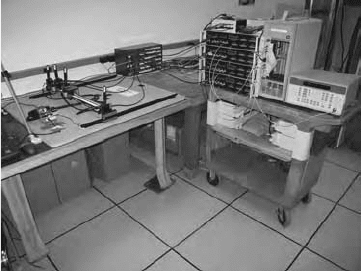
FIGURE 10.20
Four-antenna receiver radio and robotic antenna array.
4190_book.fm Page 303 Tuesday, February 21, 2006 9:14 AM