Vaccari D.A., Strom P.F., Alleman J.E. Environmental Biology for Engineers and Scientists
Подождите немного. Документ загружается.

carcinogen is to keep lifetime risk below 10
6
(0.0001%). However, for practical and
economic reasons, the dosages in laboratory experiments are selected to produce effects
with probability no lower than 10
1
. The biological uncertainties with such an extrapola-
tion are discussed below; here we discuss the mathematical aspects of the problem.
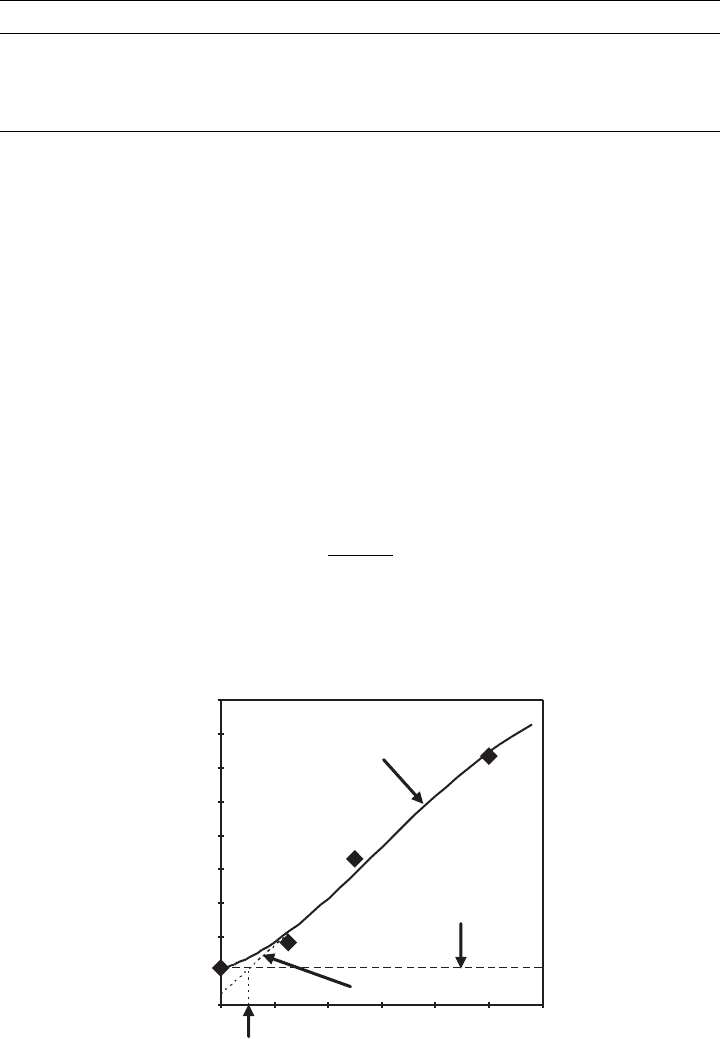
Table 19.5 and Figure 19.3 show a typical situation for the carcinogen dieldrin. The
data are shown in the first and second columns of the table. The excess risk (the risk
due to the toxin) is found by subtracting out the spontaneous risk (0.109 in this case).
Cancer bioassays are commonly run at only two or three dosages, plus a control. In
the example, the dosages at the three levels produced tumors in 18%, 43%, and 73%
of the test animals. How, then, should one extrapolate to estimate the dosage that
would produce tumors in 0.0001%? One of the simplest ways would be a linear extrapo-
lation of the two lowest data points, ðP
1
; d
1
Þ and ðP
2
; d
2
Þ. Thus, to compute the dose, d,
resulting in risk P:
d ¼ d
2
P
2
P
P
2
P
1
d
2
d
1
ðÞ ð19:12Þ
Or, simple linear regression could be used on all the data. Both of these approaches,
however, often produce a threshold below which the probability of harm would be
TABLE 19.5 Data and Model Results for Dieldrin
Dose (ppm) Fraction Having Tumors Excess Risk Predicted P Predicted Excess Risk
0.0 17/156 ¼0.109 0.000 0.107 0.000
1.25 11/60 ¼0.183 0.074 0.213 0.106
2.5 25/58 ¼0.431 0.322 0.389 0.282
5.0 44/60 ¼0.733 0.624 0.746 0.640
Source: Crump et al. (1977); original source Walder et al., 1972, Food Cosmet. Toxicol. Vol. 11, pp. 415–432.
0.0
0.1
0.2
0.3
0.4
0.5
0.6
0.7
0.8
0.9
0123456
Dosage (ppm)
Fraction having tumors
Background response
Multistage model
Linear model
Linear
Threshold
Figure 19.3 Dose–response curve for a carcinogen and extrapolation to low dosages by linear and
multistage models.
778
DOSE–RESPONSE RELATIONSHIPS

predicted to be zero. For biological reasons described below, this model is ruled out for
carcinogens. The next simpl est model is linear extrapolation of the lowest data point to the
origin:
d ¼
P
P
1
d
1
ð19:13Þ
This produces a very conservative result, one producing a low predicted dose for a
given risk. For example, u sing the data from Table 19.5, the lowest excess risk is 0.074
at a dosage of 1.25 ppm. Thus, the dosage that would produce a risk of 10
6
is
d ¼
10
6
0:074
ð1:25 ppmÞ¼1:69 10
5
ppm
Even more conservative is to use the upper confidence limit for P
1
, in place of P
1
in
equation (19.13). It is thought that every likely response would be below this line, making
this the most conservative model. Ideally, one of the mechanistic models would apply
instead of these empirical approachs, although two data or three points may be insufficient
to estimate their coefficients.
The major models used by regulatory agencies are the multistage, one-hit, multihit,
logit, probit, and Weibull models. The U.S. Occupational Health and Safety Administra-
tion (OSHA) has rejected the use of any models for setting standards. The U.S. EPA has
selected the linearized multistage (LMS) model. A maximum-likelihood method was
developed by Crump et al. (1977) to estimate the values of the b’s. Crump et al. fitted
the multistage model to the data in Table 19.5, obtaining
P ¼ 1 exp½ð0:11296 þ 0:05148 d þ 0:04007 d
2
Þ ð19:14Þ
The probability of an animal having tumors computed by this model is shown in the fourth
column of Table 19.5. The rate of spontaneous tumors can be estimated from this model
by setting d equal to zero, yielding 0.107 in the example.
At extremely low concentrations the quadratic term of the multistage model is insig-
nificant, and the model is approximatel y linear with d . The maximum likelihood proce-
dure also yields a 95% confidence interval around the prediction of the model. The upper
confidence limit of the model also is linear with d at low doses. The slope of the upper
confidence interval thus provides a conservative estimate of the sensi tivity of excess risk
to dose:
P ¼ CPF d ð19:15Þ
where CPF, the slope of the upper confidence interval, is called the carcinogenic potency
factor or slope factor. For example, the CPF for chloroform is 0.13 kg day/mg. Thus,
when CPF is found from the slop e of the upper 95% confidence interval of the multistage
model, equation (19.15), constitutes the linearized multistage model.
In 1996, the U.S. EPA proposed changes in its approach to low-dose extrapolation. The
proposed guideline recommends biologically based extrapolation when sufficient data
are available. One method that is part of the proposal is a linear extrapolation based on
the lower 95% confidence level of ED
10
, which is called LED
10
.
BACKGROUND RESPONSE 779

19.3.2 Thresholds
If a straight line is fitted to the three nonzero dosages and corresponding observed frac-
tional incidences from Table 19.5 by least-squares linear regression, the resulting model is
P ¼ 0:0322 þ 0:143 d ð19:16Þ
Extrapolation of this linear model at low doses is shown in Figure 19.3. The dosage at
which the line crosses the background risk is the threshold. The threshold can be com-
puted for this model from equation (19.16) by setting P equal to the background level
of 0.109 and solving for d. The resulting threshold is
d
threshold
¼
0:109 0:322
0:143
¼ 0:537 ppm
Below the threshold, the linear model predicts that there is no effect. In fact, for reg-
ulatory purposes the U.S. EPA assumes that a threshold exists for all noncarcinogenic tox-
ins. Put another way, it is assumed that for every noncarcinogenic toxin, there exists a
‘‘safe’’ dose at or below which one would expect a zero probability of having an adverse
reaction. At low doses damage becomes progressively small, until it is overwhelmed by
repair mechanisms or compensating factors. However, a tumor can be formed from a sin-
gle cell that has one or very few mutations. The tremendous amplification that occurs with
genetic effects makes the threshold assumption unrea sonable in the case of genotoxicity.
Many factors could produce inaccuracy in dose–response extrapolation. The high
doses used in animal studies can overload bioactivation mechanisms, resulting in under-
estimation of risk. One may also overload repair or elimination mechanisms, overestimat-
ing risks. There may be lower tumor incidence in a high-dose group, due to poor survival
among them. However, even if there is overestimation of risk, the notion of a threshold is
not supported.
Even if a threshold exists theoretically, as it may for some epigenetic carcinogens, the
fact that we are exposed not to a single toxin at a time, but to many, may rule out the
argument for assuming a threshold exists in actuality. In general, regulatory agencies
assume that there is no threshold for carcinogenesis.
19.4 INTERACTIONS
Since the environment contains numerous toxins, we are interested in their combined
effect. We worry that two pesticides taken up by the same organism may have a much
greater effect than either one alone. To detect such an effect, we must first define the
situation expected when two toxins act independently.
First, we need to establish the following fact: If d is the dosage of toxin A producing a
given response, 1=d is a direct measure of the toxicity of A. By direct measure we mean a
quantity that is p roportional to toxicity. For example, the LD
50
is the dosage that results in
50% mortality. However, LD
50
is inversely related to toxicity. We would consi der a toxin
that is twice as toxic as A to have half the LD
50
, and one 10 times as toxic to have one-
tenth the LD
50
. Thus, 1=LD
50
is a satisfactory measure of toxicity.
Next, let us define a parameter to describe the mixed dosage of two toxins, A and B,
with LD
50;A
and LD
50;B
, resp ectively. The mixed dosage, d
t
, will simply be the sum of
780 DOSE–RESPONSE RELATIONSHIPS
the individual dosages, d
A
and d
B
, respectively. Then the fraction of the total dosage, l
A
,
will be
l
A
¼
d
A
d
t
ð19:17Þ
A similar definition could be made for l
B
. Note that l
B
¼ 1 l
A
for a binary mixture.
The range of values for l
A
is 0.0 (pur e B) to 1.0 (pure A).
Now consider an experiment in which the toxicity of a mixture is determined. The
fraction l
A
is held constant but the total dosage d
t
is varied to determine the LD
50
of
the mixture ðLD
50;M
Þ. In general, LD
50;M
will depend on the fraction l
A
, and will
equal LD
50;B
when l
A
is zero and will equal LD
50;A
when l
A
is 1.0. The question is:
What happens in between?
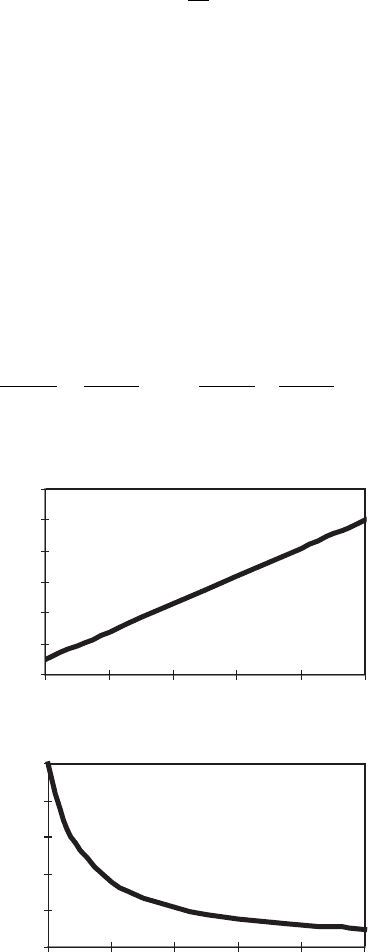
We can define the situation expected when the two toxins act independently: Two tox-
ins are said to show additive toxicity when the toxicity of a mixture of them (as measured
by inverse dosage) varies linearly with the mixture fraction. Figure 19.4a shows
this relationship. In the case where the dosage is the LD
50
, the equation of the straight
line is
1
LD
50;M
¼
1
LD
50;B
þ l
A
1
LD
50;A
1
LD
50;B
ð19:18Þ
0.00
0.02
0.04
0.06
0.08
0.10
0.12
0 0.2 0.4 0.6 0.8 1
(a)
0
20
40
60
80
100
00.20.40.60.81
(b)
λ
λ
LD
50
mix
1 / LD
50
mix
Figure 19.4 ðaÞ Linear relationship for toxicity (the inverse of LD
50
); ðbÞ effect of mixture
fraction (l) directly on LD
50
.
INTERACTIONS 781

This can be rearranged to the following equation, which can be used to predict the
additive LD
50;M
:
1
LD
50;M
¼
l
A
LD
50;A
þ
l
B
LD
50;B
ð19:19Þ
Figure 19.4b shows an example of how LD
50;M
will vary with l
A
according to equation
(19.18).
It is common to multiply equation (19.19) by LD
50;M
to obtain Marking and Dawson’s
(1975) equation for additive toxicity. The result is defined as S, the sum of toxic action,
and will equal 1.0 for additive toxicity:
S ¼
d
A
LD
50;A
þ
d
B
LD
50;B
ð19:20Þ
If the LD
50;M
measured equals that computed by equation (19.19) (or S ¼ 1:0), one can
conclude that the toxicity is additive.
Example 19.2 If compound A has an LC
50
of 100 mg/L, and compound B has an LC
50
of 10 mg/L, what would the additive model predict for the LC
50;M
of a 75 : 25 mixture of
the two?
Answer
l
A
¼ 0:75 LD
50;M
¼
1
0:75=100 þ 0:25=10
¼ 30:8
That is, a mixture of 23.1 mg/L A and 7.7 mg/L B will be expected to cause 50%
mortality.
More than two toxic substances: Equations (19.19) and (19.20) can be applied to any
number of toxins simply by adding similar terms. The sum of the l’s must be 1.0. Thus, a
more general form of equation (19.19), which appl ies to n different toxic substances, is
1
LD
50;M
¼
X
n
i¼1
l
i
LD
50;i
ð19:21Þ
where l
i
¼ d
i
=d
t
.
Example 19.3 What would be the expected EC
10
and associated individual concentra-
tions, according to the additive model, of a mixture consisting of 10% A, 20% B, and 70%
C? (All percentages are by weight.) The EC
10
values for the three compounds individually
are 10, 15, and 80 mg/L, respectively.
Answer
EC
10;M
¼
1
0:1=10 þ 0 :2=15 þ 0:7=80
¼ 31:17 mg=L
d
A
¼ð0:10Þð31:17Þ¼3:12 mg=L
d
B
¼ð0:20Þð31:17Þ¼6:23 mg=L
d
C
¼ð0:70Þð31:17Þ¼21:82 mg=L
782 DOSE–RESPONSE RELATIONSHIPS
Many organophosphate pesticides are additive toxins. This is because they have similar
properties and act by a very similar mechanism—covalent bonding with acetylcholines-
terase.
19.4.1 Nonadditive Interactions
If LD
50;M
measured in the laboratory is less than that computed by equatio n (19.19) (or
S < 1:0), the two toxins interact in a positive way. This is called synergistic interaction,
also called ‘‘more than additive.’’ Another type of positive interaction is when A is essen-
tially nontoxic by itself but causes an increase in the toxicity of B when present. This is
called potentiation (although this term is sometimes also used in the literature to indicate
synergistic interaction).
Unfortunately for the additive model, synergistic interactions are common, as is to be
expected, especially for an effect such as lethality. This is because, even if the two toxins
have completely independent effects, one may sicken the organisms, making them more
vulnerable to the effect of the other. The models of equations (19.19) or (19.21) could be
extended to nonlinear interactions by adding terms involving products of toxicities and
fitting the coefficients by regression. However, data on mixture toxicity are hard to
come by. Furthermore, they may not be consistent at different effect levels. That is, if
there is positive interaction between the LD
50
s of two compounds, it is not necessarily
true that there will be positive interaction to a similar extent, or at all, in their LD
01
values,
let alone at the 10
6
risk level.
In an exception to what was noted about organophosphate interactions above,
malathion interacts synergistically with some other organophosphates, as much as 50
times as strong in combination. As Rachel Carson put it in Silent Spring: ‘‘1/100 of the
lethal dose of each compound may be fatal when the two are combined.’’
Ethanol and carbon tetrachloride have a synergistic effect on the liver, and tobacco
smoke and asbestos interact in lung cancer. In the latter case the interaction was defined
differently from that above. It was observed that asbestos workers who did not smoke
experienced a fivefold increase in their risk of lung cancer, and cigarette smokers who
did not work with asbestos had an 11-fold increase. However, asbestos workers who
smoked experienced a 55-fold increase in lung cancer rate. Thus, the interaction here is
defined in terms of additivity of risk instead of additivity of toxicity. An example of poten-
tiation is isopropanol, which does not harm the liver by itself but greatly increases the
toxicity of carbon tetrachloride.
Positive interactions can be caused by a number of mechanisms, including:
By interfering with an enzyme that detoxifies other compound
By affecting absorption, blood transport, or excretion
By reacting to form a more toxic substance (e.g., nitrites and some amines react in
the stomach to form carcinogenic nitrosomines)
Induction of biotransformation enzymes
If two toxins interact, resulting in a measured toxic effect less than that predicted
by the additive model, this is a negative, or antagonistic, interaction, also called ‘‘less
than additive.’’ Antagonistic interactions are dete cted when the LD
50
value of a mixture
is greater than predicted by equations (19.19) or (19.21), or S > 1:0. Some antidotes
INTERACTIONS 783

take advantage of antagonistic interactions. Mechanisms causing negative interactions
include:
Chemical reactions, such as complexation between EDTA and heavy metals
Inhibition of bioactivation (e.g., toluene competitively inhibits the enzymes that
biotransform benzene)
Two toxins produce opposite effects, such as central nervous system depressants and
stimulants
Competition for the same receptor
Induction of detoxification enzymes
Enzyme induction was mentioned above as a mechanism of both positive and negative
interactions. The cytochrome P450 enzymes are a common target of induction. Benzene
can interact positively with other solvents by inducing cytochrome P450.
Example 19.4 Doudoroff (1952) measured the 8-hour LC
50
of zinc and copper to
fathead minnows (Pimephales promelas), obtaining LC
50;zinc
¼ 8mg=L and LC
50;copper
¼
0:2mg=L. He then tested a mixture with a fixed 1.0 mg/L zinc and varied the copper con-
centration to obtain the LC
50;M
. This was found to occur at a copper concentration of
0.025 mg/L. What kind of interaction is this?
Answer
l
Zn
¼
1:0
1:025
¼ 0:9756 l
Cu
¼
0:025
1:025
¼ 0:02439
LC
50;M
expected ¼
1
0:9756=8:0 þ 0:02439=0:2
¼ 4:1
ratio of observed LC
50;M
to expected LC
50;M
¼
1:025
4:1
¼ 0:25
Therefore, the toxicity of the mixture was four times that predicted by the additive model.
Using Marking and Dawson’s equation (19.20), we obtain S ¼ 0:250, which also indicates
more than additive toxicity.
It is easy to show that Marking and Dawson’s (1975) parameter corresponds to the ratio
S ¼
LD
50;M
observed
additive LD
50;M
ð19:22Þ
Therefore, S < 1:0 indicates positive interaction or synergism, and S > 1:0 indicates less
than addi tive or antagonistic interaction. Despite this simple interpretation for S, toxico-
logists prefer to transform it into an additive toxicity index, I, which eliminates the phy-
sical interpretation:
I ¼
1
S
1 for S < 1:0 ðgreater than additive interactionÞð19:23aÞ
I ¼ 1 S for S > 1:0 ðless than additive interactionÞð19:23bÞ
784 DOSE–RESPONSE RELATIONSHIPS
The resulting index produces a I value of 0.0 for additive toxicity, greater than 0.0 for
positive interaction, and less than 0.0 for negative interaction.
19.5 TIME–RESPONSE RELATIONSHIP
The picture of dose–response relationships we have been describing so far is a static one.
It assumes that all measurements are taken at a fixed interval after the first exposure.
Inclusion of time adds another dimension to the response and is an important qualifier
in any toxicity data. A 96-hour LD
50
may seriously underestimate the risk if the situation
being studied involves chronic, ongoing exposure.
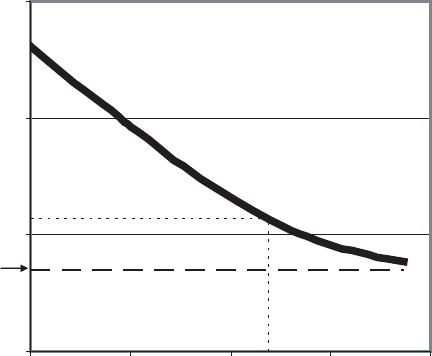
The progress of a toxicity test can be followed by examining the toxicity curve, made
by plotting the logarithm of time vs. the logarithm of the LD
50
. The toxicity curve indi-
cates when acute lethality has ceased by leveling off parallel to the time axis (Figure
19.5). The LD
50
associated with the plateau region is called the threshold LD
50
(denoted
as d
t
on Figure 19.5), also called asymptotic or incipient LD
50
. If a plateau is not
reached, the LD
50
computed will be sensitive to the experimental interval selected, and
it would be advisable to extend the test. The toxicity curve may assume other shapes as
well. This can provide the experimenter with information about how the compound acts or
may indicate the presence of multiple toxic agents in a tested mixture. In Figure 19.5 the
threshold LD
50
is 5 mg/L. The figure also indicates that the LD
50
would be 13.6 if the
organisms were exposed for just 24 hours.
19.6 OTHER MEASURES OF TOXIC EFFECT
Bioassay results are used to compute a variety of parameters related to the toxicity of an
agent. Table 19.6 summarizes some of the more common ones, along with acronyms used
1
10
100
1000
0 1 10 100 1000
Time (hrs)
LD
50
(mg/L)
d
t
Figure 19.5 Hypothetical time–toxicity curve.
TIME–RESPONSE RELATIONSHIP 785

for them. The MATC is usually given as a range: NOEC < MATC < LOEC. These para-
meters imply the existence of a toxic threshold. Often, only acute toxicity data, such as
LD
50
values, are available. One would like to estimate the MATC from acute data.
Although an estimated MATC would be of limited validity for application to the environ-
ment, it would be useful for determining the dosages to use in chronic toxicity tests. The
application factor (AP) is the ratio of acute to chronic toxicity. For example, the applica-
tion factor could be defined as LD
50
/MATC and would thus be given as a range. Applica-
tion factors for toxicity of xenobiotics to fish have been found to vary from 0.01 to 0.50.
More extreme cases exist, such as 0.003 for lead and chromium, and even lower for
certain pesticides.
All of the levels ref erred to in Table 19.16 are implicitly linked to an experimental and
statistical procedure for their measurement. For example, unless a compound exhibits a
true threshold effect, it should always be possible to detect adverse effects at a lower
dosage, by increasing the number of organisms in the experiment.
PROBLEMS
19.1. For the following simplified artificial toxicity data, plot the response curve and the
estimated tolerance distribution.
Dosage 0% 40% 50% 60% 100%
Mortality 0% 0% 50% 100% 100%
TABLE 19.6 Acronyms Describing Toxic Doses or Concentrations
LD
x
,LC
x
Lethal dose (or concentration) Dose or concentration resulting in mor-
tality to x percent of a test population.
ED
x
,EC
x
Effective dose (or concentration) Dose or concentration resulting in some
specified effect in x percent of a
population.
ID
x
,IC
x
Inhibitory dose (or concentration) Dose or concentration resulting in a
reduction of the normal response of an
organism (such as growth) by x per-
cent.
NOEL, NOEC No observed effect level
(or concentration)
Level or concentration below which no
effect has been measured experimen-
tally.
NOAEL, NOAEC No observed adverse effect level
(or concentration)
Level or concentration below which no
adverse toxic effect has been mea-
sured.
LOEL, LOEC Lowest observed effect level
(or concentration)
Lowest level or concentration at which an
effect could be observed.
MTC Minimum threshold
concentration
MATC Maximum allowable
toxicant concentration
Greater than NOEC and less than LOEC
as found from chronic toxicity test.
Source: Based on Landis and Yu (1995).
786 DOSE–RESPONSE RELATIONSHIPS
(a) Estimate LC
50
and LC
10
by interpolating the response curve. (b) Compute the
mean and standard deviation of the tolerance distribution using the method of
moments, and use these to compute LC
50
and LC
10
. (c) Compare the results and
explain any discrepancies. Which do you think is more reliable?
19.2. Many medicinal drugs are effective above a threshold dosage but toxic above a
higher threshold. This range is called the therapeutic window. Consider an
antibiotic being used to treat a potentially fatal infection. How would Figure 19.1
appear for such an antibiotic? What implications does the range between the two
thresholds have for how the drug is administere d (dosage, frequency)? Which
nutrient in Table 19.1 has the smallest ratio between the toxicity and deficiency
thresholds?
19.3. In a bioassay experiment, the lowest dose was 20 mg/kg and produced tumors in
three out of 13 animals. By linear extrapolation, what dosage will be expected to
produce a 10
6
risk?
19.4. The LD
50
of substance A is 10 mg/kg, and for substance B it is 1.5 mg/kg.
Assuming that there is no interaction, what would be the expected LD
50
of a
mixture that is 70% A and 30% B?
19.5. In the definition of additive toxicity of mixtures, why not say that com pound B is
twice as toxic as A if it results in double the mortality at the same dosage? (Hint:
Consider what would happen with respect to the dose–response curve if the two
substances, A and B, were the same thing.)
19.6. Two substances, A and B, have LC
50
values of 80 and 25 mg/L, respectively. A
mixture of the two containing A and B in a 3 : 1 ratio by mass has an LC
50
of
40 mg/L. Are the toxins additive, more than additive, or less than additive?
Compute the LC
50;M
predicted and Marking and Dawson’s S.
REFERENCES
Crump, K. S., H. A. Guess, and K. L. Deal, 1977. Confidence intervals and tests of hypothesis
concerning dose response relations inferred from animal carcinogenicity data, Biometrics, Vol. 33,
p. 437.
Doudoroff, P., B. G. Anderson, G. E. Burdick, P. S. Galtsoff, W. B. Hart, R. Patrick, E. R. Strong,
E. W. Surber, and W. M. Van Horn, 1951. Bioassay methods for the evaluation of acute toxicity of
industrial wastes to fish, Sewage and Industrial Wastes, Vol. 23, p. 1381.
Freidman, G. D., 1987. Primer of Epidemiology, 3rd ed., McGraw-Hill, New York.
Landis, W. G., and Ming-Ho Yu, 1995. Introduction to Environmental Toxicology: Impacts of
Chemicals Upon Ecological Systems, Lewis Publishers, Boca Raton, FL.
Marking, L. L., and V. K. Dawson, 1975. Method for assessment for toxicity or efficacy of mixtures of
chemicals. U.S. Fish Wildl. Serv. Fish Control, Vol. 67, pp. 1–8.
Merck, 2004. Merck Manual, http://www.merck.com/pubs/mmanual/section1/chapter3/3g.htm.
National Research Council, 1980. Recommended Dietary Allowances, Food and Nutrition Board,
NRC, National Academy of Sciences, Washington, DC.
National Toxicology Program. http://ntp-server.niehs.nih.gov/Main_Pages/Chem-HS.html.
World Health Organization, 2004. http://www.who.int/water_sanitation_health/GDWQ/Chemicals/
coppersum.htm.
REFERENCES 787