Westermeier R., Naven T., H?pker H.-R. Proteomics in Practice: A Guide to Successful Experimental Design
Подождите немного. Документ загружается.


1 Electrophoretic Techniques130
The development of software for 2-D electrophoresis gel image analy-
sis is a continuously ongoing process. The functions become more
reliable, reproducible and automated from year to year. With the lat-
est developed program it is already possible to compare gels of differ-
ent sizes, shapes, and even damaged gels. However, irreproducible
results cannot be fixed, even not by the most sophisticated software.
On the contrary: the highly developed programs recognize inconsis-
tencies between different patterns. Exact and tidy laboratory work is
still requested. The software cannot turn bad separation results into
good results.
There are two types of 2-D imaging software on the market:
.
Cheap to free of charge tools for basic image
analysis;
.
Professional programs, which evaluate with high
reproducibility and offer many valuable func-
tions for image analysis, statistical evaluation,
and reporting.
& The most critical parts in image analysis are spot
detection and background subtraction. Manual
spot editing and background definitions are
always user-biased.
Furthermore it is very important that the image analysis program
does not modify the raw data.
There are two different concepts of 2-D electrophoresis, which
require different approaches for image analysis and evaluation:
.
One sample per gel separations;
.
Multiplex separations like achieved with DIGE.
1.6.2.1 Traditional One Sample Per Gel Analysis
The following brief description is based on the concept of one of the
most advanced software packages, which is available under the name
ImageMaster Platinum, also known under the previous name “Mela-
nie”. The goal is to apply automatic procedures wherever possible, to
exclude manual editing and human interference.
Spot detection The most important step is spot detection, where dif-
ferent parameters have to be optimized:
.
With a “smooth” factor splitting of spots can be
influenced.
.
The selection of a certain “minimal area” elimi-
nates spots below the set threshold.
This can vary with different
sample types, pH gradients, gel
size and composition, detection
techniques.

1.6 Image Analysis 131
.
The definition of “saliency” discriminates
between real spots and artifacts (real spots have
higher saliency values).
These parameters are defined in a selected enlarged restricted area
and then applied on all gels of an experiment. Properly optimized
spot detection reduces spot editing close to zero.
Background correction A background subtraction function can easily
lead to errors. After many years of experience with spot volume quan-
tification it has been found that by defining the spot boundary at 75%
of the peak maximum and calculating the spot volume for only for
the values above the boundary, the relative spot volume quantification
comes very close to the real situation and ensures a very high repro-
ducibility.
Normalization Normalization takes care of the variation in protein
loading and staining. The spot volumes are normalized against the
total spot volume of the gel fully automatically without any user inter-
action.
pI and M
r
calibration There are two ways to calibrate the image for
pI and M
r
annotation (see also pages 98 and 118):
.
1-D calibration. Calibration curves are derived
from IPG pH gradient graphs for pI determina-
tion for one dimension and from the positions
of co-run molecular weight markers for the sec-
ond dimension by importing a ladder.
.
2-D calibration. pI and M
r
values are calibrated at
the same time by interpolating between known
values. These values usually come from mass
spectrometry analysis. A number of spots with
known protein properties are selected, the pI
and M
r
information are imported from the
respective protein lists belonging to these spots.
Gel viewing For visual inspection the spots they can be viewed in
two- and three-dimensional view.
Matching For differential analysis it is important to be able to super-
impose the spot patterns. This cannot be done directly, because typi-
cally there are local distortions caused by imperfections in gel matrix,
variations in gel running conditions, temperature effects, uneven
focusing, and polymerization issues. Formerly spot matching tried to
find corresponding spots in pairs of gels. However for automatic
For controlling the matching
efficiency vectors between the
spots of the gel pair are
displayed. The directions and
lengths of the vectors between
the corresponding spots make it
easy to detect mismatches.

1 Electrophoretic Techniques132
matching it is more efficient to search for pairs of features, using
spot clusters, spot shapes, sizes, and positions together. Even this fea-
ture-based matching can sometimes produce mismatches. Therefore
it is necessary to control this process by visual inspection, and per-
form corrections with setting landmarks.
Data analysis 2-D gel patterns are compared to detect qualitative
and/or quantitative protein expression changes between individual
samples or different populations. As already mentioned in the intro-
duction, the challenge is to find biologically significant changes
between different samples against the background of inherent biolo-
gical variations, induced variations during sample preparation, and
gel-to-gel variations.
Populations of replicate gels are compared to each other with so
called “match sets”. Arbitrary reference gels are no longer employed.
The match sets can be organized in various ways; this allows creating
different groups of gels.
Several statistical tools and clustering techniques are available to
extract results and to discover similarities or significant differences.
Preparing the spot picking list The x/y positions of the selected spots,
including the reference markers, are exported into a table. The num-
bers of the reference markers are automatically named “IR1” and
“IR2” (internal reference).
Reporting and exporting of data The results can be printed out in
images with or without annotations and tables. The files can also be
exported into Excel and other office software.
1.6.2.2 The Analysis of DIGE Gels
DIGE gels are obtained by labeling the proteins in different samples
with different, spectrally distinct fluorescent dyes, the CyDye fluors,
and running the mixed samples together in the same gel. Because of
the multiplex feature and the co-migration of the proteins to the iden-
tical spot coordinates, DIGE gels can be analyzed in a completely dif-
ferent way than traditional gels. This analysis runs almost fully auto-
matically.
The main philosophy in the differential approach of the DeCyder
software is the assumption that the protein compositions of different
samples within an experiment are very similar; that there are only a
few changes in protein expression levels, which are significant and
should be detected.
This reduces the user bias to a
minimum.
1.6 Image Analysis 133
The key points for the evaluation of DIGE gels are:
.
The co-detection of spots;
.
The co-separation of the pooled internal standard
in each gel;
.
Utilizing the internal standard for in-gel normal-
ization.
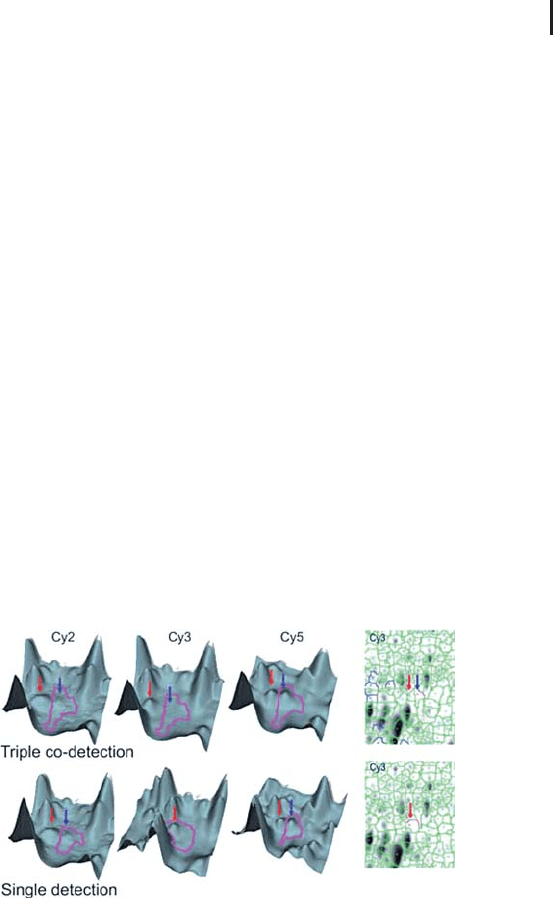
Co-detection As already mentioned before, because of the co-migra-
tion of the same proteins the spots do not need to be matched within
a gel. Thus the sample spot volumes can be directly related to the
standard spot volumes, which are originating from protein mixtures
of all samples. DeCyder does this automatically by employing a co-
detection algorithm. Co-detection means that for the definition and
assessment of a spot the information of all three channels is com-
bined. Each particular spot receives the identical spot boundary
across all three channels. In this way the relative spot volume calcula-
tion becomes very accurate, and splitting of double or multiple spots
is more reliable than manual splitting. If co-detection would not be
available, the operator of the software, as the supervisor of evaluation,
would detect the spot shoulders and perform manual splitting. Figure
1.49 shows a typical situation. With triple co-detection the correct
spot boundaries are applied. Single detection would lead to erroneous
spot matching.
Fig. 1.49: Comparison of spot boundary definition with triple
co-detection and single detection. On the left hand side the
three-dimensional view of all three channels; on the right hand
side the two-dimensional view of the Cy3 channel.
From Josef Blles with kind permission.
With the help of the internal standard the software can automati-
cally normalize the spot volumes.
1 Electrophoretic Techniques134
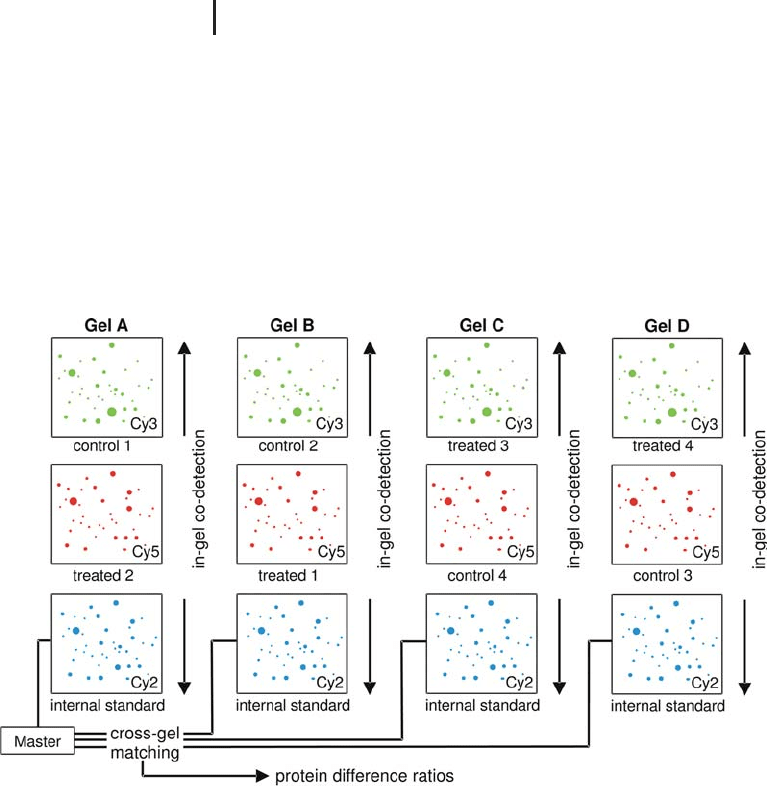
Linking the images of different gels via the internal standard A 2-D
electrophoresis experiment always consists of more than one gel.
Therefore the spot volume ratios have also to be compared across dif-
ferent gels. In this case a spot matching procedure has to be carried
out, because there are always some gel-to-gel variations, which do not
allow direct superimposing of the images. However, in each gel one
channel contains the image of the pooled internal standard. Because
these standard images originate from the identical sample mix, spot
matching is greatly facilitated. Figure 1.50 shows how the spot
volume ratios are compared across different gels with the help of the
internal standard.
Fig. 1.50: Schematic diagram showing the linking of data from
several gels via the internal standard images. Note also the reversed
labeling and the planned randomization of sample application.
With a batch processor a high number of images are evaluated fully
automatically, which saves hands-on time and keeps user bias to a
minimum. The significance of changes and quantitative differences
between protein expression levels can easily be checked with several
inbuilt statistical tools: Student’s t-test, one- and two-way ANOVA,
and false discovery rate adjustment. Differences in protein expression
levels of less than 10% can be detected with over 95% confidence.
The unique difference of this
approach to other programs is
the very high evaluation speed
from importing the images to a
reliable result.

1.6 Image Analysis 135
Two examples By using the internal standard concept gel-to-gel var-
iations and technical variations of software are considerably
decreased. Alban et al. (2003) have demonstrated the power of incor-
porating the pooled internal standard using an experimental model.
They generated a model for a time / dose experiment by spiking four
different commercial proteins into E. coli lysate: eight samples have
been prepared with different levels of the spikes. These samples were
analyzed with conventional one color 2-D electrophoresis and with 2-
D DIGE employing the pooled internal standards. The ability of both
methods to measure abundance changes and monitor trends in pro-
tein expression were compared. Besides the fact that the conventional
method is much slower, is more work intensive and needs more gels,
the results were inaccurate and the trends were incorrect when com-
pared to the defined spiking amounts and the results achieved with
the DIGE concept using the internal standard.
In the paper by Friedman et al. (2004) a very good real life example
for the usefulness of the internal standard is presented: In this study
healthy and tumor tissue of six patients were analyzed with 2-D
DIGE. Image analysis and data evaluation of the obtained results
were performed two times, with and without taking the internal stan-
dard in respect. Without the internal standard ten significant differ-
ences between the healthy and the tumor samples were found; but
using the internal standard revealed in total 52 significant differ-
ences.
Statistical evaluation Some valuable statistical aspects on difference
gel analysis can be found in a book chapter on DIGE applications in
clinical research (Sitek et al. 2006).
Extended data analysis Although 2-D DIGE in conjunction with the
powerful image analysis program can be applied for rather complex
experiments like multifactorial time/dose studies, there is a limita-
tion of the sample number contained in one experiment. Also, when
too many samples are analyzed in one experiment, one-time events
can be diluted out of the internal standard. For this reason and in
order to extract as much information as possible from a series of
experiments some additional multivariate statistical tools have been
made available:
.
Principal component analysis (PCA) reduces the
dimensionality of the data, in order to find the
underlying sources of variation. It is a useful
tool to find initial groupings of the data and
detect outliers.
.
Different clustering techniques reveal proteins
with similar expression profiles to find complex
Alban A, David S, Bjçrkesten L,
Andersson C, Sloge E, Lewis S,
Currie I. Proteomics 3 (2003)
36–44.
Friedman DB, Hill S, Keller JW,
Merchant NB, Levy SE, Coffey
RJ, Caprioli RM. Proteomics 4
(2004) 793–811.
Sitek B, Scheibe B, Jung K,
Schramm A, Sthler K. In:
Proteomics in Drug Research
(M Hamacher et al. Eds.)
Wiley-VCH, Weinheim (2006)
pp 33–55.
1 Electrophoretic Techniques136
partners and proteins which function together in
certain biological pathways.
.
With discriminant analysis proteins are found,
which could serve as classifiers as well as diag-
nostic or prognostic markers. With unsupervised
clustering unknown samples can be classified
without user bias.
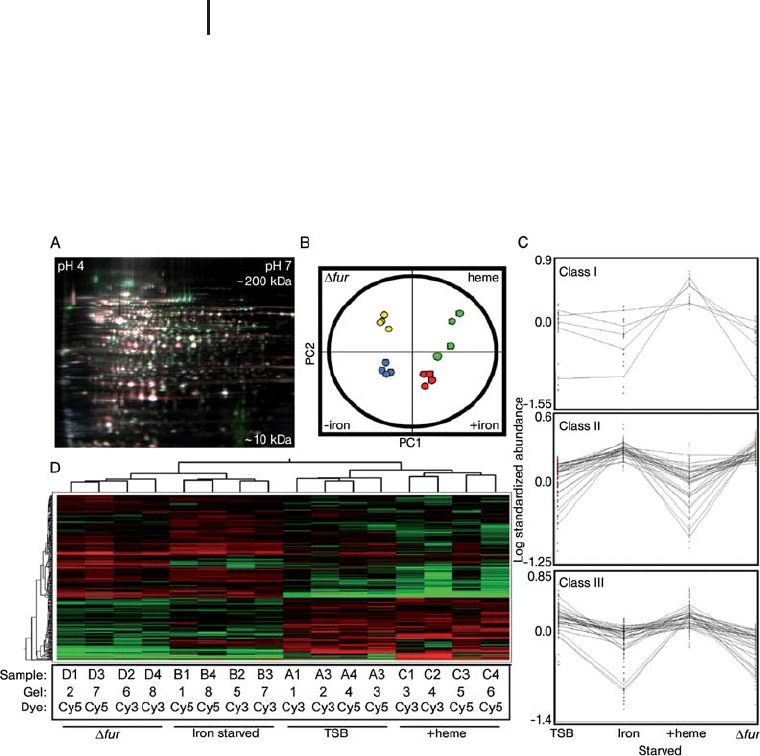
Fig. 1.51: Application of DeCyder
EDA: (A) False-colored representative
gel containing three differentially
labeled samples. Cy2-labeled internal
standard (blue), Cy3-labeled control
No. 1 (green), and Cy5-labeled iron-
starved No. 1 (red) are overlaid. (B)
Unsupervised PCA properly groups the
16 individual DIGE expression maps
differentiated by two principle compo-
nents (PC1 and PC2) and demonstrates
high reproducibility between the repli-
cate samples within each group.
(C) Composites of DIGE expression
patterns representing the five proteins
that increase abundance in the presence
of hemin, the 29 Class II protein
features negatively affected by Fur and
iron, and the 30 Class III protein
features positively affected by Fur and
iron. (D) Unsupervised hierarchical
clustering of 16 individual DIGE expres-
sion maps (groups, shown along top)
and of individual proteins (shown on
the left), with relative expression values
for each protein displayed as a heat
map using a relative scale ranging from
–0.5 (green) to +0.5 (red). From: DOI:
10.1371/journal.ppat.0020087.g001

1.7 Spot Handling 137
Friedman et al. (2006) have applied these multivariate statistical tools
on their study on the influences of Staphylococcus aureus on the cen-
tral metabolism of the host. Figure 1.51 shows combined images of
the 2-D electrophoresis result in false color representation, a PCA
grouping, K-means cluster, and a heat map of unsupervised hierarch-
ical clustering.
It is very useful, when the images of the results and the 2-D DIGE
experiment can be directly linked. The add-on software package
DeCyder EDA is programmed in such a way that the original experi-
mental data are directly available via a hyperlink by clicking on a PCA
spot or a band on the heat map.
Spot picking list Because the fluorescent dyes are not visible with
the eye, it is particularly useful to pick the spots from 2-D DIGE gels
according the x/y data of the image file.
1.6.3
Use of 2-D Electrophoresis Data
Most of the image analysis software includes a web browser to check
results of other laboratories in the World Wide Web. Because there is
no standardization for sample preparation and for running 2-D elec-
trophoresis, the spot patterns of different laboratories are not easy to
compare in practice.
A protein cannot be identified on the basis of its position in the gel
alone. Identification is only possible by further analysis of the pro-
tein, for instance with mass spectrometry. It is furthermore incorrect
to conclude that a protein is up or down regulated, just using the
information from growing or shrinking spot intensity. It is also possi-
ble that another protein had changed its pI due to phosphorylation or
another post-translational modification, and is now sitting on top of
the protein observed.
Therefore proteins of interest have to be analyzed further. This is
done mainly with mass spectrometry: The gel plugs containing the
protein are cut out of the gel slab subsequently to image analysis.
1.7
Spot Handling
Between image analysis and further analysis the gels can be kept in a
refrigerator for several weeks. It is also possible to dry the gels for sto-
rage and soak them in water before spot cutting.
In high-throughput proteomics it is very important to keep track of
each sample and of each protein to be analyzed. Before the proteins
Friedman DB, Stauff DL, Pish-
chany G, Whitwell CW, Torres
VJ, Skaar EP.
PLoS Pathog 2 (2006):
e87. DOI:
10.1371/journal.ppat.0020087
In this way the results can be
traced back very easily.
1 Electrophoretic Techniques138
contained in the spots can be analyzed with mass spectrometry a ser-
ies of steps have to be performed:
.
Spot picking;
.
Destaining and washing of the gel plug;
.
In-gel digestion;
.
Peptide extraction;
.
Spotting of peptides on MALDI target slides.
During this procedure mix-ups and contaminations have to be pre-
vented to avoid wrong conclusions.
In order to keep control over all these steps and parallel processes,
as well as the results, two things are necessary:
.
Automation;
.
Workflow database.
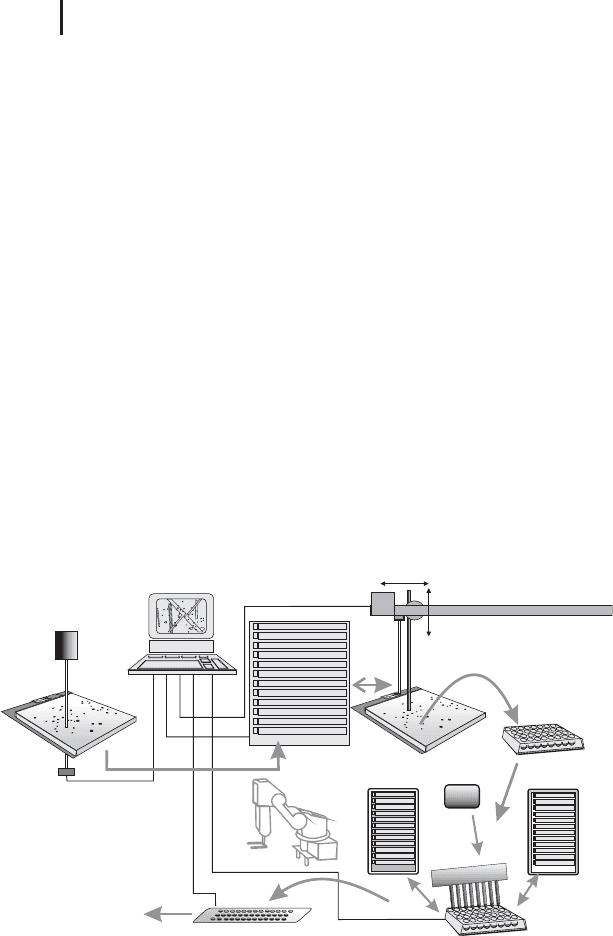
Therefore a workstation has been developed, which handles all steps
automatically. Figure 1.52 shows a schematic drawing of such an inte-
grated system. In the fully automated system a robotic arm transports
gels, microtiter plates and target slides between the stations. The
workstation is controlled by a laboratory workflow system software.
This software can control the entire proteome analysis workflow
including sample tracing.
image
analysis
2-D Gel
fixed on a film
or glass plate
digester
spot picker
gel hotel
spotter
drying oven
robotic
arm
incubator
refrigerator
trypsin
MALDI ToF MS
Fig. 1.52: Schematic drawing of an automated workstation for
spot picking, in-gel digestion, and spotting peptides on a
MALDI target slide.
The gels are identified with the help of barcodes on the support
films and the trays. After spot picking the gel is transported back to
the gel hotel. Many moves are needed for the digestion step. Spot

1.7 Spot Handling 139
picking and spotting are combined to be carried out by the same
instrument.
The laboratory workflow system can be extended to include all
instruments and software involved in the entire proteomics analysis,
from sample preparation to mass spectrometry.
In most of the laboratories the different steps are performed by
stand-alone instruments.
1.7.1
Spot Picking
Picking spots from a gel manually is a very cumbersome job. The
spots, marked in the printout of the image analysis for further analy-
sis, have to be found in the gel again and transferred to the correct
reaction tube or well of a microtiter plate. Sample tracing is not easy
and errors can easily occur. Additionally, contaminations with keratin
and other stuff must be avoided. This is a typical work for a laboratory
robot.
Robotic spot pickers are much more reliable for excising selected
spots from the gel slab and transferring them to defined wells of
microtiter plates. This automated picking can be controlled with a
CCD camera or by transferring the pixel coordinates from image ana-
lysis into the machine coordinates of the picker instrument.
For the second technique, the gel has to be immobilized on a rigid
support – a glass plate or a plastic film – prior to scanning. Two self-
adhesive reference markers, glued onto the support plate or film, are
necessary to enable the machine to recalculate the x/y positions of
the proteins from the imported picking list. The two markers are
automatically recognized by the camera and used as calculation
points for the spot positions. This procedure provides a very high
picking efficiency and accuracy, because it utilizes the high resolution
and sensitivity of the scanning device. Furthermore, using the image
analysis data, also fluorescent, non-stained and radioactive labeled
spots can be excised.
& Note: For this approach it is necessary and very
important that the image analysis software does
not modify the raw data.
Figure 1.53 shows the assembly of a robotic spot picker working
according this concept. The gel is placed into a liquid-containing tray
to prevent drying during the picking process. The glass plate or film
support is fixed at the bottom of the tray.
A picking file has to be created to assign the spot position to the
respective microtiter plate well.
The camera in this system has
only the function to find the
positions of the two reference
markers.