Whitbread D. The Design Manual (анг.яз.)
Подождите немного. Документ загружается.

Colour coding the slices works, or tonally coding the
slices in single-colour reproduction. Introducing line and
dot patterns into the slices rarely works because the
patterns do not have enough area in narrow slices to clearly
establish which pattern they are. ‘Exploded’ pie charts tend
to distort sizes and are consequently less accurately read.
Three-dimensional pies tend to confuse information. And
combining a pie chart with pieces that are different heights
due to a vertical graphing process—effectively bar-charting
a pie—is fascinating, but totally confusing for the reader.
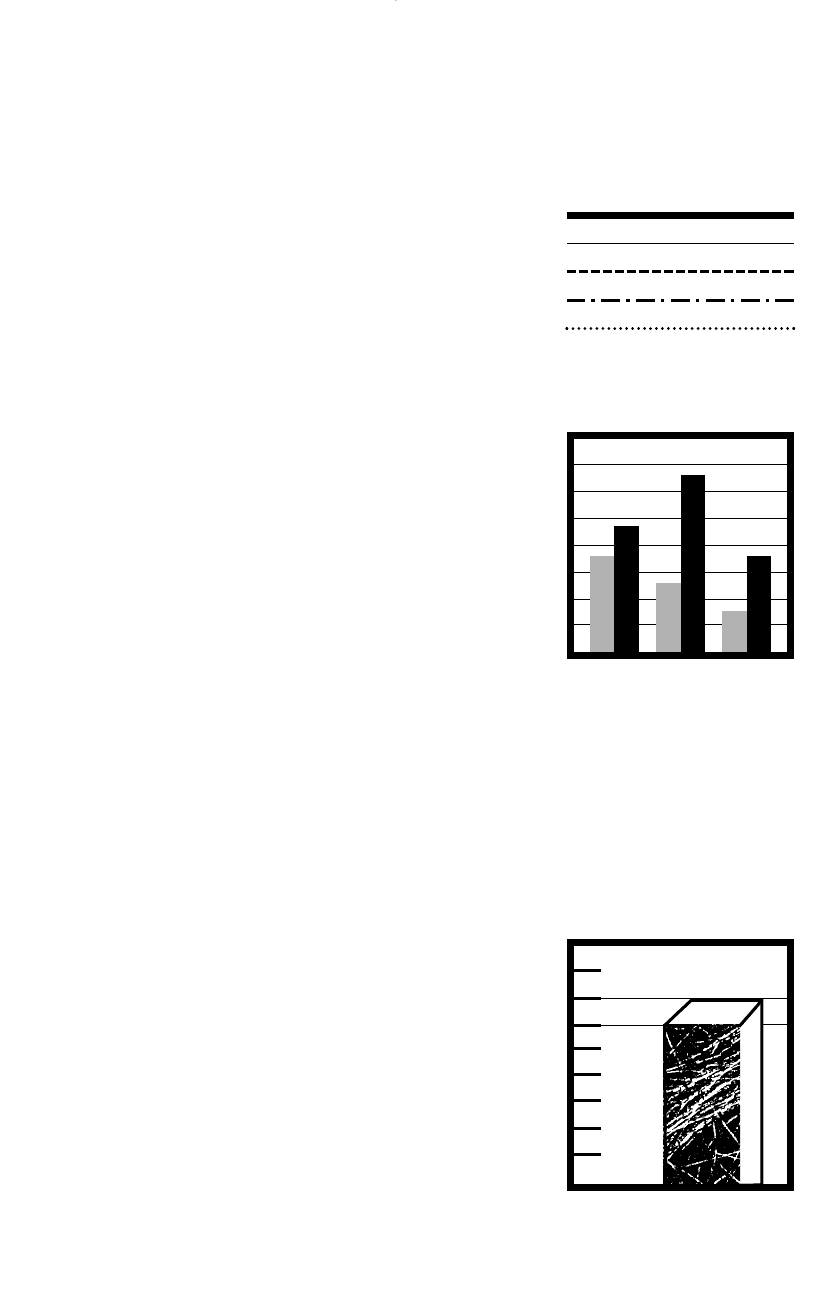
Bar charts
Showing comparisons of quantities, bar charts have a high
recognition of actual figures—particularly if a few well-
chosen rules establish some standard divisions of the
numerical axis.
Sometimes it is desirable to read the exact figures, in
which case each bar is labelled, either centred inside the bar
at its top, or in the space directly above the bar, centred on
the width of the bar.
Subdividing a bar into its component parts can work, but
can also become confusing. It might show the variation in
priorities in funding between different years, but will need
some explanation or discussion in the text because the
reader will not always accurately read the information.
Colour coding and tonal coding of bars works.
Avoid three-dimensional bar charts, because accurate
readability of the actual figures is lost, which is one of the
bar chart’s strengths.
Variations of bar charts, such as horizontal bar charts
and building the height or length of the bar with a pic-
togram that represents what the bar is graphing, provide
opportunities for increasing the visual attraction of the bar
chart. For example, when comparing male and female
participation rates in sports, you could prepare a horizontal
bar chart that moves out from the centre labels with males
moving numerically to the left and females moving to the
right. This would demonstrate any imbalance visually.
3-D graphs
In all graphing styles, it is best to avoid three dimensions.
The third dimension often only confuses the information. A
graph is produced to clarify or put figures into perspective,
to give an idea of trends. Bevelled edges are about as adven-
turous and intrusive as the third dimension needs to get.
Layout 151
?
?
CHECK LIST
Key lines
(Most important to least important)
1 Bold continuous line
2 Fine continuous line
3 Dashed line
4 Dot-dash dotted line
5 Dotted line
3-D confusion ■
where your reader is unsure which
line gives the correct figure.
DWD-DM05 4/5/01 4:08 PM Page 151
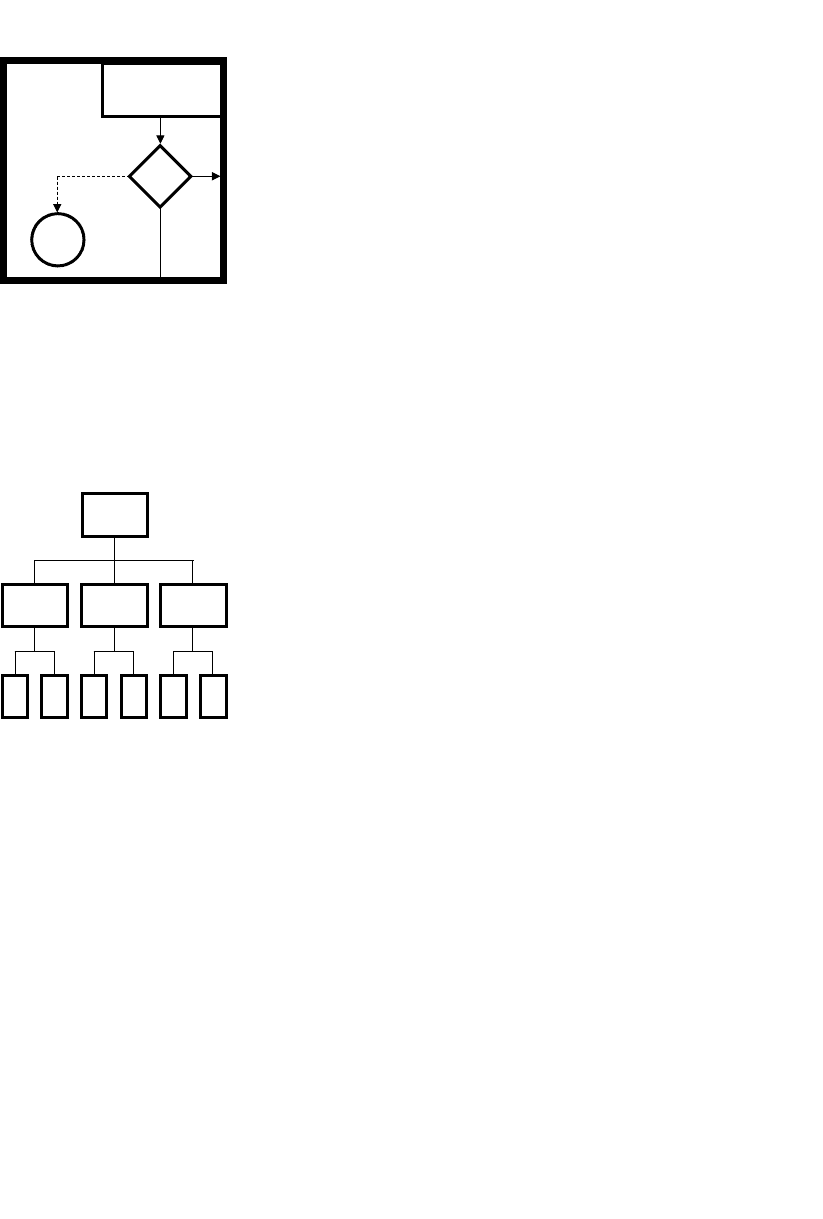
Flow charts
Flow charts show a process in sequence and can be very
effective. They can incorporate optional paths and often use
straightforward graphic symbols like arrows to propel the
reader accurately. Used in manuals and handbooks, they are
often more easy to comprehend than narrative text or
numbered sequences in text. They do not need to use the
original flow-charting coded shapes of diamonds signifying
a choice between optional paths, rectangles for answering
statements, and circles for completion. They do generally
incorporate connecting lines, numbering, arrows and
colour coding as required.
Flow charts are used in the planning of multimedia and
use icons and shapes to indicate which media is used in
which page in the program. Site plans for Web sites are also
often based on the principles of flow charts.
Organisation charts
Hierarchy and connections, lines of authority and areas of
responsibility are often shown in organisation charts. They
are often based on a simplified flow-chart style. Authority is
generally depicted from highest authority at the top to least
authority at the bottom.
Another option which can be successful—particularly
with layered captions, that may indicate a division title,
a name, a position title for each person on the chart—is
to make the authority move from highest authority at the
left to least authority at the right. This can accommodate
alignment of divisions and simplify the fitting of all the
people onto the chart when the lower authority levels
kick in.
Often, designers will centre the text contained within the
blocks of the chart, but there can be problems where there
are disproportionate amounts of information in blocks at
the same level of hierarchy, e.g. where you need to accom-
modate ‘Human resource development’ and ‘Operations’.
Always design the block based on the longest heading but
also consider how the shortest heading will look. Will you
vertically centre each heading in its box or will you align all
top lines? Vertical centring will often make each box look
better, but alignment of the lines usually makes the chart as
a whole look better.
You might try a variation where, using connecting rules
and arrows only, you connect type in columns, avoiding the
need to plan the blocks.
152 Production
DWD-DM05 4/5/01 4:08 PM Page 152
In photographic organisation charts, which are increas-
ingly popular, try to keep the scale of all the heads the same
and the background colour even. This is easy if all the
people portrayed are photographed on the same day, by
the same photographer, against the same background, from
the same distance. But if you are dealing with photographs
supplied by individuals, try to make the distance from the
left of the left eye to the right of the right eye the same
when scaling all the photographs.
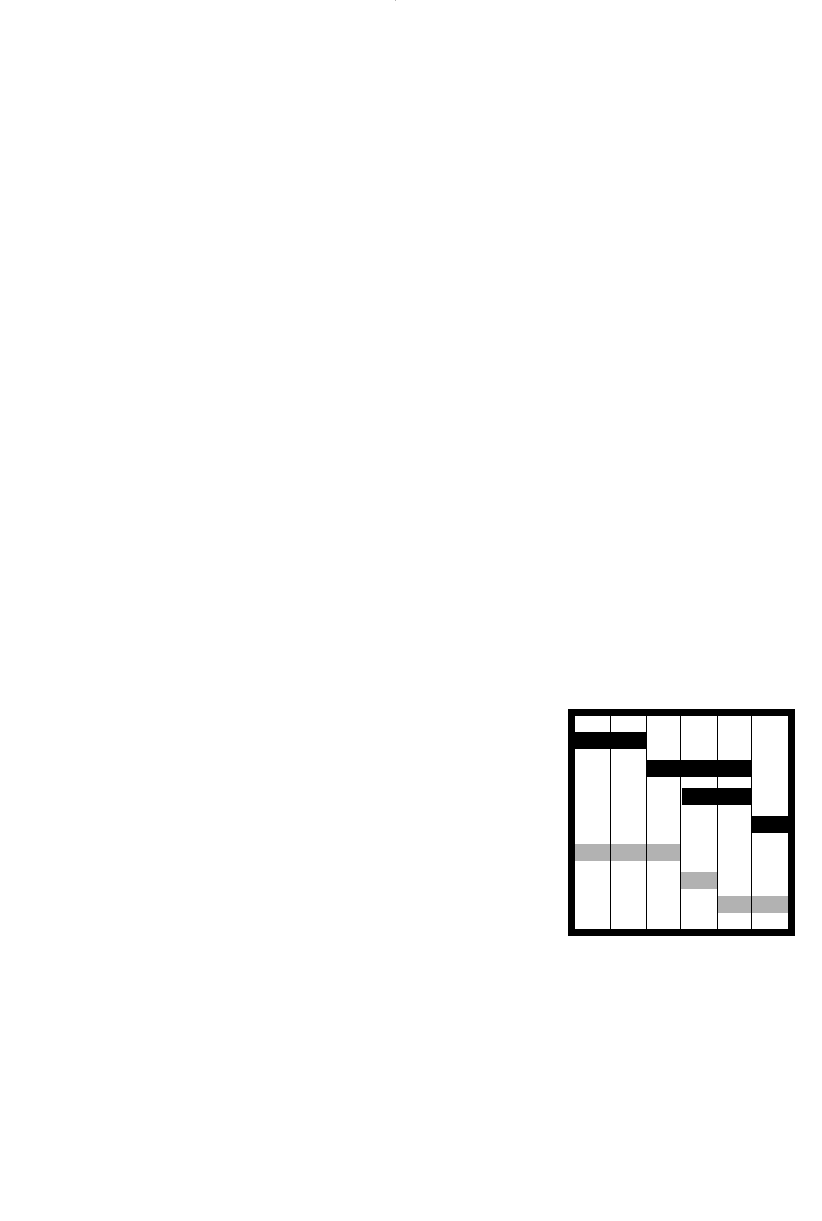
Sequence diagrams
Staged sequences can describe the evolution of the world
or the creation of a publication or how your client’s new
product will get to market. Using a numbered sequence
of pictures or pictograms that describe each step in the
process, a visual representation of the process can clarify a
task for a team, educate a novice in the area, or introduce a
new skill in a logical manner. The sequence will often have
a series of descriptive captions below each of the pictures.
The captioning might also have timeframes allocated.
Time can be represented by a clock face or a digital clock
readout (in the case of, say, a recipe) or by a calendar or
seasonal references for longer processes.
Sequence diagrams are used in project management.
The critical path method is widely used. Time progresses
from the left, where a project starts, to the right, where a
project ends. Horizontal bars represent each of the stages
and can be layered to show concurrent activities.
The program evaluation review technique (PERT)
diagram is similar in principle but uses numerically staged
events and links them with arrows, indicating where two
processes need to culminate before another can begin.
Exploded diagrams
Assembly instructions often ‘explode’ the parts being
assembled and show how they connect and interconnect
with arrows. The assembly is often numbered in sequence
as well. The illustration is often a realistic uncluttered line
drawing in either perspective or axonometric projection.
This style of diagram is used to show the floor plans of
multilevel buildings and even Web site plans, as well as its
more familiar role in model aeroplane construction.
Layout 153
DWD-DM05 4/5/01 4:08 PM Page 153

READ MORE ABOUT IT
Nigel Holmes, Designer’s guide to creating charts and diagrams, Watson-Guptill,
New York, 1991, ISBN 0 8230 1338 3.
Peter Wildbur, Information graphics: A survey of typographic, diagrammatic and
cartographic communication, Trefoil Publications, London, 1989,
ISBN 0 86294 110 5.
Trevor Bounford, Digital diagrams: Effective design and presentation of
statistical information, Cassell & Co., London, 2001, ISBN 0304 354074.
Walter Herdeg (ed.), Graphis diagrams: The graphic visualisation of abstract
data, 4th edn, Graphis Press Corporation, Zurich, 1981, ISBN 3 85709 410 9.
Peter Wildbur and Michael Burke, Information graphics: Innovative solutions in
contemporary design, Thames & Hudson, London, 1998, ISBN 0 500 01872 3.
Paul Mijksenaar and Piet Westendorp, Open here: The art of instructional
design, Thames & Hudson, London, 1999, ISBN 0 500 28170 X.
Molly W. Joss, Looking good in presentations, 3rd edn, Coriolis, Scottsdale,
Arizona, 1999, ISBN 1 56604 854 0.
Tim Harrower, The newspaper designer’s handbook, 4th edn, McGraw-Hill,
Blacklick, Ohio, 1998, ISBN 0 697 32720 5.
Harry Mills, Artful persuasion: How to command attention, change minds and
influence people, MG Press, Sumner Park, Queensland, 1999,
ISBN 0 908722 91 5.
154 Production
DOING IT SMARTER
Animating or staging
diagrams, graphs and charts
In Web sites, television and
multimedia, diagrams, graphs and
charts need to move. In bar charts,
the bars can grow; in line graphs, the
line can travel its course; pie charts
can spin. But diagrams and processes
often need more attention. The chart
will have been broken into stages or
sections or modules, so focus on
building each module and then
integrating in the full chart. In this
way, you might have a simple
structure that takes you to a further
level of detail when you click on an
element. Readers can create their
own path through the information,
much like they do with a site.
Don’t forget to use the animation
techniques and 2-D movement
techniques to help the diagram
maintain attention on screen.
You might develop a character that
will guide the reader through the
information. You might incorporate
sounds and video of the process.
With virtual reality (VR), readers
can be walked through a museum
or trade show on screen without
having to read a map in the
traditional manner.
DWD-DM05 4/5/01 4:08 PM Page 154
Contrast
Contrast can be the most powerful technique used in a
layout, particularly contrasting:
r scale (size variation)
r tone (dark against light) and/or colour
r texture.
Contrast is an overriding design element. So much of
the success of a layout is to do with effective deployment of
contrasts, such as using contrasting typefaces, images and
groupings of elements. This is one of the most useful
design techniques.
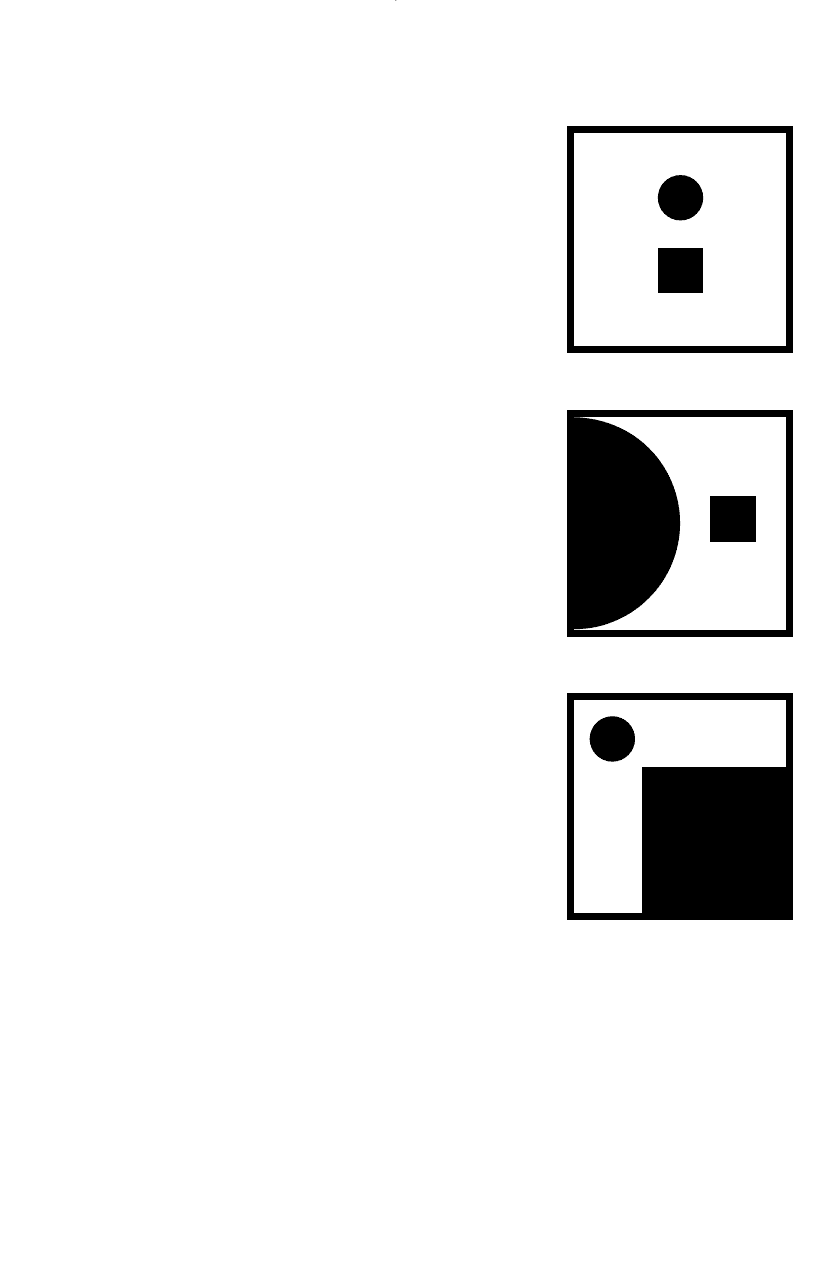
Scale
The interaction of shapes with one another can be dynamic
if you contrast the size of various elements. This is the basis
of the design principle called ‘scale’. The scaling of
elements can have a distinct effect on your message.
Contrasting scale is the single most useful technique for
improving a layout that is not working. Making one
element larger and reducing the other elements to sub-
servient roles will always help a boring layout by adding
implied dimensionality.
Tone
Light or dark. Positive or negative. White or black. In black
and white (or any other single-colour work—the black is a
single colour printed on a white paper), you always have
three colour options: the colour of the paper (white); the
colour of the ink (black) and tones of the ink colour (greys)
created by reducing the solid colour to a halftone or stipple.
To create an interesting tonal layout, identify the tonal
average of your photos and text blocks. You do this naturally
when you are deciding to reverse a headline or caption out
of a photo—or whether you’ll just overprint the image. If
you can reverse out comfortably, it is a dark photograph; if
you will need to overprint, it is a light photograph.
Boring layouts are layouts where everything reduces to a
grey soup. You need the interplay of dark areas and light
areas to interest the eye. Illustrations and photographs will
reduce to an average tonality. Night shots usually have an
overall dark tone. Shots of the Sydney Opera House at
midday usually have an overall light tone.
Layout 155
Contrasting scale ■
A layout with two elements is often
made more dynamic by altering their
scale (or their size relationship).
DWD-DM05 4/5/01 4:08 PM Page 155

But look at an alpine tourist brochure. The snow and sky
will probably reduce to light, but the forests will usually
reduce to very dark. With such well-defined contrasts in a
single photograph, consider the picture area not as a
rectangle filled with a mid-grey (an average of those two
areas) but as an abstract pattern of light and dark. When
you crop the photo, decide how the light and dark areas of
the illustration will work in your layout. Do the lights and
darks set up directions within the illustration? Can you use
the directions they set up to lead to another layout element?
Typecolour
You can alter the tonal value of type (referred to as its
‘typecolour’) by creating bolder text or using a chunkier
typeface, which gives a darker tone to the text block. Usually
body text has a light-grey tone. Leading and tracking also
affect typecolour. If there is more space between the lines
or the letters, more of the background colour can be seen,
which, if it is white, makes the text block appear lighter.
You can check their tone by squinting at the elements—
the famous ‘squint test’.
Contrast the tone of text blocks with the tone of other
text blocks or illustration areas.
Typecolour also helps define the shape of a text block.
Usually text falls into vertical strips—light-grey rectangles.
However, when you contour your type around an illus-
tration or centre the text, you are dealing with different
light-grey shapes in your layout.
Repetition, pattern and texture
Repetition creates logic within a design. It is the technique
behind the principle of consistency in a publication.
You repeat text attributes to enable clear communication
of a hierarchy of information. You might prepare your style
sheet in order to consistently present particular information
in specified type treatments. You can repeat a style or
technique of illustration for unity. You might repeat a
particular set of colours or specific textures to bring
continuity to the job. Sometimes, repetition of line width
around headings or as photograph borders is enough to
identify that a particular design has come from a particular
company. Even repetition of a particular scale relationship
between two pictures in each of a series of advertisements
can create a recognisable style.
156 Production
DWD-DM05 4/5/01 4:08 PM Page 156
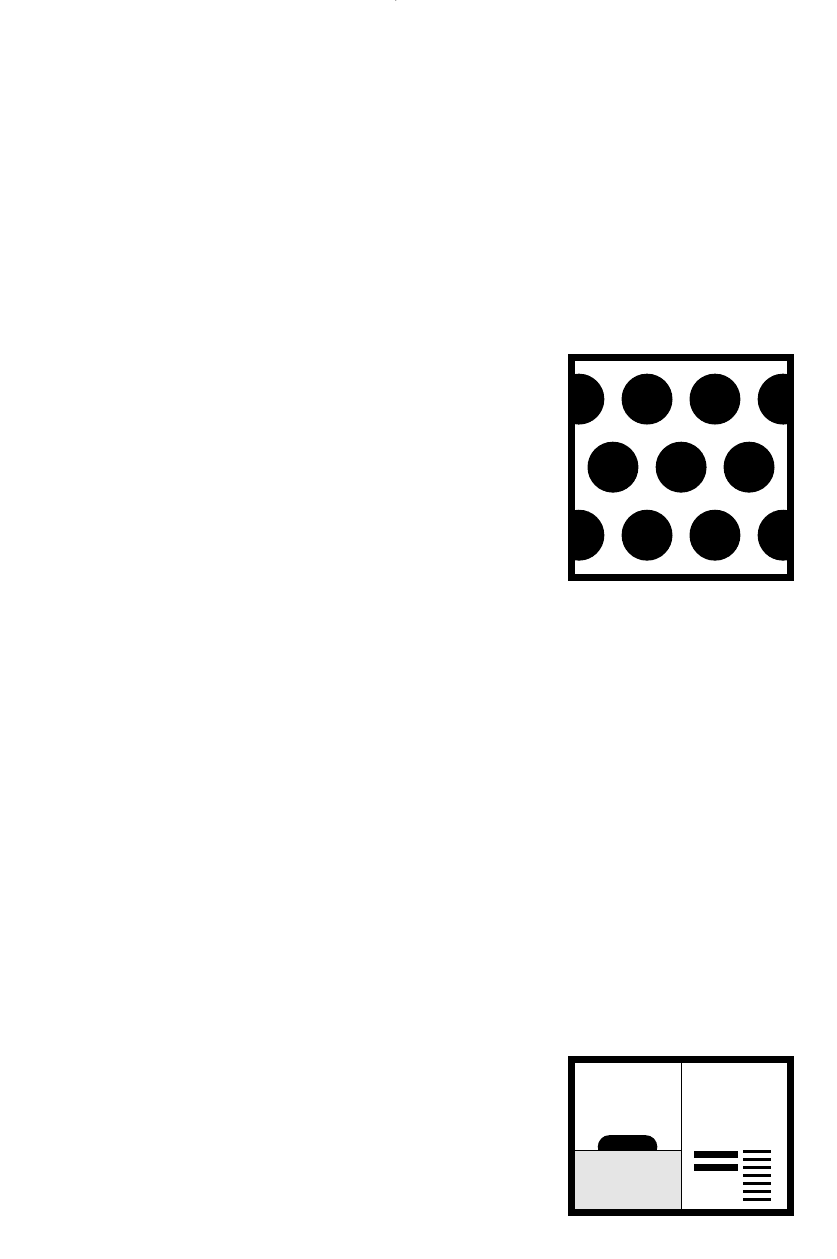
But repetition of a visual element can also create texture
and pattern. It can be ordered repetition of recognisable
elements creating a pattern or random repetition of an
abstract unit creating a texture. In pattern formation, you
can create a pattern with photographs, illustration or type.
The complexity of the pattern depends on the sequence you
develop in order to repeat the original image. You may
choose a small element simply duplicated in a line, then
duplicate the line and place it underneath, continuing the
duplication until the desired pattern exists. You might
duplicate and flop or turn the original image to create a
more complex sequence.
Creating patterns
A pattern can be created when you repeat anything.
‘Anything’ means illustrations, photographs (or bits of
illustrations and photographs), type, punctuation marks
(spaced lines of tabbed full stops will create a background
pattern) and, of course, ‘anything’ includes dingbats. All
those little stars and snowflakes, ticks and crosses, leaves
and flowers, squares, triangles, circles and diamonds, can
be used individually or in groups to create a multitude
of patterns.
The pattern can be a simple, repeated symbol that
makes a border or rule. It can then be copied and repeated
in tightly leaded lines to create a security background
for cheques.
Direction
Many shapes also imply a direction. For example, triangles
tend to point somewhere. Rectangles tend to have a vertical
(downward if it’s a text block—because we read down) or
horizontal (pointing to the right if it’s a short text block—
because we read across) stress. Only squares and circles
are static.
Think of the classic photo of Uluru—horizons that seem
to stretch forever from the central monolith. This is
establishing a really powerful horizontal line within your
layout. You can use that line and mimic it with, say, a long
thin headline or a number of horizontal layout elements.
Alternatively, you can use the contrast of strong vertical
elements (text blocks, rules and other illustrations).
Layout 157
e e e
e e e
e e e
DWD-DM05 4/5/01 4:08 PM Page 157
Borders and rules
Borders and rules should largely be avoided, as they are
text distractions and can break the flow of information.
However, they can help establish an old-fashioned feel or
help organise material in complex spreads.
There are many decorative and illustrated borders and
rules that can recreate the feel of early Australian theatre
and ‘Wanted’ posters, country catalogues and Edwardian
concert programs.
When using rules, it is important to remember that they
are separation devices, so they will create the impression
that material between them is linked. Bold or strong rules
are used as section dividers; lighter rules separate within a
category. Rules can separate information layers in tables,
contents lists, indexes and even in multideck headings, but
this separation can be achieved more efficiently with
spacing and type attributes.
In lists, rules might be used to separate items, but note
that the placement of a bold rule is above a bold heading to
visually keep the heading with the text that follows it. When
creating the style sheet for this sort of rule, specify the rules
as ‘rule above’ each level of information.
There is little place for rules in layout—they are more an
affectation of styling. Similarly, boxes are more usually
achieved with colour change than with borders. Borderless
tinted boxes or boxes and photographs with fine (0.25
point) ruled borders are less intrusive.
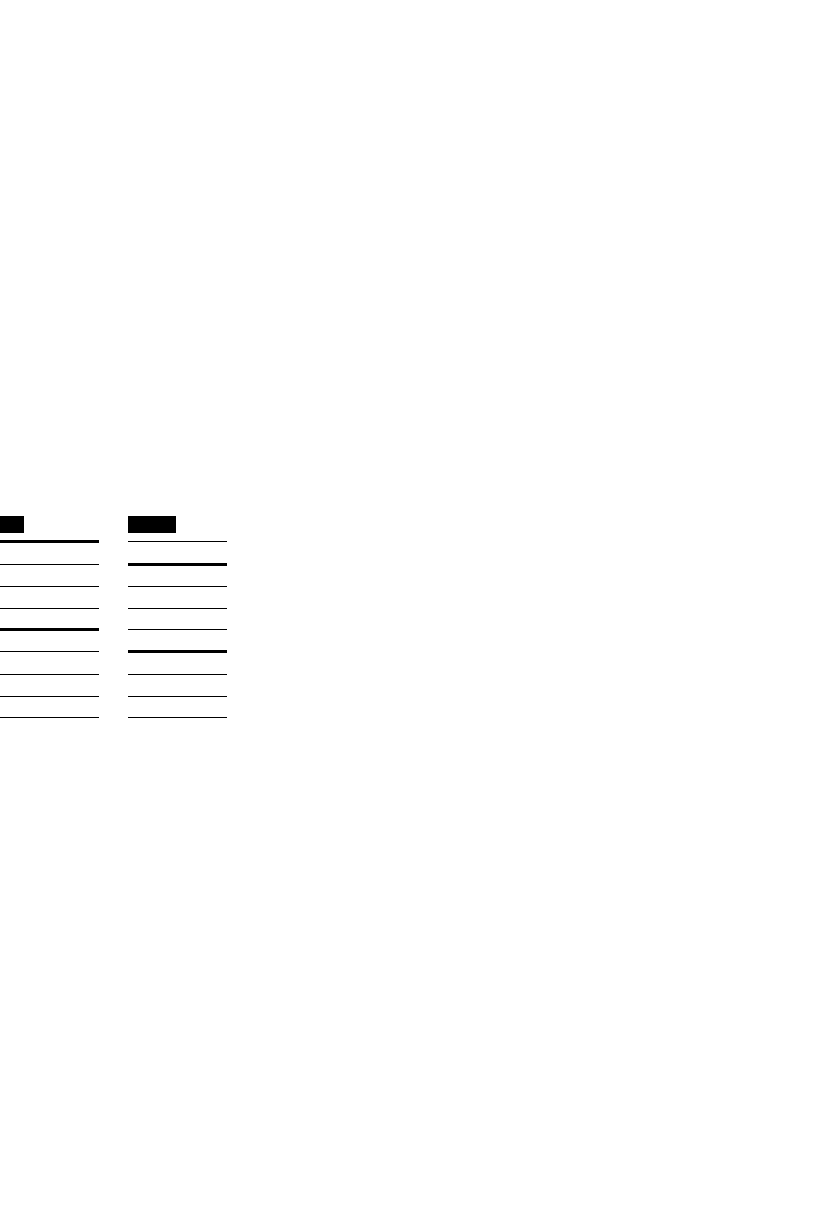
Space and pace
In a layout, balance is determined by placement of design
elements within space. Many people are frightened of
‘gaping holes’ in the layout, but space is an incredibly
forgiving design element—it is truly your friend.
If you have been found guilty of leaving space in a
layout, you may well have been told that it is ‘wasted’. It
rarely is. Space is a dynamic layout element. It can guide
the reader’s eye through a page. Space is essential for
accentuating the dynamics of scale and contrast, and
provides a resting place within a layout. It can provide an
area of calm in a dynamic design, which serves to heighten
the dynamism, because you create a greater contrast
between the busy and the relaxed, the fast and the slow, the
loud and the soft.
158 Production
DO DON’T
Vegetables
Asparagus
Broccoli
Carrot
Fruit
Apple
Banana
Cherry
Vegetables
Asparagus
Broccoli
Carrot
Fruit
Apple
Banana
Cherry
DWD-DM05 4/5/01 4:08 PM Page 158

Space—an area without a picture or text, but occasion-
ally with a background colour or even a faint texture—can
‘balance’ a difficult design. Space is used to separate levels
of information, highlight and support a heading hierarchy,
and as rest area for the eyes.
The more space around a heading, the more importance
the heading will assume. It is possible to set a heading in
type smaller than the text of a story. If the heading is given
a large area of space in which to float, it will be read first.
You may have seen a ‘blank’, full-page newspaper advertise-
ment that has only a small text area like a classified ad
floating in the centre. Bet you read it!
In publication design, layouts with generous space
provide a marked contrast to layouts where the page is filled
with text and images.
In Web site design, to avoid having the reader scrolling
through empty layouts, there is a tendency to fill all the
screens, but this can have an adverse effect. Readers can
become tired of the site and exit prematurely. Build the
experience by pacing its delights. Document design is
entertainment design—even more so in electronic docu-
ments with sound, movement and interactivity.
Predominantly ‘white’, or empty, layouts contrast well
with busy layouts. This contrast—achieved partly through
the distribution of space between stories—is one of the
determinants of the ‘pace’ of the document. Pace in
documents is best understood using the metaphor of a
stage musical. Start with an overture. In a Web site, this is
the splash screen or entry sequence. In a book, it is the
cover, endpapers and maybe a frontispiece.
Audience members might read the program. In a Web
site, this is the home page and site plan. In print, this is the
contents list.
Then the show starts. It contains a series of big produc-
tion numbers, separated by smaller numbers, ballads, duets
and dialogue scenes that bring a rhythmic structure to the
whole. The Web site, then, has major sections, multimedia-
heavy scenes and text-only documents, small specialist
sections and brief updates; video, sound, animation, text
and graphics. The book has colour sections, heavily
illustrated parts and sparsely illustrated parts, appendixes
and even inserts; text, images and graphics.
Layout 159
‘Build a book like a body moving in
space and time, like a dynamic relief
in which every page is a surface
carrying shapes, and every turn of a
page a new crossing to a new stage
of a single structure.’
El Lissitsky quoted by
Lewis Blackwell in
20th Century Type: Remix
I’m
the
smallest
type
on
this
page:
bet
I
got
your
attention!
DWD-DM05 4/5/01 4:08 PM Page 159

There could be an intermission. In a Web site, this
might be a community forum or chat line. In a book, this
might be a part title, chapter or part summaries, or a full-
bleed, double-page photo.
At the end of the show, there are the curtain calls,
leaving the theatre and buying the souvenir T-shirt. In a
Web site, there is the exit sequence, the credits and
copyright information, the visitor registration form and the
on-line shop. In a book, there is the conclusion, the
colophon that describes production technicalities, the verso
title and acknowledgments that list the production person-
nel, and sometimes an order form or registration card for
catalogues from the publisher in the same subject area.
In theatre, comedy is placed to heighten—or lighten—
tragedy. The juxtaposition of contrasting elements is equally
effective as an entertainer or ‘pacer’ in document design,
too. In magazines, the ‘songs, scenes and choruses’ are
replaced with regular columns, news items and feature
articles respectively; articles can be light or serious, text or
picture spreads. Feature articles often use different layout
devices to achieve an identity of their own, and the deploy-
ment of space is one of those devices.
In some publications, margins and chapter breaks are
the only rest area. In novels, this is fine. In newspapers, it is
probably fine. In magazines, it is unwise. Rest areas, as they
are on highways, exist for a reason. If you are tired—and
you can be visually tired—you should stop and rest.
Advertisers and publishers do not want you to close the
magazine; they want you to continue on your journey—so
rest areas should be provided. Some articles provide this
service. Sometimes, full-page or double-spread, full-bleed
pictures can do it. Sometimes, just having a bit of extra
space in a layout is enough.
If in doubt, rely on space—large, empty, clean space. It
can bind disparate elements together and help stylistically
different combinations sit comfortably within reach of each
other. Space also contrasts texturally and tonally with the
elements of your layout because it is usually white and gives
your layout the highlight area for that important tonal
range. So do not underestimate the importance of some
‘empty’ areas in a layout.
160 Production
According to Karel van der Waarde in
Visual Information for Everyday Use,
readers assume relationships
between different graphic
components based on their:
Proximity
q Physical proximity implies an
informational connection.
q Physical separation implies an
informational separation.
Similarity
q Similarity implies a functional
connection.
q Difference implies a functional
differentiation.
Prominence
q Prominence differences imply
hierarchical (status) differences.
Sequence
q The visual sequence implies the
sequence of information.
DWD-DM05 4/5/01 4:08 PM Page 160