Ambaum M., Thermal Physics of the Atmosphere
Подождите немного. Документ загружается.

228 APPENDIX C THERMODYNAMIC DIAGRAMS
T
s
p = constant
bottom of
tephigram
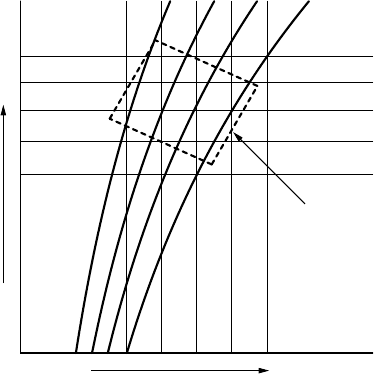
FIGURE C.1 The dashed rectangle illustrates the location of a typical atmospheric tephi-
gram on a Ts diagram. The solid black lines represent isolines of the pressure. The rotation
is such that the 1000 hPa pressure isoline is quasi horizontal, close to the bottom of the
tephigram. The thin lines represent isolines of temperature and potential temperature,
respectively.
rotation is chosen so as to make the isolines of pressure quasi-horizontal, see
Figure C.2a. The surface pressure is near the bottom of the tephigram and
upper tropospheric pressures are near the top.
The coordinate axes of the tephigram are most easily defined as
x = T
0
s + c
p
T, (C.2a)
y = T
0
s − c
p
T, (C.2b)
with T
0
a relevant reference temperature and c
p
the ideal gas heat capac-
ity. With this transformation, on lines parallel to the x-axis, defined by dy = 0,
the temperature and entropy satisfy
T
0
ds = c
p
dT. (C.3)
But according to Eq. 3.40 this is the differential of s for an ideal gas at constant
p and when the temperature is T
0
. In other words, isolines of pressure are
horizontal in the tephigram when the temperature is T
0
. Another advantage
of this mapping is that at fixed temperature the y-coordinate is linear in
ln (p
0
/p), with p
0
a reference pressure. So to a good degree of accuracy, the
y-coordinate corresponds to the geometric height of a parcel.
The skewT–logp diagram is strictly speaking only a thermodynamic di-
agram for ideal gases. A skewT–logp diagram is located similarly on a Ts
diagram as a tephigram but it introduces an additional deformation to the
rectangle so as to make the pressure isolines straight and parallel to the
APPENDIX C THERMODYNAMIC DIAGRAMS 229
(a) (b)
(c) (d)
(e) (f )
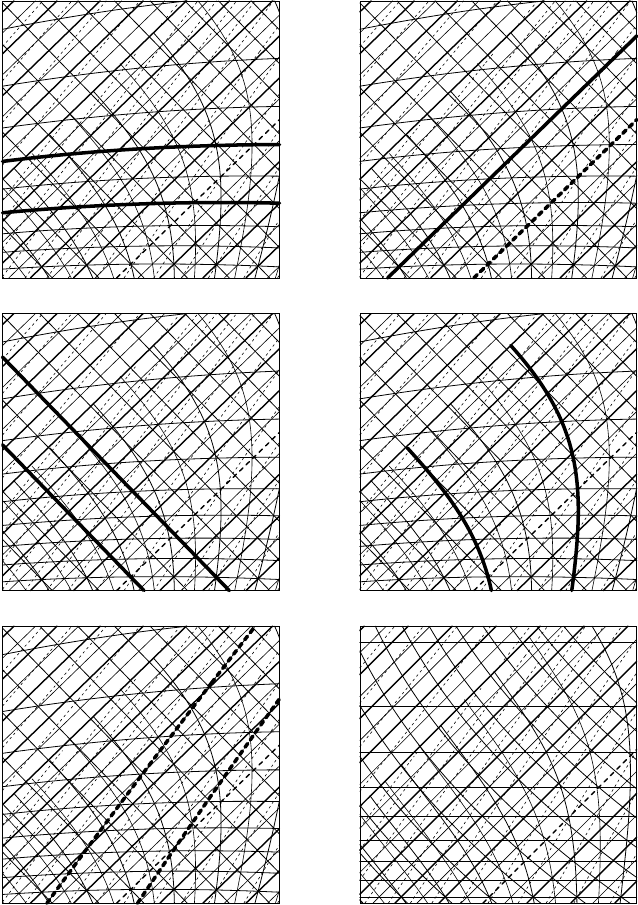
FIGURE C.2 Tephigrams with the bold lines highlighting isolines of (a) pressure, (b) tem-
perature (0
◦
C dashed), (c) potential temperature, (d) equivalent potential temperature,
and (e) saturated water vapour mixing ratio. Panel (f) shows a skewT–logp diagram with
the corresponding isolines.

230 APPENDIX C THERMODYNAMIC DIAGRAMS
horizontal boundaries of the deformed rectangle. The coordinate axes on a
skewT–logp diagram are defined as
x = T/ T
0
+ ln (p
0
/p), (C.4a)
y = ln (p
0
/p), (C.4b)
with T
0
a fixed reference temperature which determines the skew of different
isolines in the diagram and p
0
a reference pressure. Lines parallel to the x-axis,
defined by dy = 0, are isolines of pressure. Also, to a good degree of accuracy,
the y-coordinate is proportional to the geometric height of a parcel. We can
now see that for an ideal gas
x dy =
v dp
RT
0
+ ln (p
0
/p)
dp
p
. (C.5)
Any integral over a closed cycle in the xy plane of the second term on the right-
hand side will vanish because it is a function of p alone. Thus the integral
over a closed cycle in the xy plane (that is, on a skewT–logp diagram) will
be proportional to the work performed on an ideal gas parcel (the contour
integral of v dp equals the contour integral of −p dv).
Tephigrams and skewT–logp diagrams look fairly similar, see Fig C.2, and
can be used interchangeably. In tephigrams, entropy isolines are straight and
pressure isolines are curved; in skewT–logp diagrams this is the other way
around.
The isolines of specific entropy are by definition the dry adiabats; in a
tephigram the isolines of specific entropy are normally labelled by their po-
tential temperature, with the potential temperature corresponding to the ac-
tual temperature at the reference level of p
0
= 1000 hPa. The dry adiabats
are highlighted in Figure C.2c.
We can use Eq. 6.12 to calculate the location of the pseudo-adiabats. These
then produce a set of curved isolines on the tephigram, see Fig-
ure C.2d. Pseudo-adiabats are isolines of saturated pseudo-equivalent poten-
tial temperature
e
.
69
The pseudo-adiabats are labeled with the wet-bulb po-
tential temperature,
w
, which is the temperature where the pseudo-adiabat
crosses the reference pressure level of p
0
.
Tephigrams furthermore show isolines of saturated mixing ratio r
vs
, see
Figure C.2e.
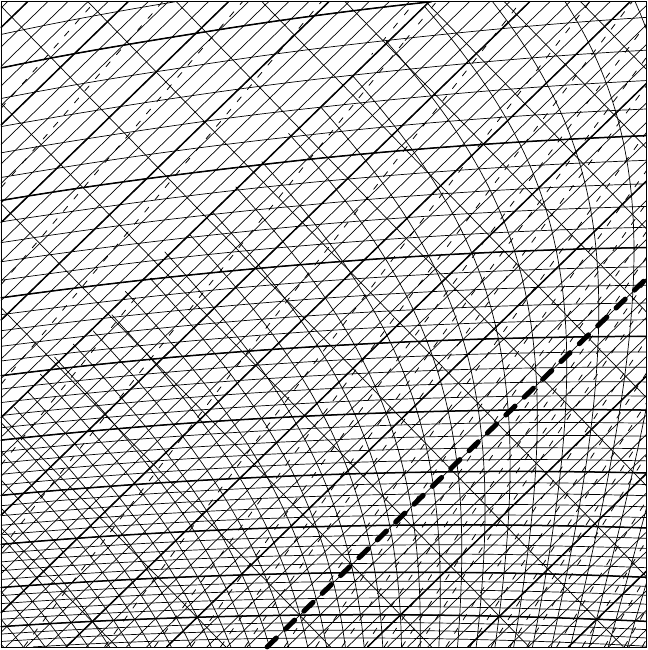
Figure C.3 shows a larger scale tephigram with all the isolines labeled.
So a tephigram or a skewT–logp diagram shows isolines of: temperature
T (isotherms), pressure p (isobars), potential temperature (dry adiabats),
pseudo-equivalent potential temperature
e
(pseudo-adiabats), and saturated
water vapour mixing ratio r
vs
. Tephigrams usually show several kinds of ad-
69
Accurate equations used to construct pseudo-adiabats are given in Bolton, D. (1980)
Mon. Wea. Rev. 108, 1046–1053.
APPENDIX C THERMODYNAMIC DIAGRAMS 231
ditional information, but the above set of five isolines form the basis of any
tephigram or its variants.
The real power of a tephigram is that it can be used to perform calculations
graphically. As explained in Chapter 6, the calculation of, for example, the
lifting condensation level or the convective available potential energy can be
straightforwardly performed using a tephigram. In this sense a tephigram is
a nomogram, a graphical calculation chart.
0.5
0.2
0.1
3
6
9
10
18
20
24
28
36
32
16
14
12
8
7
5
4
2
1.5
1
0.001
0.03
0.1
0.01
0.003
200
300
400
500
600
700
800
900
1000
-10
10
0
20
30
40
60
70
80
90
50
-60
-30
-40
-50
-70
-80
FIGURE C.3 A blank tephigram. Pressures are in hPa, temperatures in
◦
C, and mixing
ratios in g kg
−1
.

Appendix D
Relationship between energy
density and energy flux
Following the arguments leading to Eq. 1.11, we can deduce that the number
of particles N with positive velocity U hitting the wall per unit time and per
unit area equals
N
U
=
˜
n
U
U , (D.1)
with
˜
n
U
dU the volumetric number density of particles with x velocity be-
tween U and U +dU . Integrating this equation over positive U we find the
total number of particles N hitting the wall per unit time and per unit area,
N =
U >0
˜
n
U
U dU . (D.2)
We can write the particle density
˜
n
U
in terms of the particle density
˜
n
U
of
particles with vector velocity U if we integrate out the dependence on the
other velocity components, V and W ,
˜
n
U
=
˜
n
U
dV dW . (D.3)
We can now write N as
N =
1
2
˜
n
U
|U |dU dV dW , (D.4)
where the absolute value function allows us to include negative U and the
resulting double counting is compensated by the factor 1/2. The particle
density is a function only of particle speed, say C =|U|, not its direction. We
therefore find
N =
1
2
∞
0
˜
n
C
|U |
C
dC, (D.5)
233
Thermal Physics of the Atmosphere Maarten H. P. Ambaum
© 2010 John Wiley & Sons, Ltd. ISBN: 978-0-470-74515-1

234 RELATIONSHIP BETWEEN ENERGY DENSITY AND ENERGY FLUX
where |U |
C
is the average of |U |if the total speed is C. On geometric grounds
it follows that
|U |
C
= C/2 (D.6)
(this is equivalent to the statement that the average z coordinate of a hemi-
spherical dome on the xy-plane equals z=1/2) and we conclude that
N =
1
2
∞
0
˜
n
C
C
2
dC =
1
4
˜
nC. (D.7)
If the particles carry an average energy e, then the above equation can be
used to relate the volumetric energy
˜
u = e
˜
n to the total energy flux J
u
.We
find
I J
u
=
1
4
˜
uC. (D.8)
This relationship is used to find a relationship between the energy density
and energy flux for the thermal radiation field where all the particles, the
photons, have speed c.

Index
absorption, 180
absorptivity, 166
accretion, 151
activation, 136
activation radius, 132
added mass, 80, 123
adiabatic process, 27
affinity of vaporization, 211
aggregation, 151
air
composition of, 11
heat capacity of, 47
parcel, 6
albedo, 176
availability, 223
Avogadro number, 2
barometric distribution, 84
Beer–Lambert law, 180
Bergeron–Findeisen process, 99, 151
Bernoulli equation, 81, 207
black body, 166
boiling point
definition, 97
elevation, 161
Boltzmann constant, 6
Boltzmann factor, 84
Bowen ratio, 59
Boyle’s law, 9
Brunt–V
¨
ais
¨
al
¨
a frequency, 79
buoyancy, 77
frequency, 79
capacitance, 150
capillary pressure, 23, 130
carbon dioxide, 11
Celsius, unit, 2
charging work, 20
Charles’s law, 9
chemical potential, 153
Clausius’ postulate, 27
Clausius–Clapeyron equation, 94
cloud radar, 185
collection efficiency, 149
colligative properties, 162
collision and coalescence, 148
coloured body, 166
compressibility, 64
continuity equation, 204
convective available potential
energy, 121
convective inhibition, 122
critical supersaturation, 134
Dalton’s law, 11
and water vapour, 97
degrees of freedom, 6
and heat capacity, 47
dewpoint temperature, 101
from Normand’s construction,
119
diabatic, 27
differential, 221
diffusion coefficient, 141
diffusional drop growth, 141
dissipation, 18, 24
viscous, 208
drop growth
by collision and coalescence, 148
by diffusion, 141
dry adiabatic lapse rate, 76
dry static energy, 81
235
Thermal Physics of the Atmosphere Maarten H. P. Ambaum
© 2010 John Wiley & Sons, Ltd. ISBN: 978-0-470-74515-1
236 INDEX
efficiency, 37, 214
electrostatic energy, 137
emissivity, 166
energy
conversion, 206
density, 22
flux and density, 233
internal, 21, 40
budget equation for, 205
kinetic, 204
potential, 67
budget equation for, 206
enthalpy, 41
and hydrostatic balance, 70
flux, 57
and radiative–convective
equilibrium, 188
for moist air, 104
generalized, 81
in open systems, 53
of fusion, 57, 161
of sublimation, 57
of vaporization, 55
entrainment, 80, 123
entropy, 23
Boltzmann formulation, 27, 36
for moist air, 112
Gibbs formulation, 91
information, 33
of ideal gas, 49
of ideal solution, 158
of liquids and solids, 64
of mixing, 156
of radiation, 193
potential temperature, 60
production, 213
in the climate system, 215
maximum, 219
minimum, 212
pseudo, 113
equation of state, 9
of ideal gas, 8
of photon gas, 192
of saturated air, 110
Van der Waal’s equation, 50
equipartition theorem, 6, 21
derivation, 88
for macroscopic fluctuations, 33
generalized, 89
evaporation, 55, 59
of drops, 145
exergy, 43, 223
exosphere, 5
expansivity, 61
extensive variable, 3
Boltzmann entropy, 29
F
¨
ohn effect, 77
Fahrenheit, unit, 2
Fick’s law, 141
flow work, 54, 70, 82
flux, 55
diffusive, 141
latent heat, 59
sensible heat, 58
turbulent, 57
free energy
see Helmholtz free energy, 42
free expansion, 27
freezing point depression, 161
friction, 18, 25
gas constant
specific, 8
universal, 8
Gay–Lussac’s law, 9
general circulation, 176
generalized coordinates, 88
generalized force, 20
geopotential, 67
effective, 69
height, 68
geopotential thickness, 74
Gibbs function, 42
and charge, 137
and surface tension, 127
for coexisting phases, 56, 94
for compound substances, 153
Gibbs’ phase rule, 3
gravity, 67
effective, 69
gravity waves, 80
greenhouse effect, 171, 188
enhanced, 173
runaway, 174
greenhouse gases, 173
grey body, 166
Guoy–Stodola theorem, 215, 225
INDEX 237
haze, 135
heat, 21, 44
uncompensated, 25
heat capacity, 30, 44
of ideal gas, 47
of liquids and solids, 46
of saturated air, 111
of water, 63
heat conduction, 143
Helmholtz free energy, 42, 50
in statistical mechanics, 88
hole clouds, 151
humidity variables, 100
hydrostatic balance, 69
in isentropic coordinates, 83
hydrostatic equation, 70
hypsometric equation, 74
ice crystals, 150
ice–albedo feedback, 175
ideal gas, 1
chemical potential of, 156
entropy of, 49
equation of state, 8
heat capacity of, 47
mixtures, 10, 155
potential temperature of, 61
ideal solution, 131, 157
chemical potential of, 158
implicit function theorem, 221
insolation, 175
absorbed, 176
instability
conditional, 116
parcel, 79
potential/convective, 116
intensity, 177
intensive variable, 3
internal energy, 21, 40
irreversibility, 26
due to precipitation, 211
isentropic coordinates, 82
isentropic process, 27
isotropic radiation, 178
Joule expansion, 27
Joule’s law, 48
Joule, unit, 17
K
¨
ohler theory, 132
Kelvin effect, 125
Kelvin radius, 129
Kelvin, unit, 2
Kirchhoff’s equation, 56
Kirchhoff’s law, 165
Lagrangian derivative, 203
Langley’s method, 183
lapse rate, 72
adiabatic, 74
of moist air, 109
dry adiabatic, 76
in radiative–convective
equilibrium, 187
moist-adiabatic, 110
pseudo-adiabatic, 111
latent heat, 55
flux, 59
Legendre transform, 41
level of free convection, 115
lifting condensation level, 115
long-wave radiation, 169
Mach number, 91
Maxwell distribution, 86
Maxwell relations, 43, 222
mean field method, 53
mean free path, 5
meridional heat transport, 178, 216
mesosphere, 4
Mie scattering, 185
millibar, unit, 3
mixing clouds, 107
mixing ratio, 100
mixtures, 153
moist static energy, 59, 104
molality, 163
molar mass, 2
Montgomery function, 82
nomogram, 2, 13, 231
non-equilibrium processes, 203
Normand’s construction, 119
nucleation
charge enhanced, 137
heterogeneous, 131
homogeneous, 125
open systems, 53
optical depth, 180
238 INDEX
ozone layer, 5
radiative effects of, 190
partition function, 87
Pascal, unit, 3
photon gas, 191
Planck law, 167
derivation, 195
Poisson equations, 62
potential temperature, 60
equivalent, 114
of ideal gas, 61
pseudo-equivalent, 114
virtual, 78
wet-bulb, 115
pressure, 7
as energy density, 22
capillary, 23, 130
charge induced, 138
partial, 11
vapour, 97
pressure broadening, 181
Prigogine theorem, 212
psychrometer, 102
psychrometric chart, 104
psychrometric equation, 102, 106
psychrometric table, 103
radiation, 165
radiative convective equilibrium, 185
radiative transfer, 180
Raoult’s law, 131, 158
Rayleigh radius, 139
Rayleigh scattering, 185
Rayleigh–Jeans law, 199
reciprocal theorem, 222
reciprocity theorem, 222
relative humidity, 101
over a solution, 159
reversibility, 27, 34
Sackur–Tetrode equation, 47, 49
Sandstr
¨
om theorem, 207
saturation ratio, 128, 132, 138
critical, 132
scale height, 72
scattering, 185
Schwarzschild equation, 183, 186
sensible heat flux, 58
short-wave radiation, 169
SI units, 2
simple substance, 3, 39
skewT–logp diagram, 117, 227
solar constant, 170
solutions, 153
soundspeed, 50, 64
specific humidity, 14, 100
specific variable, 5
budget equation for, 203
specific volume, 5
Standard Atmosphere, 72
state variable, 20
statistical mechanics, 84
role of free energy, 42
steam, 93
Stefan–Boltzmann law, 168
thermodynamic derivation, 192
Stirling engine, 36
Stirling’s approximation, 35
stratosphere, 4, 84
radiative effects on, 190
surface tension, 19, 125
temperature, 6
bolometric/radiation, 171
critical, 94
dewpoint, 101
total air temperature, 91
virtual, 14, 71
wet bulb, 101
tephigram, 117, 227
terminal velocity, 149
Teten’s formula, 98
thermal radiation, 165
thermal wavelength, 168
thermalization, 9
thermodynamic
diagram, 117, 227
equilibrium, 33, 36
local equilibrium, 5, 9
potentials, 39, 225
stability, 223
variable, 3
thermodynamics
first law of, 21
laws of, 17
of climate, 215
second law of, 23, 208
thermosphere, 4