Baker R.C. Flow Measurement Handbook: Industrial Designs, Operating Principles, Performance, and Applications
Подождите немного. Документ загружается.

12.4 DESIGN DETAILS
287
I
1
- FLANGE AND TUBE
* INSULATING
LINER
1
ELECTRODES
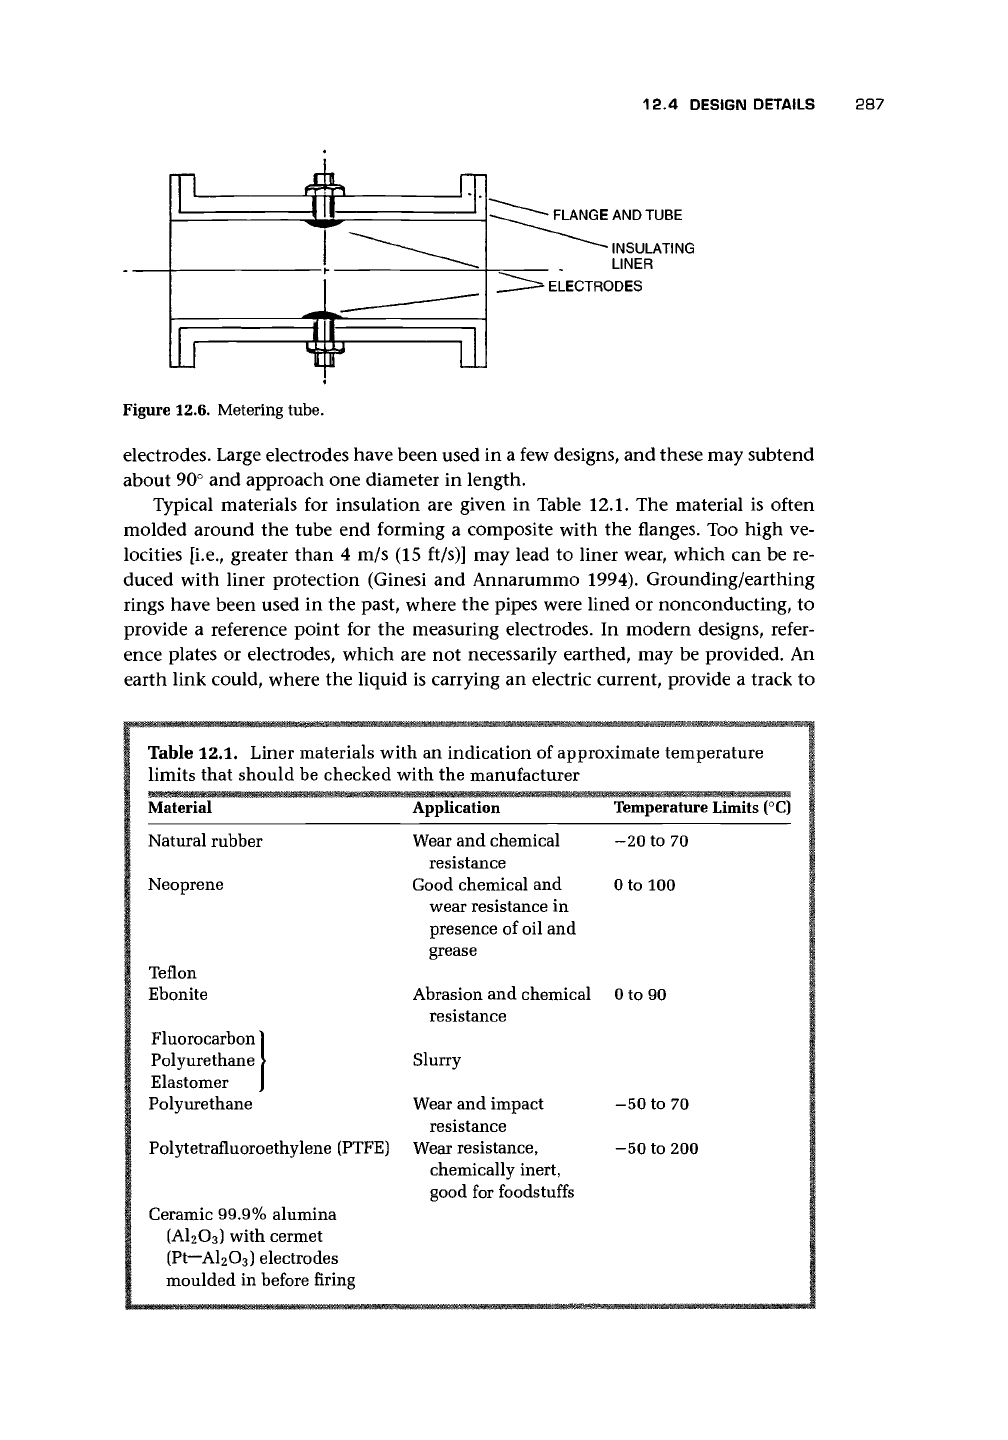
Figure 12.6. Metering tube.
electrodes. Large electrodes have been used in a few designs, and these may subtend
about 90° and approach one diameter in length.
Typical materials for insulation are given in Table 12.1. The material is often
molded around the tube end forming a composite with the flanges. Too high ve-
locities [i.e., greater than 4 m/s (15 ft/s)] may lead to liner wear, which can be re-
duced with liner protection (Ginesi and Annarummo 1994). Grounding/earthing
rings have been used in the past, where the pipes were lined or nonconducting, to
provide a reference point for the measuring electrodes. In modern designs, refer-
ence plates or electrodes, which are not necessarily earthed, may be provided. An
earth link could, where the liquid is carrying an electric current, provide a track to
Table 12.1. Liner materials with an indication of approximate temperature
limits that should be checked with the manufacturer
Material
Application Temperature Limits (°C)
Natural rubber
Neoprene
Teflon
Ebonite
Fluorocarbon
Polyurethane
Elastomer
Polyurethane
Polytetrafluoroethylene (PTFE)
Ceramic 99.9% alumina
(AI2O3) with cermet
(Pt—AI2O3) electrodes
moulded in before firing
Wear and chemical -20 to 70
resistance
Good chemical and 0 to 100
wear resistance in
presence of oil and
grease
Abrasion and chemical 0 to 90
resistance
Slurry
Wear and impact
resistance
Wear resistance,
chemically inert,
good for foodstuffs
-50 to 70
-50 to 200
288
ELECTROMAGNETIC FLOWMETERS
earth and cause galvanic damage. In this case, the meter may be allowed to float
electrically and would be made safe via an isolating transformer.
The electrodes normally have to make contact (cf. noncontacting electrodes,
Section 12.6) with the fluid and therefore break through the tube lining (Figure 12.6).
They are sometimes formed as a dome-headed screw and bolted in, pulling down
onto the liner material, the electrical tag connection to the leads being bolted on
finally. Because they are in contact with the fluid, the material of the electrode must
be chosen with care. Some of the materials used are nonmagnetic stainless steel (for
nonaggressive liquids), platinum-iridium, Monel, tantalum, titanium, zirconium (for
aggressive liquids), and Hastelloy-C. Stainless steel maybe recommended for slurries.
Note also the ceramic combination of liner and electrode.
In paper pulp and possibly other applications, the impact of paper or other ma-
terial on the electrodes can cause noise. According to one manufacturer, a porous
ceramic coating over the electrode may reduce this problem.
Because the electrode must make contact with the liquid, various means have
been tried for electrode cleaning including
• scraping (a scraper or brush may pass through the center of the electrode and be
turned to scrape the surface) (cf. Rose and Vass 1995),
• burn-off (the passing of a large enough current to remove surface deposits while
the rest of the electronics is disconnected),
• ultrasonic cleaning (vibrating the electrode with ultrasound to cause local cavi-
tation and hence cleaning),
• electrodes removable in service, and
• bullet-nosed electrodes.
The method should be chosen in relation to the likely nature of the deposit. In
many cases, electrodes appear to be self-cleaning: the flow past them keeps deposits
at bay. Coatings on meter internals can have more, the same, or most commonly
less conductivity than the bulk fluid. In modern DC systems, the input impedance
may be high enough to make the effect of deposits negligible.
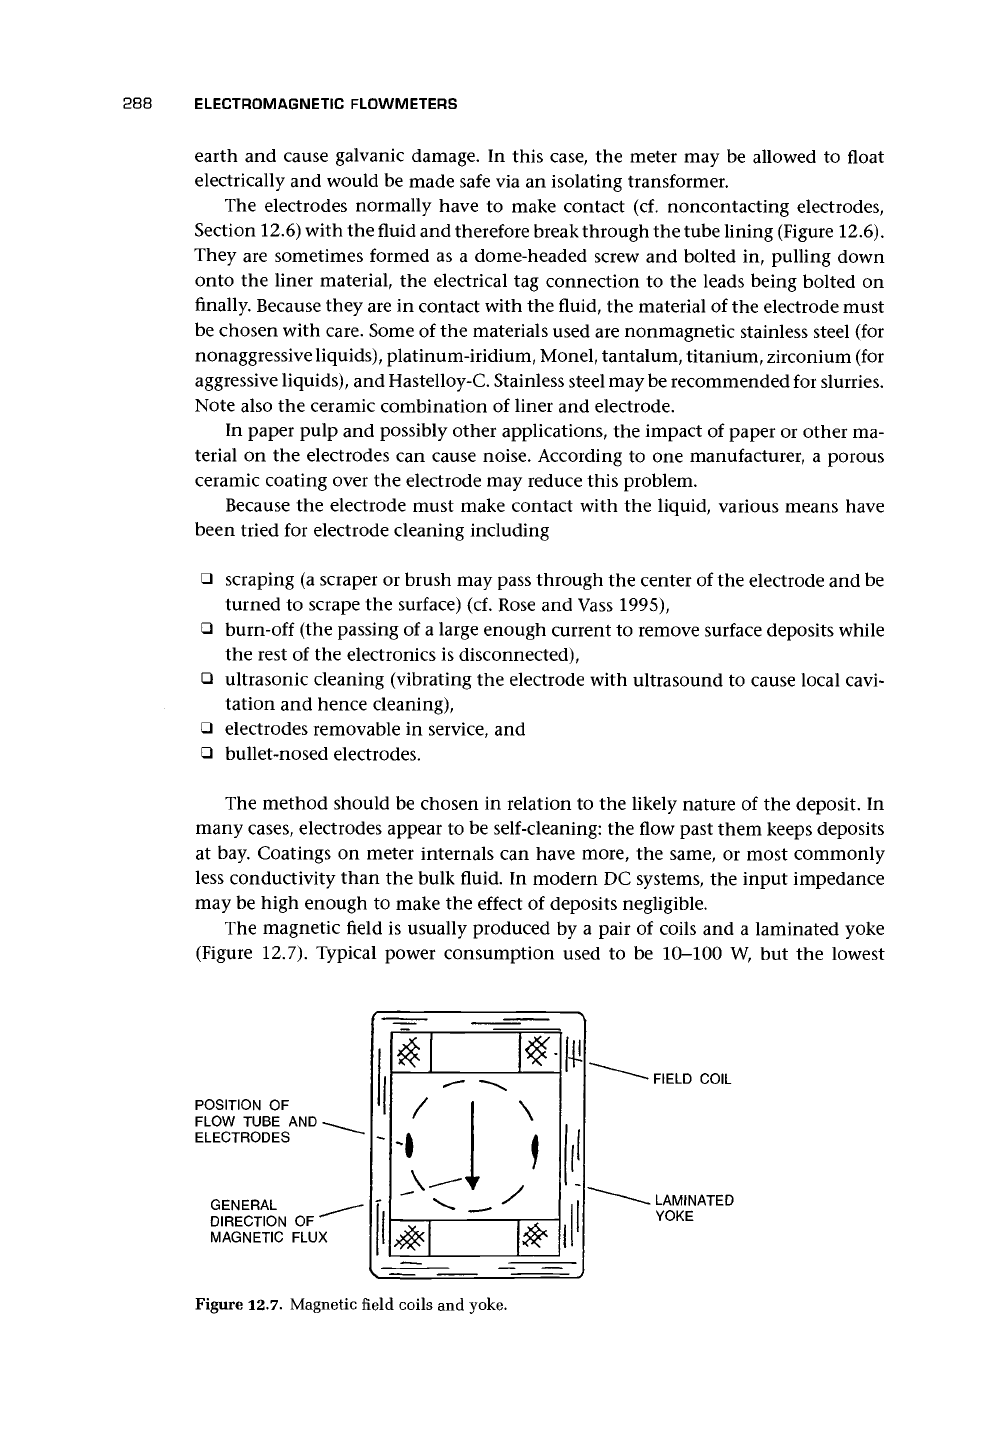
The magnetic field is usually produced by a pair of coils and a laminated yoke
(Figure 12.7). Typical power consumption used to be 10-100 W, but the lowest
POSITION OF
FLOW TUBE AND
ELECTRODES
GENERAL
DIRECTION OF
MAGNETIC FLUX
FIELD COIL
Figure 12.7. Magnetic field coils and yoke.
12.4 DESIGN DETAILS 289
MAGNETIC FLUX
AREA LINKED
BY FLUX WHICH
PRODUCES QUADRATURE
SIGNAL
TWIN TWISTED LEAD
FLOW TUBE
CORRECTLY POSITIONED LEAD
DISPLACED LEAD
LIQUID "WIRE"
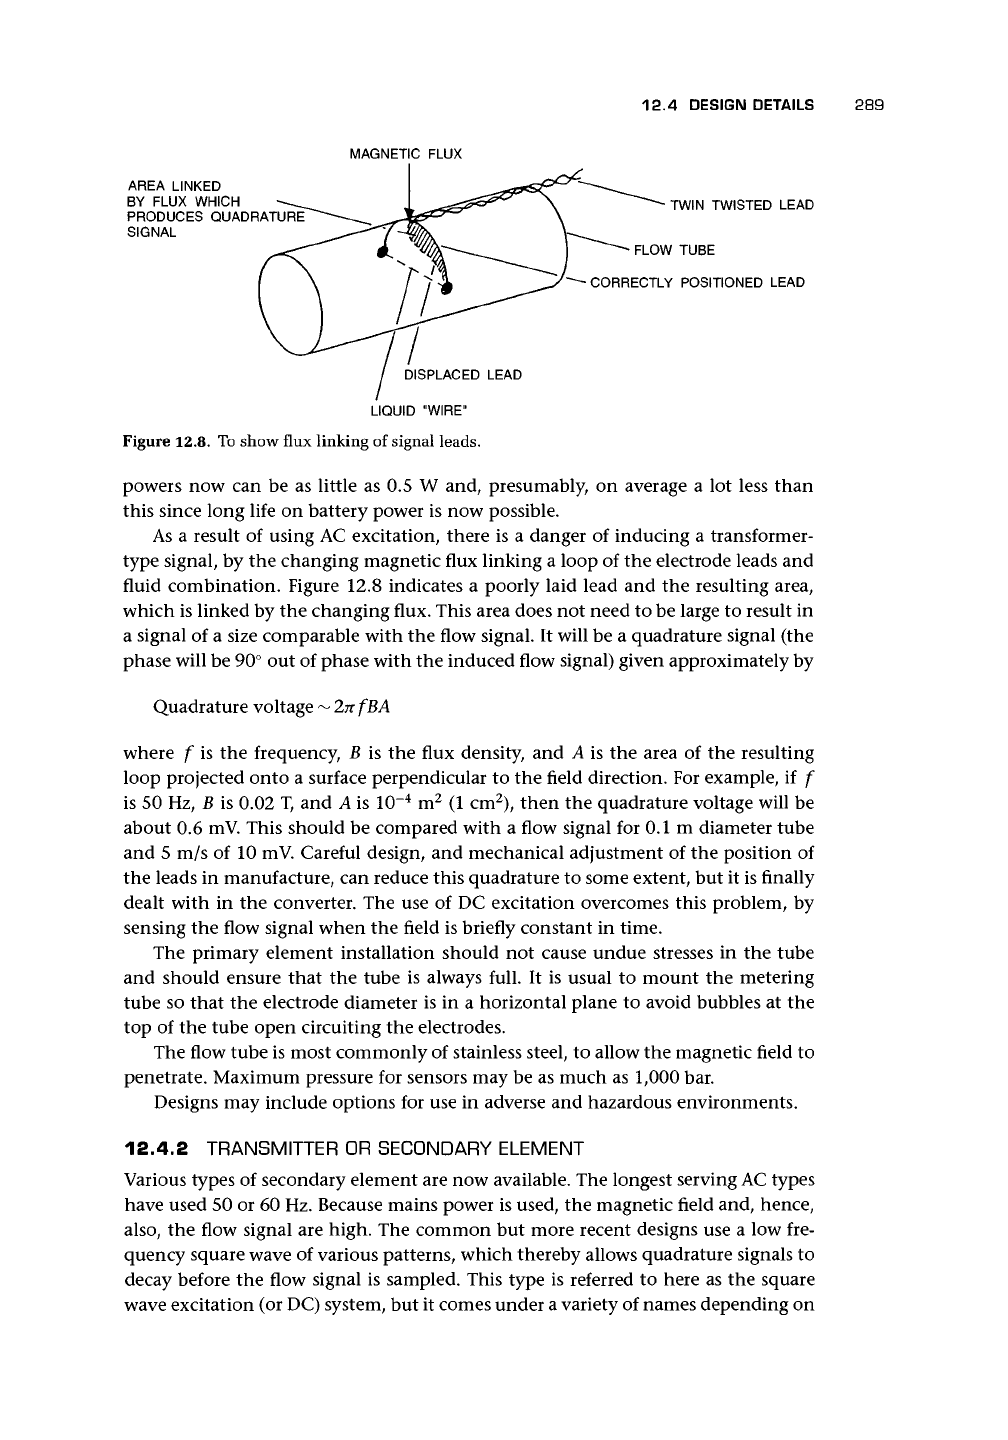
Figure 12.8. To show flux linking of signal leads.
powers now can be as little as 0.5 W and, presumably, on average a lot less than
this since long life on battery power is now possible.
As a result of using AC excitation, there is a danger of inducing a transformer-
type signal, by the changing magnetic flux linking a loop of the electrode leads and
fluid combination. Figure 12.8 indicates a poorly laid lead and the resulting area,
which is linked by the changing flux. This area does not need to be large to result in
a signal of a size comparable with the flow signal. It will be a quadrature signal (the
phase will be 90° out of phase with the induced flow signal) given approximately by
Quadrature voltage ~
2TT
fBA
where f is the frequency, B is the flux density, and A is the area of the resulting
loop projected onto a surface perpendicular to the field direction. For example, if f
is 50 Hz, B is 0.02 T, and A is 10"
4
m
2
(1 cm
2
), then the quadrature voltage will be
about 0.6 mV. This should be compared with a flow signal for 0.1 m diameter tube
and 5 m/s of 10 mV. Careful design, and mechanical adjustment of the position of
the leads in manufacture, can reduce this quadrature to some extent, but it is finally
dealt with in the converter. The use of DC excitation overcomes this problem, by
sensing the flow signal when the field is briefly constant in time.
The primary element installation should not cause undue stresses in the tube
and should ensure that the tube is always full. It is usual to mount the metering
tube so that the electrode diameter is in a horizontal plane to avoid bubbles at the
top of the tube open circuiting the electrodes.
The flow tube is most commonly of stainless steel, to allow the magnetic field to
penetrate. Maximum pressure for sensors may be as much as 1,000 bar.
Designs may include options for use in adverse and hazardous environments.
12.4.2 TRANSMITTER OR SECONDARY ELEMENT
Various types of secondary element are now available. The longest serving AC types
have used 50 or 60 Hz. Because mains power is used, the magnetic field and, hence,
also,
the flow signal are high. The common but more recent designs use a low fre-
quency square wave of various patterns, which thereby allows quadrature signals to
decay before the flow signal is sampled. This type is referred to here as the square
wave excitation (or DC) system, but it comes under a variety of names depending on
290
ELECTROMAGNETIC FLOWMETERS
the manufacturer (cf. Brobeil et al. 1993). The description DC is used with caution
because early meters did, indeed, attempt to operate on true DC without success.
Field strengths may be lower in DC designs, but electrical noise from slurries and
electromechanical effects will be the same as for
AC.
Most recent designs of
DC
meter
may, therefore, have special high power supply modules to address this.
Bonfig et al. (1975) described one of the first successful designs, which is re-
ferred to as keyed DC field. Hafner (1985) described another system, switched DC,
which had features for noise reduction (e.g., both passive and active shielding), elec-
trochemical effects, periodical zeroing of the amplifier, multiple sampling of the
signal, increased field frequency (up to 125 Hz), digital filtering, and the use of
flow noise analogue circuitry. With low power [down to 1.5 W (as well as size and
weight)],
the design achieved intrinsic safety requirements and operated off a bat-
tery. Microprocessor control also provided self-testing, temperature compensation,
interchangeable primaries and secondaries, and communication. In addition, elec-
trodes provided earthing and checking for empty tube. Herzog et al. (1993) dealt
with switched DC design, which included a periodic integration of the electronic
reference point and discussed a third electrode circuit for partially filled tubes.
The output is usually 0-10 or 4-20 mA, and two or three range switches are pro-
vided to allow a full-scale output reading to be achieved with flows from
1
to 10 m/s.
However, this is being superseded by the power of microprocessor technology, which
allows a move toward smart/intelligent instrumentation with autoranging, digital
transmission and a much greater range of possibilities.
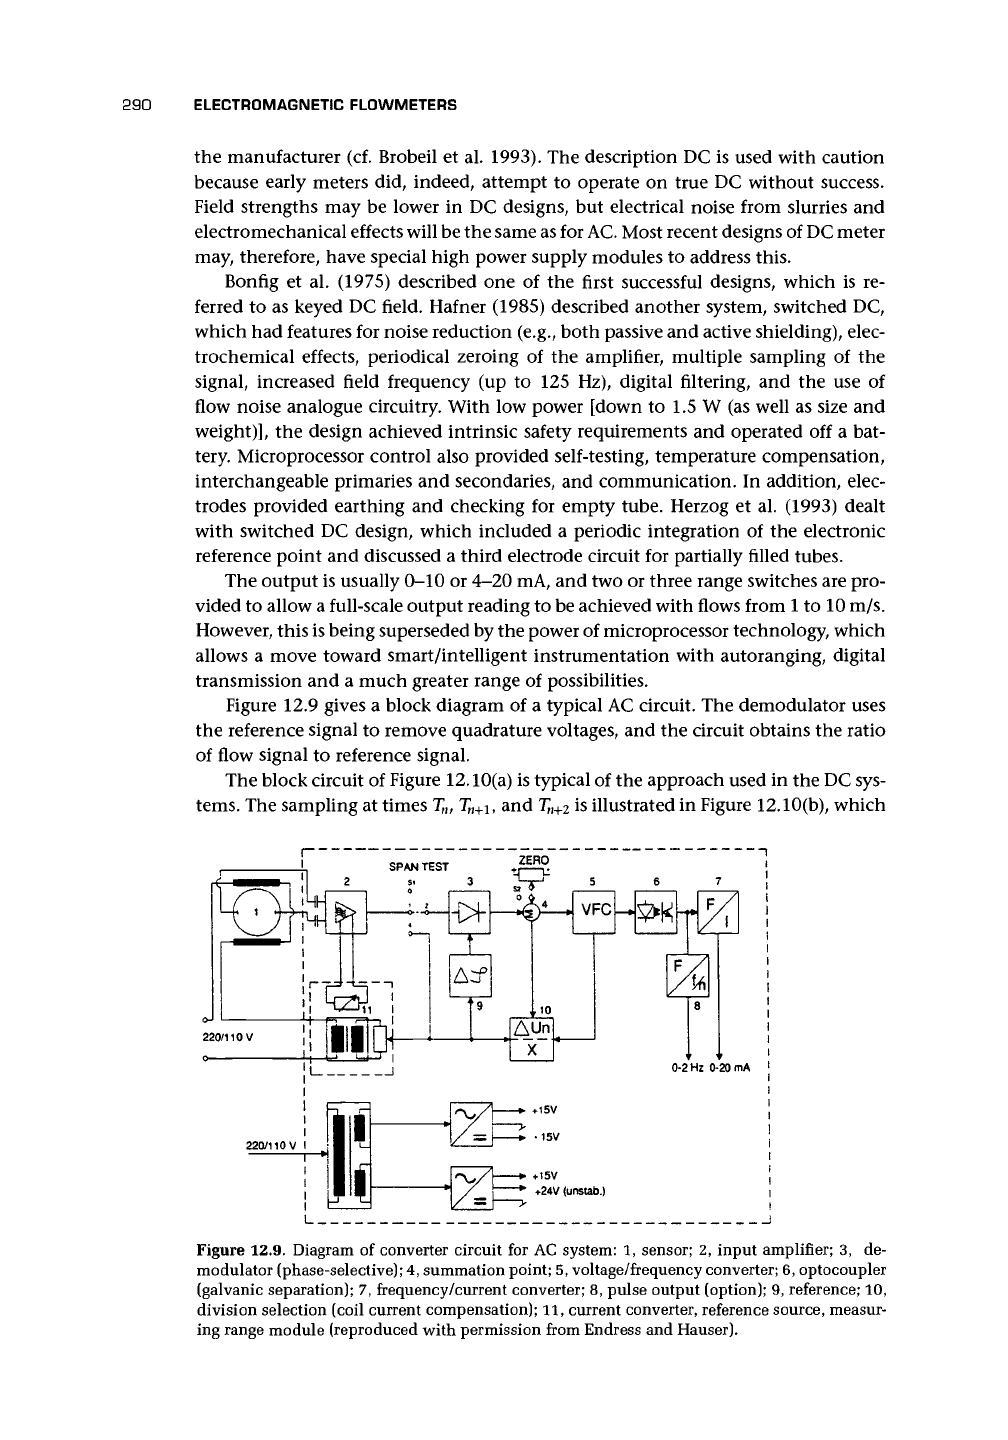
Figure 12.9 gives a block diagram of a typical AC circuit. The demodulator uses
the reference signal to remove quadrature voltages, and the circuit obtains the ratio
of flow signal to reference signal.
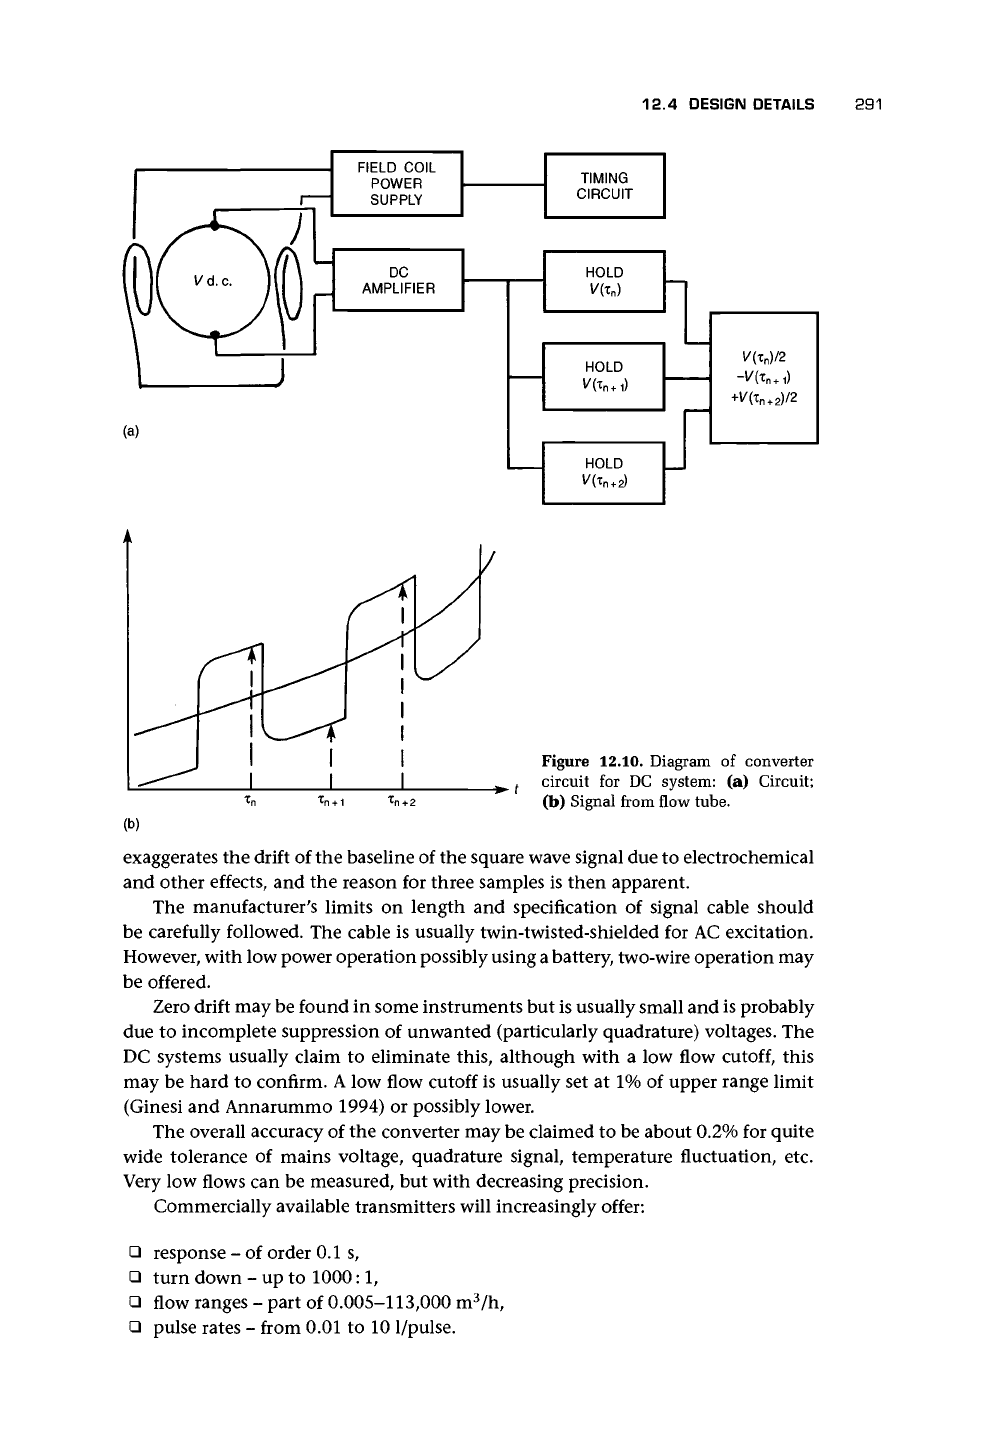
The block circuit of Figure 12.10(a) is typical of the approach used in the DC sys-
tems.
The sampling at times T
n
,
T
n+
i,
and
T
n+2
is illustrated in Figure 12.10(b), which
Figure 12.9. Diagram of converter circuit for AC system: 1, sensor; 2, input amplifier; 3, de-
modulator (phase-selective); 4, summation point; 5, voltage/frequency converter; 6, optocoupler
(galvanic separation); 7, frequency/current converter; 8, pulse output (option); 9, reference; 10,
division selection (coil current compensation); 11, current converter, reference source, measur-
ing range module (reproduced with permission from Endress and Hauser).
12.4 DESIGN DETAILS
291
FIELD COIL
POWER
SUPPLY
TIMING
CIRCUIT
(a)
DC
AMPLIFIER
HOLD
HOLD
HOLD
I
i
V(x )/2
+j/(x
n + 2
)/2
Figure 12.10. Diagram of converter
t
circuit for DC system: (a) Circuit;
(b) Signal from flow tube.
exaggerates the drift of the baseline of the square wave signal due to electrochemical
and other effects, and the reason for three samples is then apparent.
The manufacturer's limits on length and specification of signal cable should
be carefully followed. The cable is usually twin-twisted-shielded for AC excitation.
However, with low power operation possibly using
a
battery, two-wire operation may
be offered.
Zero drift may be found in some instruments but is usually small and is probably
due to incomplete suppression of unwanted (particularly quadrature) voltages. The
DC systems usually claim to eliminate this, although with a low flow
cutoff,
this
may be hard to confirm. A low flow cutoff is usually set at 1% of upper range limit
(Ginesi and Annarummo 1994) or possibly lower.
The overall accuracy of the converter may be claimed to be about 0.2% for quite
wide tolerance of mains voltage, quadrature signal, temperature fluctuation, etc.
Very low flows can be measured, but with decreasing precision.
Commercially available transmitters will increasingly offer:
• response - of order 0.1 s,
• turn down - up to
1000:1,
• flow ranges - part of 0.005-113,000 m
3
/n,
• pulse rates - from 0.01 to 10
1/pulse.
292
ELECTROMAGNETIC FLOWMETERS
High-frequency
sampling
~<S° |L
High-pass filter-
High frequency Signal and noise
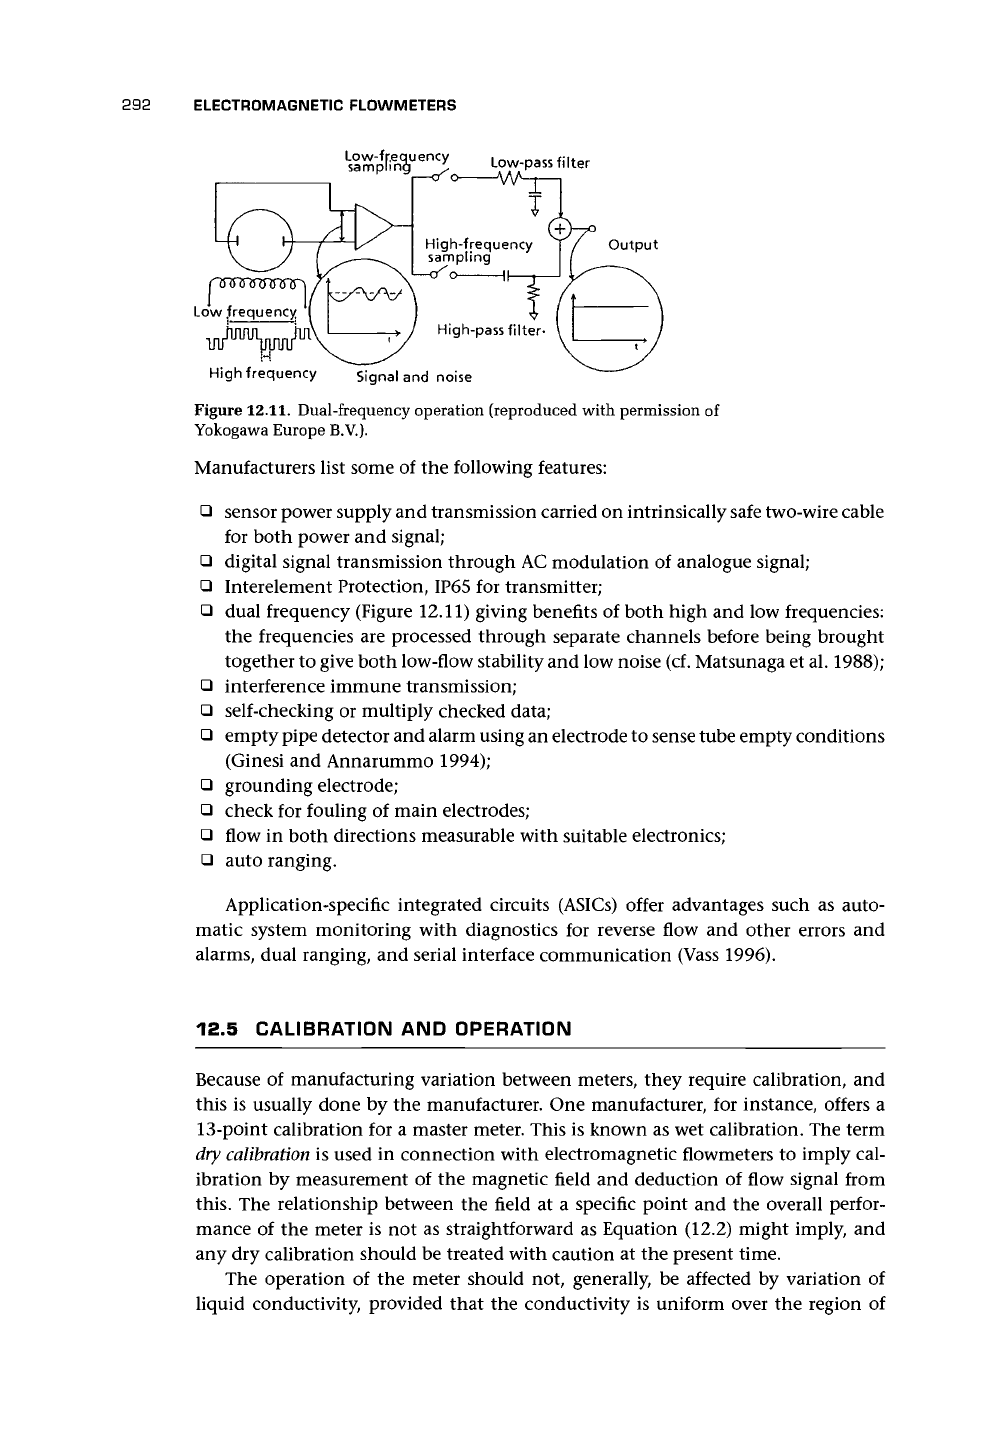
Figure
12.11.
Dual-frequency operation (reproduced with permission of
Yokogawa Europe B.V.).
Manufacturers list some of the following features:
• sensor power supply and transmission carried on intrinsically safe two-wire cable
for both power and signal;
• digital signal transmission through AC modulation of analogue signal;
• Interelement Protection, IP65 for transmitter;
• dual frequency (Figure 12.11) giving benefits of both high and low frequencies:
the frequencies are processed through separate channels before being brought
together to give both low-flow stability and low noise (cf. Matsunaga et al. 1988);
• interference immune transmission;
• self-checking or multiply checked data;
• empty pipe detector and alarm using an electrode to sense tube empty conditions
(Ginesi and Annarummo 1994);
• grounding electrode;
• check for fouling of main electrodes;
• flow in both directions measurable with suitable electronics;
• auto ranging.
Application-specific integrated circuits (ASICs) offer advantages such as auto-
matic system monitoring with diagnostics for reverse flow and other errors and
alarms, dual ranging, and serial interface communication (Vass 1996).
12.5 CALIBRATION AND OPERATION
Because of manufacturing variation between meters, they require calibration, and
this is usually done by the manufacturer. One manufacturer, for instance, offers a
13-point calibration for a master meter. This is known as wet calibration. The term
dry
calibration
is used in connection with electromagnetic flowmeters to imply cal-
ibration by measurement of the magnetic field and deduction of flow signal from
this.
The relationship between the field at a specific point and the overall perfor-
mance of the meter is not as straightforward as Equation (12.2) might imply, and
any dry calibration should be treated with caution at the present time.
The operation of the meter should not, generally, be affected by variation of
liquid conductivity, provided that the conductivity is uniform over the region of
12.6 INDUSTRIAL AND OTHER DESIGNS 293
Table 12.2. Output resistances of meter tube based on electrode
diameter of
0.01
m
Best electrolyte
Sea water
Tap water
Pure water
Liquid Conductivity
(S/m)
~10
2
~10"
2
4 x 10~
6
(/xS/cm)
~10
6
~4 x 10
4
~10
2
4 x 10~
2
Resistance
(ohms)
1
25
10,000
25,000,000
the flowmeter. This also presupposes that the conductivity is sufficient to ensure a
primary device output resistance of two or more orders of magnitude less than
the input resistance of the secondary device. However, severe variations in con-
ductivity may cause zero errors in AC-type magnetic flowmeters. Even though some
suggest that DC pulse types should be unaffected by such changes above a minimum
threshold (Ginesi and Annarummo 1994), one manufacturer appears to take an op-
posite view, recommending AC type for two-phase, slurries, low conductivity flows,
or inhomogeneous flows with rapidly varying conductivity. However, continuous
development of the DC type may ensure that they are equally suitable.
The output resistance of the primary device is approximately given by
R « 4~ ohms (12.4)
da
where d is the electrode diameter, and o is the conductivity.
From Equation (12
A),
we can obtain typical resistances of
a
meter with electrodes
of diameter 0.01 m, as shown in Table 12.2.
A secondary device with a typical input resistance of 20 x 10
6
ohms could cope
with the first three liquid conductivities in Table 12.2, but not with the last one.
Manufacturers may limit conductivity minima for certain sizes of meter. For instance,
for 25-100 mm, conductivity may only be acceptable down to 20 fiS/cm. However,
at least one manufacturer offers a meter capable of use with down to 0.05 /xS/cm
conductivity.
Entrained gases cause errors due to breaking of electrical continuity, nonunifor-
mity of conductivity, and uncertainty as to what is being measured. The flowmeter
should be positioned where these are negligible.
12.6 INDUSTRIAL AND OTHER DESIGNS
It is not my intention to detail all the features of industrial designs nor the common
operational problems (see, for instance, Baker 1982) but rather to give the main
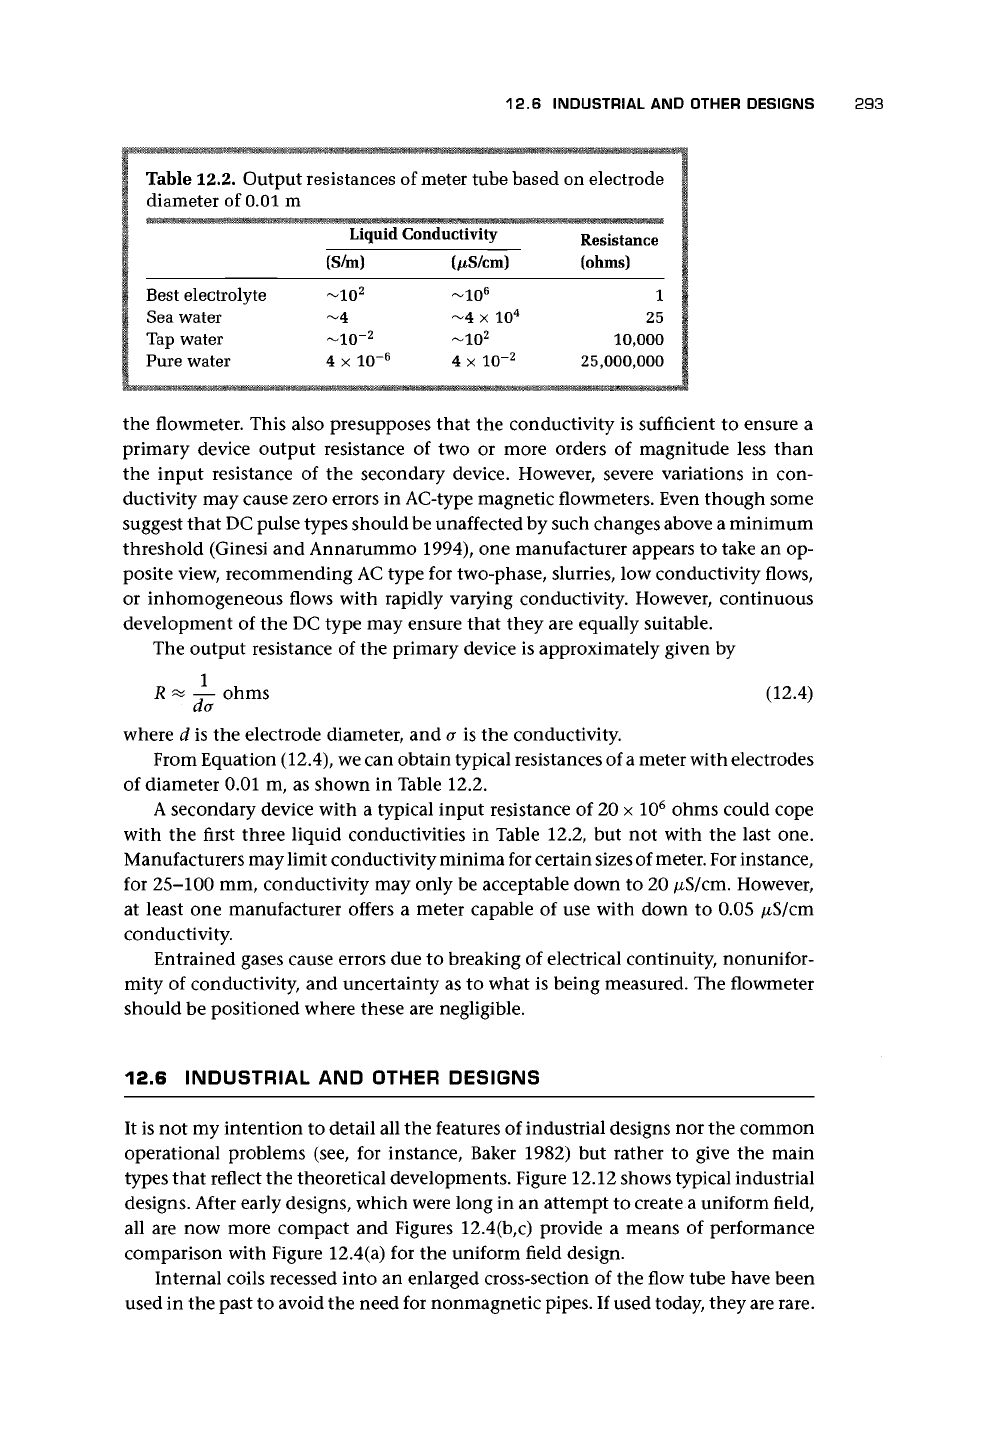
types that reflect the theoretical developments. Figure 12.12 shows typical industrial
designs. After early designs, which were long in an attempt to create a uniform field,
all are now more compact and Figures 12.4(b,c) provide a means of performance
comparison with Figure 12.4(a) for the uniform field design.
Internal coils recessed into an enlarged cross-section of the flow tube have been
used in the past to avoid the need for nonmagnetic
pipes.
If used today, they are rare.
294 ELECTROMAGNETIC FLOWMETERS
Figure 12.12. Industrial designs (reproduced with permission from Endress and Hauser):
(a) Showing main components; (b) Various sizes.
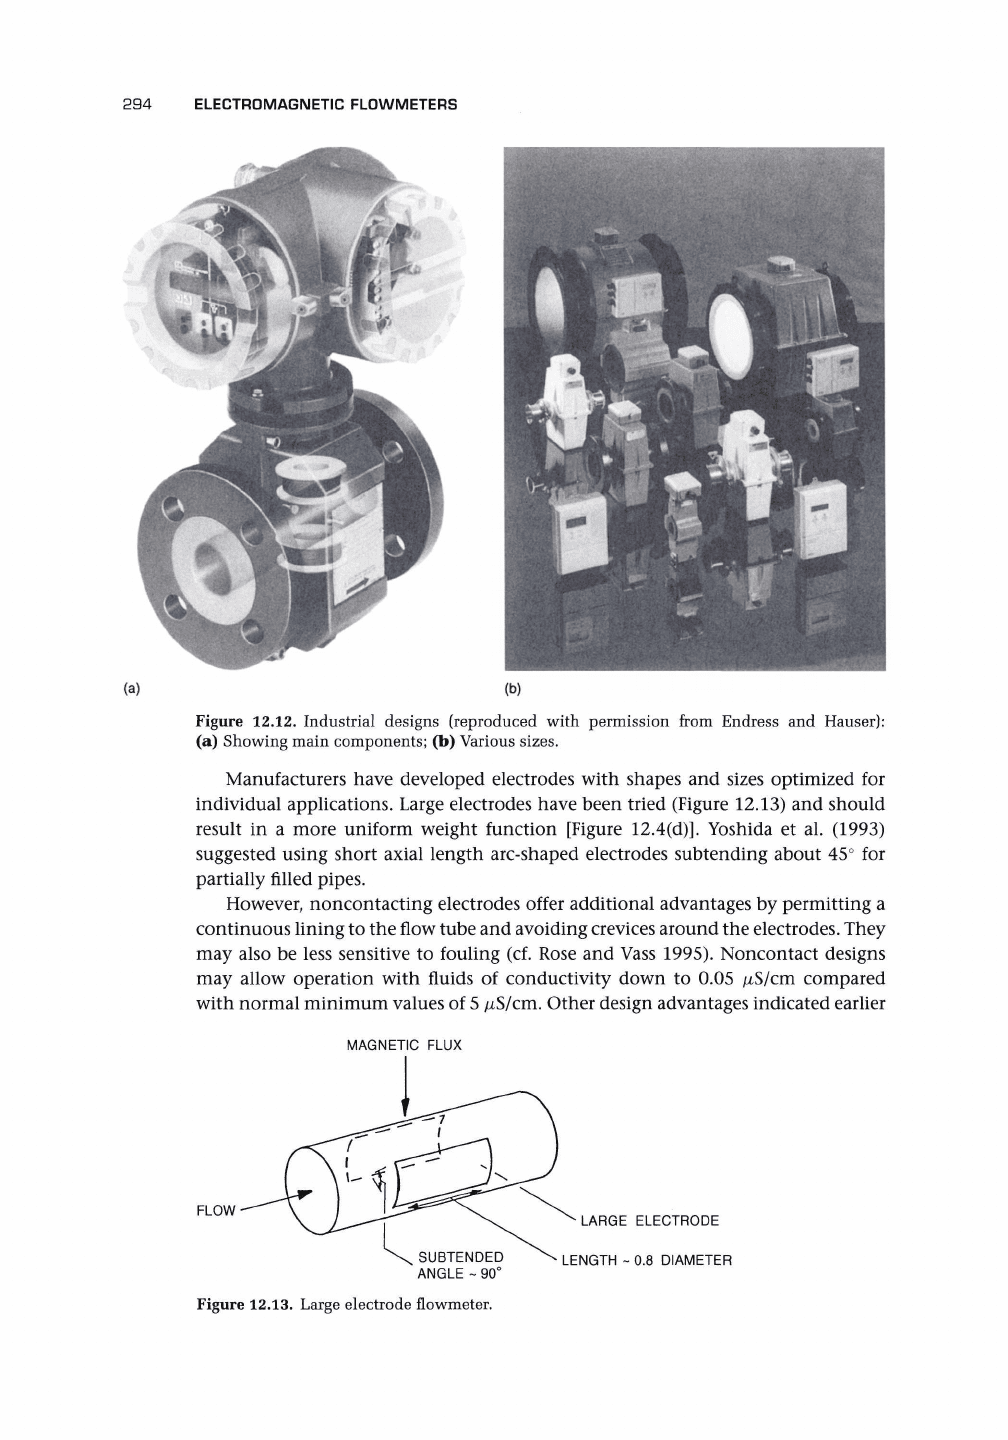
Manufacturers have developed electrodes with shapes and sizes optimized for
individual applications. Large electrodes have been tried (Figure 12.13) and should
result in a more uniform weight function [Figure 12.4(d)]. Yoshida et al. (1993)
suggested using short axial length arc-shaped electrodes subtending about 45° for
partially filled pipes.
However, noncontacting electrodes offer additional advantages by permitting a
continuous lining to the flow tube and avoiding crevices around the electrodes. They
may also be less sensitive to fouling (cf. Rose and Vass 1995). Noncontact designs
may allow operation with fluids of conductivity down to 0.05 /xS/cm compared
with normal minimum values of
5
/xS/cm. Other design advantages indicated earlier
MAGNETIC FLUX
FLOW
SUBTENDED
ANGLE ~ 90°
'LARGE ELECTRODE
* LENGTH ~ 0.8 DIAMETER
Figure 12.13. Large electrode flowmeter.
12.7 INSTALLATION CONSTRAINTS - ENVIRONMENTAL 295
• STAINLESS STEEL
TUBE
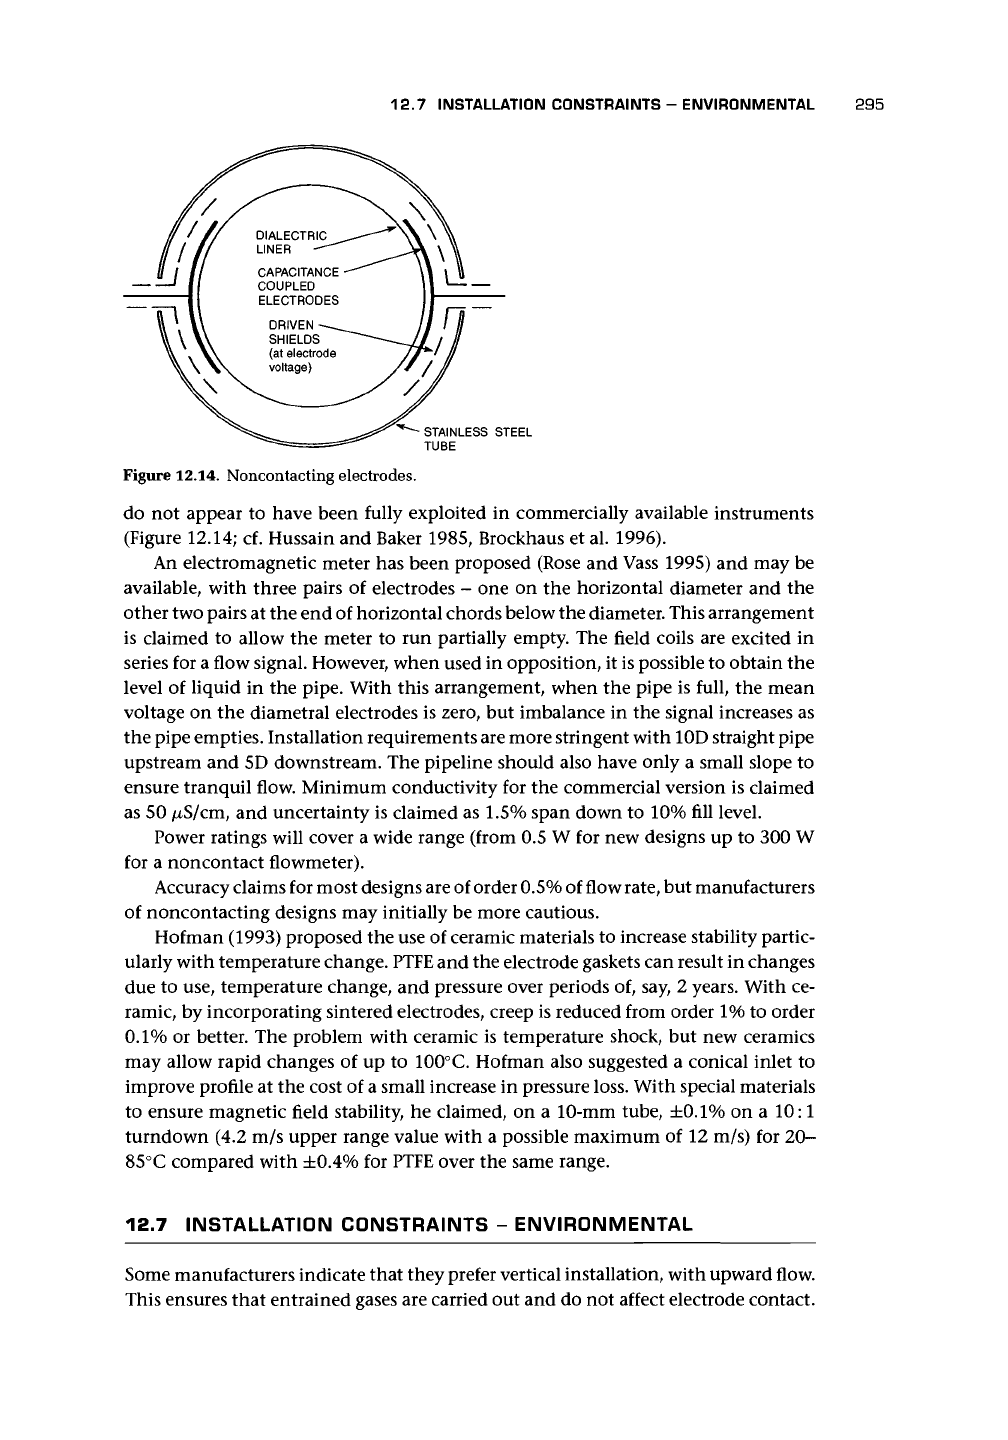
Figure 12.14. Noncontacting electrodes.
do not appear to have been fully exploited in commercially available instruments
(Figure 12.14; cf. Hussain and Baker 1985, Brockhaus et al. 1996).
An electromagnetic meter has been proposed (Rose and Vass 1995) and may be
available, with three pairs of electrodes - one on the horizontal diameter and the
other two pairs at the end of horizontal chords below the diameter. This arrangement
is claimed to allow the meter to run partially empty. The field coils are excited in
series for a flow signal. However, when used in opposition, it is possible to obtain the
level of liquid in the pipe. With this arrangement, when the pipe is full, the mean
voltage on the diametral electrodes is zero, but imbalance in the signal increases as
the pipe empties. Installation requirements are more stringent with 10D straight pipe
upstream and 5D downstream. The pipeline should also have only a small slope to
ensure tranquil flow. Minimum conductivity for the commercial version is claimed
as 50 /xS/cm, and uncertainty is claimed as 1.5% span down to 10% fill level.
Power ratings will cover a wide range (from 0.5 W for new designs up to 300 W
for a noncontact flowmeter).
Accuracy claims for most designs are of order
0.5%
of flow rate, but manufacturers
of noncontacting designs may initially be more cautious.
Hofman (1993) proposed the use of ceramic materials to increase stability partic-
ularly with temperature change.
PTFE
and the electrode gaskets can result in changes
due to use, temperature change, and pressure over periods of, say, 2 years. With ce-
ramic, by incorporating sintered electrodes, creep is reduced from order 1% to order
0.1%
or better. The problem with ceramic is temperature shock, but new ceramics
may allow rapid changes of up to 100°C. Hofman also suggested a conical inlet to
improve profile at the cost of a small increase in pressure loss. With special materials
to ensure magnetic field stability, he claimed, on a 10-mm tube, ±0.1% on a 10:1
turndown (4.2 m/s upper range value with a possible maximum of 12 m/s) for 20-
85°C compared with ±0.4% for PTFE over the same range.
12.7 INSTALLATION CONSTRAINTS - ENVIRONMENTAL
Some manufacturers indicate that they prefer vertical installation, with upward flow.
This ensures that entrained gases are carried out and do not affect electrode contact.
296 ELECTROMAGNETIC FLOWMETERS
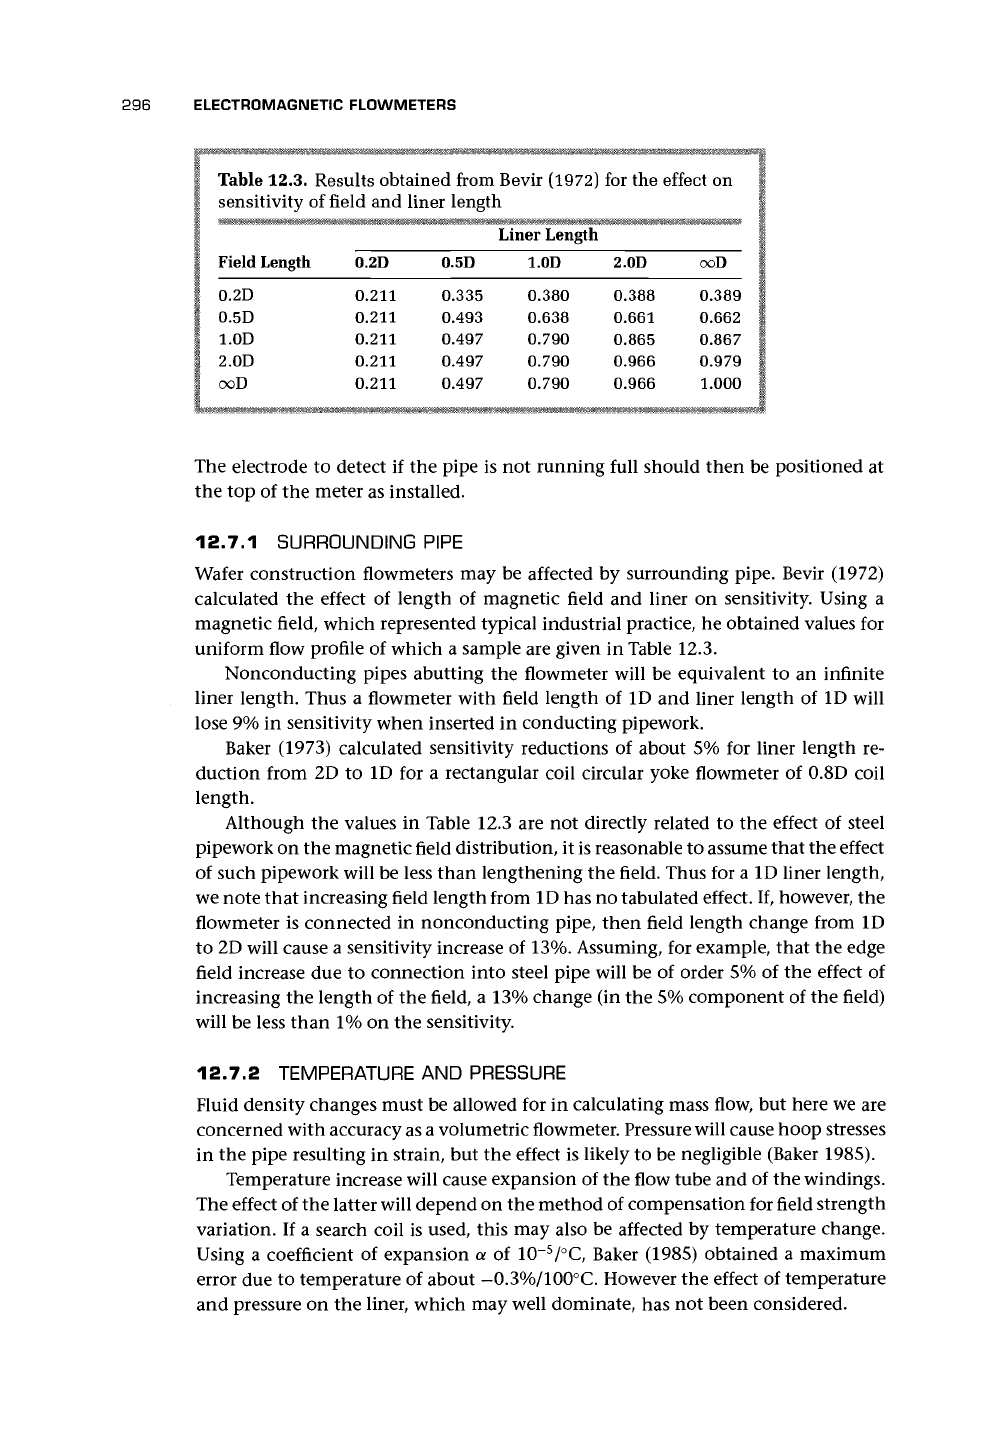
Table 12.3. Results obtained from Bevir (1972) for the effect on
sensitivity of field and liner length
Field Length
0.2D
0.5D
l.OD
2.0D
ooD
0.2D
0.211
0.211
0.211
0.211
0.211
0.5D
0.335
0.493
0.497
0.497
0.497
Liner Length
l.OD
0.380
0.638
0.790
0.790
0.790
2.0D
0.388
0.661
0.865
0.966
0.966
ooD
0.389
0.662
0.867
0.979
1.000
The electrode to detect if the pipe is not running full should then be positioned at
the top of the meter as installed.
12.7.1 SURROUNDING PIPE
Wafer construction flowmeters may be affected by surrounding pipe. Bevir (1972)
calculated the effect of length of magnetic field and liner on sensitivity. Using a
magnetic field, which represented typical industrial practice, he obtained values for
uniform flow profile of which a sample are given in Table 12.3.
Nonconducting pipes abutting the flowmeter will be equivalent to an infinite
liner length. Thus a flowmeter with field length of ID and liner length of ID will
lose 9% in sensitivity when inserted in conducting pipework.
Baker (1973) calculated sensitivity reductions of about 5% for liner length re-
duction from 2D to ID for a rectangular coil circular yoke flowmeter of 0.8D coil
length.
Although the values in Table 12.3 are not directly related to the effect of steel
pipework on the magnetic field distribution, it is reasonable to assume that the effect
of such pipework will be less than lengthening the field. Thus for a ID liner length,
we note that increasing field length from ID has no tabulated effect. If, however, the
flowmeter is connected in nonconducting pipe, then field length change from ID
to 2D will cause a sensitivity increase of
13%.
Assuming, for example, that the edge
field increase due to connection into steel pipe will be of order 5% of the effect of
increasing the length of the field, a
13%
change (in the 5% component of the field)
will be less than 1% on the sensitivity.
12.7.2 TEMPERATURE AND PRESSURE
Fluid density changes must be allowed for in calculating mass flow, but here we are
concerned with accuracy as a volumetric flowmeter. Pressure will cause hoop stresses
in the pipe resulting in strain, but the effect is likely to be negligible (Baker 1985).
Temperature increase will cause expansion of the flow tube and of the windings.
The effect of the latter will depend on the method of compensation for field strength
variation. If a search coil is used, this may also be affected by temperature change.
Using a coefficient of expansion a of 10~
5
/°C, Baker (1985) obtained a maximum
error due to temperature of about -0.3%/100°C. However the effect of temperature
and pressure on the liner, which may well dominate, has not been considered.