Devore J.L., Berk K.N. Modern Mathematical Statistics with Applications
Подождите немного. Документ загружается.


(Assume independence of X
1
, X
2
,andX
3
,whichis
reasonable if the student pays no attention to the
finishing time of the first class.)
76. a. Use the general formula for the variance of
a linear combination to write an expression
for V(aX + Y). Then let a ¼ s
Y
/s
X
, and show
that r –1. [Hint: Variance is always 0, and
Cov(X, Y) ¼ s
X
· s
Y
·r.]
b. By considering V( aX – Y), conclude that
r 1.
c. Use the fact that V(W) ¼ 0 only if W is a
constant to show that r ¼ 1 only if Y ¼ aX + b.
77. A rock specimen from a particular area is ran-
domly selected and weighed two different times.
Let W denote the actual weight and X
1
and X
2
the two measured weights. Then X
1
¼ W + E
1
and X
2
¼ W + E
2
, where E
1
and E
2
are the two
measurement errors. Suppose that the E
i
’s are
independent of each other and of W and that
VE
1
ðÞ¼VE
2
ðÞ¼s
2
E
.
a. Express r, the correlation coefficient between
the two measured weights X
1
and X
2
, in terms
of s
2
W
, the variance of actual weight, and s
2
X
,
the variance of measured weight.
b. Compute r when s
W
¼ 1 kg and s
E
¼ .01 kg.
78. Let A denote the percentage of one constituent in a
randomly selected rock specimen, and let B denote
the percentage of a second constituent in that same
specimen. Suppose D and E are measurement
errors in determining the values of A and B so that
measured values are X ¼ A+Dand Y ¼ B+E,
respectively. Assume that measurement errors are
independent of each other and of actual values.
a. Show that
CorrðX; YÞ¼CorrðA; BÞ
ffiffiffiffiffiffiffiffiffiffiffiffiffiffiffiffiffiffiffiffiffiffiffiffiffi
CorrðX
1
; X
2
Þ
p
ffiffiffiffiffiffiffiffiffiffiffiffiffiffiffiffiffiffiffiffiffiffiffiffi
CorrðY
1
; Y
2
Þ
p
where X
1
and X
2
are replicate measurements on
the value of A, and Y
1
and Y
2
are defined
analogously with respect to B. What effect
does the presence of measurement error have
on the correlation?
b. What is the maximum value of Corr(X, Y)
when Corr(X
1
, X
2
) ¼ .8100, Corr(Y
1
, Y
2
) ¼
.9025? Is this disturbing?
79. Let X
1
, ..., X
n
be independent rv’s with mean
values m
1
, ..., m
n
and variances s
2
1
, ..., s
2
n
. Con-
sider a function h(x
1
, ..., x
n
), and use it to define a
new rv Y ¼ h(X
1
, ..., X
n
). Under rather general
conditions on the h function, if the s
i
’s are all
small relative to the corresponding m
i
’s, it can be
shown that E(Y) h(m
1
, ..., m
n
) and
VðYÞ
@h
@x
1
2
s
2
1
þþ
@h
@x
n
2
s
2
n
where each partial derivative is evaluated at (x
1
,
..., x
n
) ¼ (m
1
, ..., m
n
). Suppose three resistors
with resistances X
1
, X
2
, X
3
are connected in paral-
lel across a battery with voltage X
4
. Then by
Ohm’s law, the current is
Y ¼ X
4
1
X
1
þ
1
X
2
þ
1
X
3
Let m
1
¼ 10 ohms, s
1
¼ 1.0 ohms, m
2
¼ 15 ohms,
s
2
¼ 1.0 ohms, m
3
¼ 20 ohms, s
3
¼ 1.5 ohms,
m
4
¼ 120 V, s
4
¼ 4.0 V. Calculate the approxi-
mate expected value and standard deviation of the
current (suggested by “Random Samplings,”
CHEMTECH, 1984: 696–697).
80. A more accurate approximation to E[h(X
1
, ...,
X
n
)] in Exercise 79 is
hðm
1
; ...; m
n
Þþ
1
2
s
2
1
@
2
h
@x
2
1
þþ
1
2
s
2
n
@
2
h
@x
2
n
Compute this for Y ¼ h(X
1
, X
2
, X
3
, X
4
) given in
Exercise 79, and compare it to the leading term
h(m
1
, ..., m
n
).
81. Explain how you would use a statistical soft-
ware package capable of generating independent
standard normal observations to obtain observed
values of (X, Y), where X and Y are bivariate
normal with means 100 and 50, standard devia-
tions 5 and 2, and correlation .5. [Hint: Exam-
ple 6.16.]
328
CHAPTER 6 Statistics and Sampling Distributions

Bibliography
Larsen, Richard, and Morris Marx, An Introduction to
Mathematical Statistics and Its Applications (4th
ed.), Prentice Hall, Englewood Cliffs, NJ, 2005.
More limited coverage than in the book by Olkin
et al., but well written and readable.
Olkin, Ingram, Cyrus Derman, and Leon Gleser, Prob-
ability Models and Applications (2nd ed.), Macmil-
lan, New York, 1994. Contains a careful and
comprehensive exposition of limit theorems.
Appendix: Proof of the Central Limit
Theorem
First, here is a restatement of the theorem. Let X
1
, X
2
, ..., X
n
be a random sample
from a distribution with mean m and variance s
2
. Then, if Z is a standard normal
random variable,
lim
n!1
P
X m
s=
ffiffiffi
n
p
< z
¼ PðZ < zÞ
The theorem says that the distribution of the standardized
X approaches the
standard normal distribution. Our proof is only for the special case in which the
moment generating function exis ts, which implies also that all its derivatives exist
and that they are continuous. We will show that the moment generating function of
the standardized
X approaches the moment generating function of the standard
normal distribution. However, convergence of the moment generating function
does not by itself imply the desired convergence of the distribution. This requires
a theorem, which we will not prove, showing that convergence of the moment
generating function implies the convergence of the distribution.
The standardized
X can be written as
Y ¼
X m
s=
ffiffiffi
n
p
¼
ð1=nÞ½ðX
1
mÞ=s þðX
2
mÞ=s þþðX
n
mÞ=s0
1=
ffiffiffi
n
p
The mean and standard deviation for the first ratio come from the first proposition
of Section 6.2, and the second ratio is algebraically equivalent to the first. It says
that, if we define W to be the standardized X,soW
i
¼ (X
i
– m)/s,i¼ 1, 2,..., n,
then the standardized
X can be written as the standardized
W,
Y ¼
X
m
s
ffiffiffi
n
p
=
¼
W 0
1
ffiffiffi
n
p
=
:
This allows a simplification of the proof because we can work with the simpler
variable W, which has mea n 0 and variance 1. We need to obtain the moment
generating function of
Y ¼
W 0
1=
ffiffiffi
n
p
¼
ffiffiffi
n
p
W ¼ðW
1
þ W
2
þþW
n
Þ=
ffiffiffi
n
p
Appendix: Proof of the Central Limit Theorem 329

from the moment generating function M(t)ofW. With the help of the Section 6.3
proposition on moment gener ating functions of linear combinations of independent
random variables, we get M
Y
ðtÞ¼Mt
ffiffiffi
n
p
=
ðÞ
n
. We want to show that this converges
to the moment generating function of a standard normal random variable,
M
Z
ðtÞ¼e
t
2
2
=
. It is easier to take the logarithm of both sides and show instead
that ln½M
Y
ðtÞ ¼ n ln½Mðt=
ffiffiffi
n
p
!t
2
=2. This is equivalent because the logarithm
and its inverse are continuous functions.
The limit can be obtained from two applications of L’Ho
ˆ
pital’s rule if we set
x ¼ 1
ffiffiffi
n
p
=
,ln½M
Y
ðtÞ ¼ n ln½Mðt=
ffiffiffi
n
p
Þ ¼ ln½MðtxÞ=x
2
. Both the numerator and the
denominator approach 0 as n gets large and x gets small (recall that M(0) ¼ 1 and
M(t) is continuous), so L’Ho
ˆ
pital’s rule is applicable. Thus, differentiating the
numerator and denominator with respect to x,
lim
x!0
ln½MðtxÞ
x
2
¼ lim
x!0
M
0
ðtxÞt=MðtxÞ
2x
¼ lim
x!0
M
0
ðtxÞt
2xMð tx Þ
Recall that M(0) ¼ 1,M
0
(0) ¼ E(W) ¼ 0 and M(t) and its derivative M
0
(t) are
continuous, so both the numerator and denominator of the limit on the right
approach 0. Thus we can use L’Ho
ˆ
pital’s rule again.
lim
x!0
M
0
ðtxÞt
2xMð tx Þ
¼ lim
x!0
M
00
ðtxÞt
2
2MðtxÞþ2xM
0
ðtxÞt
¼
1ðt
2
Þ
2ð1Þþ2ð0Þð0Þt
¼ t
2
=2
In evaluating the limit we have used the continuity of M(t) and its derivatives and
M(0) ¼ 1, M
0
(0) ¼ E(W) ¼ 0, M
00
(0) ¼ E(W
2
) ¼ 1. We conclude that the mgf
converges to the mgf of a standard normal random variable.
330 CHAPTER 6 Statistics and Sampling Distributions

CHAPTER SEVEN
Point Estimation
Introduction
Given a parameter of interest, such as a population mean m or population propor-
tion
p
, the objective of point estimation is to use a sample to compute a number
that represents in some sense a good guess for the true value of the parameter.
The resulting number is called
a point estimate
.InSection 7.1, we present some
general concepts of point estimation. In Section 7.2 , we describe and illustrate two
important methods for obtaining point estimates: the method of moments and
the method of maximum likelihood.
Obtaining a point estimate entails calculating the value of a statistic such
as the sample mean
X or sample standard deviation
S
. We should therefore be
concerned that the chosen statistic contains all the relevant information about
the par ameter of interest. The idea of no information loss is made precise by the
concept of sufficiency, which is developed in Section 7.3. Finally, Section 7.4
further explores the meaning of efficient estimation and properties of maximum
likelihood.
J.L. Devore and K.N. Berk, Modern Mathematical Statistics with Applications, Springer Texts in Statistics,
DOI 10.1007/978-1-4614-0391-3_7,
#
Springer Science+Business Media, LLC 2012
331

7.1
General Concepts and Criteria
Statistical inference is frequently directed toward drawing some type of conclusion
about one or more parameters (population characteristics). To do so requires that
an investigator obtain sample data from each of the populations under study.
Conclusions can then be based on the computed values of various sample quan-
tities. For example, let m (a parameter) denote the average duration of anesthesia
for a short-acting anesthetic. A random sample of n ¼ 10 patients might be
chosen, and the duration for each one determined, resulting in obser ved durations
x
1
, x
2
,...,x
10
. The sample mean duration
x could then be used to draw a conclusion
about the value of m. Similarly, if s
2
is the variance of the duration distribution
(population variance, another parameter), the value of the sample variance s
2
can be
used to infer something about s
2
.
When discussing general concepts and methods of inference, i t is conve-
nient to have a generic symbol for the parameter of interest. We will use the Greek
letter y for this purpose. The objective of point estimation is to select a single
number, based on sample data, that represents a sensible value for y. Suppose,
forexample,thattheparameterofinterestism, the true average lifetime of
batteries of a certain type. A random sample of n ¼ 3 batteries might yield
observed lifetimes (hours) x
1
¼ 5.0, x
2
¼ 6.4, x
3
¼ 5.9. The computed value of
the sample mean lifetime i s
x ¼ 5:77, a nd it is reasonable to regard 5.77 as a very
plausi bl e value o f m, our “best guess” for the value of m based on the available
sample inform ation.
Suppose we want to estimate a parameter of a single population (e.g., m or s)
based on a random sample of size n. Recall from the previous chapter that before
data is available, the sample observations must be considered random variables
(rv’s) X
1
, X
2
,...,X
n
. It follows that any functi on of the X
i
’s—that is, any statistic—
such as the sample mean
X or sample standard deviation S is also a random variable.
The sam e is true if available data consists of more than one sample. For example,
we can represent duration of anesthesia of m patients on anesthetic A and n patients
on anesthetic B by X
1
,...,X
m
and Y
1
,...,Y
n
, respectively. The difference between
the two sample mean durations is
X Y, the natural statistic for making inferences
about m
1
– m
2
, the difference betwee n the population mean durations.
DEFINITION
A point estimate of a parameter y is a single number that can be regarded as a
sensible value for y. A point estimate is obtained by selecting a suitable
statistic and computing its value from the given sample data. The selected
statistic is called the point estim ator of y.
In the battery example just given, the estimator used to obtain the point
estimate of m was
X, and the point estimate of m was 5.77. If the three observed
lifetimes had instead been x
1
¼ 5.6, x
2
¼ 4.5, and x
3
¼ 6.1, use of the estimator X
would have resulted in the estimate
x ¼ð5:6 þ 4:5 þ 6:1Þ=3 ¼ 5:40. The symbol
^
y
(“theta hat”) is customarily used to denote both the estimator of y and the point
332 CHAPTER 7 Point Estimation

estimate resulting from a given sample.
1
Thus
^
m ¼ X is read as “the point estimator
of m is the sample mean
X.” The statement “the point estimate of m is 5.77” can be
written concisely as
^
m ¼ 5:77. Notice that in writing
^
y ¼ 72:5, there is no indica-
tion of how this point estimate was obtained (what statistic was used). It is
recommended that both the estimator and the resulting estimate be reported.
Example 7.1 An automobile manufacturer has developed a new type of bumper, which is
supposed to absorb impacts with less d amage than previous bumpers. The manu-
facturer has used this bumper in a sequence of 25 controlled crashes against a wall,
each at 10 mph, using one of its compact car models. Let X ¼ the number of
crashes that result in no visible damage to the automobile. The parameter to be
estimated is p ¼ the proportion of all such crashes that result in no damage
[alternatively, p ¼ P (no damage in a single crash)]. If X is observed to be
x ¼ 15, the most reasonable estimator and estimate are
estimator
^
p ¼
X
n
estimate ¼
x
n
¼
15
25
¼ :60
■
If for each parameter of interest there were only one reasonable point
estimator, there would not be muc h to point est imation. In most problems, though,
there will be more than one reasonable estimator.
Example 7.2 Reconsider the accompanying 20 observations on dielectric breakdown voltage for
pieces of epoxy resin introduced in Example 4.36 (Section 4.6).
24.46 25.61 26.25 26.42 26.66 27.15 27.31 27.54 27.74 27.94
27.98 28.04 28.28 28.49 28.50 28.87 29.11 29.13 29.50 30.88
The pattern in the normal probability plot given there is quite straight, so we now
assume that the distribution of breakdown voltage is normal with mean value m.
Because normal distributions are symmetric, m is also the median lifetime of the
distribution. The given observations are then assumed to be the result of a random
sample X
1
, X
2
,...,X
20
from this normal distribution. Consider the following
estimators and resulting estimates for m:
a. Estimator ¼
X, estimate ¼
x ¼
P
x
i
n
=
¼ 555:86=20 ¼ 27:793
b. Estim ator ¼
e
X, estimate ¼
e
x ¼ð27:94 þ 27:98Þ=2 ¼ 27:960
c. Estimator ¼
X
e
¼½min X
i
ðÞþmax X
i
ðÞ=2 ¼ the midrange, (average o f the two
extreme lifetimes), estimate ¼ [min(x
i
)+max(x
i
)]/2 ¼ (24.46 þ 30.88)/2
¼ 27.670
d. Estim ator ¼
X
trð10Þ
, the 10% trimmed mean (discard the smallest and largest
10% of the sample and then average),
estimate ¼
x
trð10Þ
¼
555:86 24:46 25:61 29:50 30: 88
16
¼ 27:838
1
Following earlier notation, we could use
^
Y (an uppercase theta) for the estimator, but this is cumber-
some to write.
7.1 General Concepts and Criteria
333

Each one of the estimators (a)–(d) uses a different measure of the center
of the sample to estimate m. Which of the estimates is closest to the true value?
We cannot answer this without knowing the true value. A question that can
be answered is, “Which estimator, when used on other samples of X
i
’s, will tend
to produce estimates closest to the true value?” We will shortly consider this type of
question.
■
Example 7.3 Studies have shown that a calorie-restricted diet can prolong life. Of course,
controlled studies are much easier to do with lab animals. Here is a random sample
of eight lifetimes (days) taken from a population of 106 rats that were fed
a restricted diet (from “Tests and Confidence Sets for Comparing Two Mean
Residual Life Functions,” Biometrics, 1988: 103–115)
716 1144 1017 1138 389 1221 530 958
Let X
1
,...,X
8
denote the lifetimes as random variables, before the observed values
are available. We want to estimate the population variance s
2
. A natural estimator
is the sample variance:
^
s
2
¼ S
2
¼
P
ðX
i
XÞ
2
n 1
¼
P
X
2
i
P
X
i
ðÞ
2
=n
n 1
The correspo nding estimate is
^
s
2
¼ s
2
¼
P
x
2
i
P
x
i
ðÞ
2
=8
7
¼
6;991;551 ð7113Þ
2
=8
7
¼
667;205
7
¼ 95;315
The estimate of s would then be
^
s ¼ s ¼
ffiffiffiffiffiffiffiffiffiffiffiffiffiffi
95;315
p
¼ 309
An alternative estimator would result from using divisor n instead of n–1
(i.e., the average squared deviation):
^
s
2
¼
P
ðX
i
XÞ
2
n
estimate ¼
667;205
8
¼ 83; 401
We will indicate shortly why many statisticians prefer S
2
to the estimator with
divisor n.
■
In the best of all possible worlds, we could find an est imator
^
y for which
^
y ¼ y always. However,
^
y is a function of the sample X
i
’s, so it is a random
variable. For some samples,
^
y will yield a value larger than y, whereas for other
samples
^
y will underestimate y. If we write
^
y ¼ y þ error of estimation
then an accurate estimator would be one resulting in small estimation errors, so that
estimated values will be near the true valu e.
Mean Squared Error
A popular way to quantify the idea of
^
y being close to y is to consider the squared
error ð
^
y yÞ
2
. Another possibility is the absolute error j
^
y yj, but this is more
334 CHAPTER 7 Point Estimation

difficult to work with mathematically. For some samples,
^
y will be quite close to y
and the resulting squared error will be very small, whereas the squared error will be
quite large whenever a sample produces an estimate
^
y that is far from the target.
An omnibus measure of accuracy is the mean squared error (expected squared
error), which entails averaging the squared error over all possible samples and
resulting estimates.
DEFINITION
The mean squared error of an estimator
^
y is E½ð
^
y yÞ
2
:
A usef ul result when evaluating mean squared error is a consequence of the
following rearrangement of the shortcut for evaluat ing a variance V(Y):
VðYÞ¼EY
2
EðYÞ½
2
) EY
2
¼ VðYÞþ EðYÞ½
2
That is, the expected value of the square of Y is the variance plus the square of
the mean value. Letting Y ¼
^
y y, the estimation error, the left-hand side is just
the mean squared error. The first term on the right-hand side is Vð
^
y yÞ¼Vð
^
yÞ
since y is just a constant. The second term involves Eð
^
y yÞ¼Eð
^
yÞy, the
difference between the expected value of the estimator and the value of the
parameter. This difference is called the bias of the estimator. Thus
MSE ¼ Vð
^
yÞþ½Eð
^
yÞy
2
¼ variance of estimator þ biasðÞ
2
Example 7.4
(Example 7.1
continued)
Consider once again estimating a population proportion of “successes” p. The
natural estimator of p is the sample proportio n of successes
^
p ¼ X=n. The number
of successes X in the sample has a binomial distribut ion with parameters n and p,so
E(X) ¼ np and V(X) ¼ np(1 p). The expected value of the estimator is
Eð
^
pÞ¼E
X
n
¼
1
n
EðX Þ¼
1
n
np ¼ p
Thus the bias of
^
p is p p ¼ 0, giving the mean squared error as
E½ð
^
p pÞ
2
¼Vð
^
pÞþ0
2
¼ V
X
n
¼
1
n
2
VðXÞ¼
pð1 pÞ
n
Now consider the alternative estimator
^
p ¼ðX þ 2Þ=ðn þ 4Þ . That is, add two
successes and two failures to the sample and then calculate the sample proportion
of successes. One intuitive justification for this estimator is that
X
n
:5
¼
X :5n
n
X þ 2
n þ 4
:5
¼
X :5n
n þ 4
from which we see that the alternative estimator is always somewhat closer to .5
than is the usual estimator. It seems particularly reasonable to move the estimate
toward .5 when the number of successes in the sample is close to 0 or n. For
example, if there are no successes at all in the sample, is it sensible to estimate the
population proportion of successes as zero, especially if n is small?
7.1 General Concepts and Criteria 335
The bias of the alternative estimator is
E
X þ 2
n þ 4
p ¼
1
n þ 4
EðX þ 2Þp ¼
np þ 2
n þ 4
p ¼
2=n 4p=n
1 þ 4=n
This bias is not zero unless p ¼ .5. However, as n increases the numerator
approaches zero and the denominator approaches 1, so the bias approaches zero.
The variance of the estimator is
V
X þ 2
n þ 4
¼
1
ðn þ 4Þ
2
VðX þ 2 Þ¼
VðXÞ
ðn þ 4Þ
2
¼
npð1 pÞ
ðn þ 4Þ
2
¼
pð1 pÞ
n þ 8 þ 16=n
This variance approaches zero as the sample size increases. The mean
squared error of the alternative estimator is
MSE ¼
pð1 pÞ
n þ 8 þ 16=n
þ
2=n 4p=n
1 þ 4=n
2
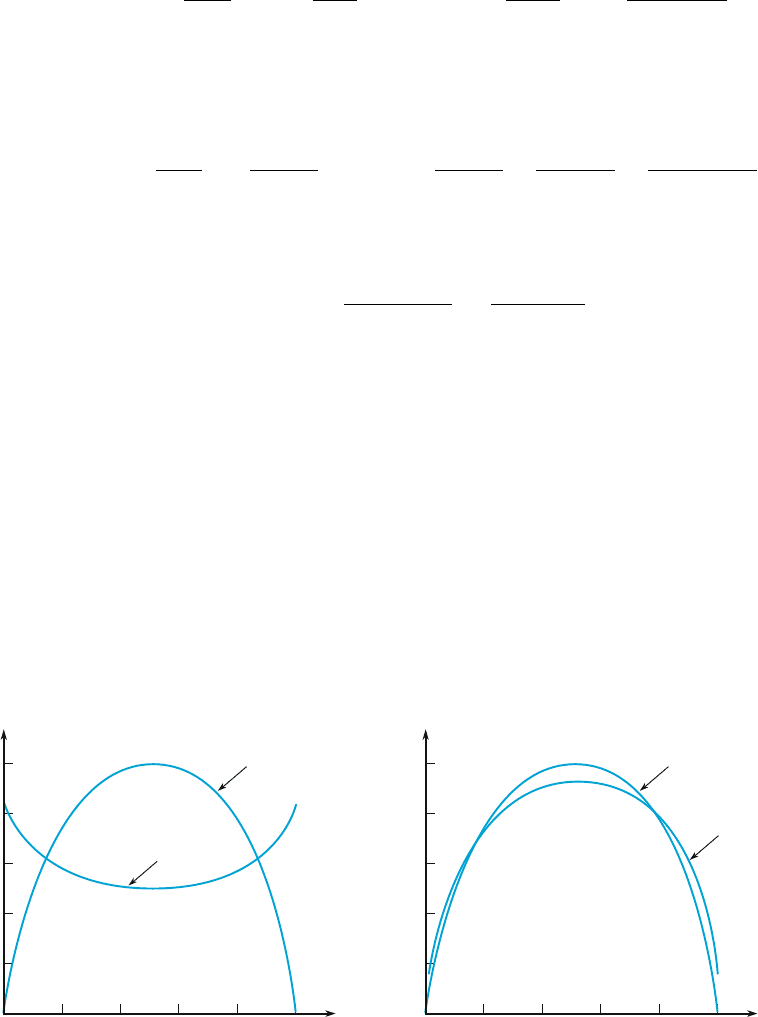
So how does the mean squared error of the usual estimator, the sample
proportion, compare to that of the alternative estimator? If one MSE were smaller
than the other for all values of p, then we could say that one estimator is always
preferred to the other (using MSE as our criterion). But as Figure 7.1 shows, this is
not the case at least for the sample sizes n ¼ 10 and n ¼ 100, and in fact is not true
for any other sample size.
According to Figure 7.1 , the two MSE’s are quite different when n is small.
In this case the alternative estimator is better for values of p near .5 (since it moves
the sam ple proportion toward .5) but not for extreme values of p. For large n the two
MSE’s are quite similar, but again neither dominates the other.
.010
.005
0
.020
.015
.025
0 .2.4.6.81.0 0 .2.4.6.81.0
MSE
ab
p
.0010
.0005
0
.0020
.0015
.0025
MSE
p
alternative
usual
usual
alternative
n = 10 n = 100
Figure 7.1 Graphs of MSE for the usual and alternative estimators of
p
■
336
CHAPTER 7 Point Estimation
Seeking an estimator whose mean squared error is smaller than that of
every other estimator for all values of the parameter is generally too ambitious
a goal. One common approach is to restrict the class of estimators under
consideration in some way, and then seek the estimator that is best in that restricted
class. A very popular restriction is to impose the condition of unbiasedness.
Unbiased Estimators
Suppose we have two measuring instruments; one instrument has been accurately
calibrated, but the other systematically gives readings smaller than the true value
being measured. When each instrument is used repeatedly on the same object,
because of measurement error, the observed measurements will not be identical.
However, the measurements produced by the first instrument will be distributed
about the true value in such a way that on average this instrument measures what it
purports to measure, so it is called an unbiased instrument. The second instrumen t
yields observations that have a systematic error component or bias.
DEFINITION
A point estimator
^
y is said to be an unbiased estimator of y if E (
^
y) ¼ y for
every possible value of y.If
^
y is not unbiased, the difference Eð
^
yÞy is
called the bias of
^
y.
That is,
^
y is unbiased if its probability (i.e., sampling) distribution is always
“centered” at the true value of the parameter. Suppose
^
y is an unbiased estimator;
then if y ¼ 100, the
^
y sampling distribution is centered at 100; if y ¼ 27.5, then
the
^
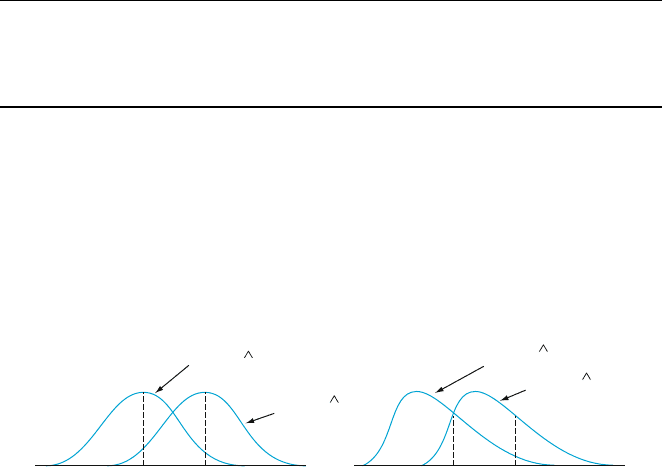
y sampling distribution is centered at 27.5, and so on. Figure 7.2 pictures the
distributions of several biased and unbiased estimators. Note that “centered”
here means that the expected value, not the median, of the distribution of
^
y
is equal to y.
It may seem as though it is necessary to know the value of y (in which case
estimation is unnecessary) to see whether
^
y is unbiased. This is usually not the case,
however, because unbiasedness is a general property of the estimator’s sampling
distribution—where it is centered—which is typically not dependent on any partic-
ular parameter value. For example, in Example 7.4 we showed that Eð
^
pÞ¼p
when
^
p is the sample proportion of successes. Thus if p ¼ .25, the sampling
⎧
⎨
⎩
⎧
⎨
⎩
Bias of q
1
qq
Bias of q
1
pdf of q
2
pdf of q
2
pdf of q
1
pdf of q
1
Figure 7.2 The pdf’s of a biased estimator
^
y
1
and an unbiased estimator
^
y
2
for a
parameter y
7.1 General Concepts and Criteria 337