Devore J.L., Berk K.N. Modern Mathematical Statistics with Applications
Подождите немного. Документ загружается.


H
0
true ) E
SSTr
s
2
¼ I 1 ) E
SSTr
I 1
¼ s
2
Whenever the ratio of a sum of squares over s
2
has a chi-squared distribution,
we divide the sum of squares by its degrees of freedom to obtain a mean square
(“mean” is used in the sense of “average ”).
DEFINITION
The mean square for treatments is MSTR ¼ SSTr/(I 1) and the mean
square for error is MSE ¼ SSE/[I(J 1)].
Notice that upper case X’s and S’s are used in defining the sums of squares and thus
the mean squares, so the SS’s and MS’s are statistics (random variables). We will
follow tradition and als o use MSTr and MSE (rather than mstr and mse) to denote
the calculated values of these statistics.
The foregoing results concerning expected values can now be restated:
E MSEðÞ¼s
2
; that is, MSE is an unbiased estimator of s
2
H
0
true ) EðMSTrÞ¼s
2
; so MSTr is an unbiased estimator of s
2
MSTr is unbiased for s
2
when H
0
is true, but what about when H
0
is false? It can be
shown (Exercise 10) that in this case, E(MSTr) > s
2
. This is because the X
i
’s tend
to differ more from each other, and theref ore from the grand mea n, whe n the m
i
’s
are not identical than when they are the same.
The F Test
The test statistic is the ratio F ¼ MSTr/ MSE. F is a ratio of two estimators of s
2
.
The numerator (the between-samples estimator), MSTr, is unbiased when H
0
is true
but tends to overestimate s
2
when H
0
is false, whereas the denominator (the within-
samples estimator), MSE, is unbiased regardless of the status of H
0
. Thus if H
0
is
true the F ratio should be reas onably close to 1, but if the m
i
’s differ considerably
from each other, F shoul d greatly exceed 1. Thus a valu e of F considerably
exceeding 1 argues for rejection of H
0
.
In Section 6.4 we introduced a family of probability distributions called F
distributions. If Y
1
and Y
2
are two independent chi-squared random variables with n
1
and n
2
df, respectively, then the ratio F ¼ (Y
1
/n
1
)/(Y
2
/n
2
)hasanF distribution with n
1
numerator df and n
2
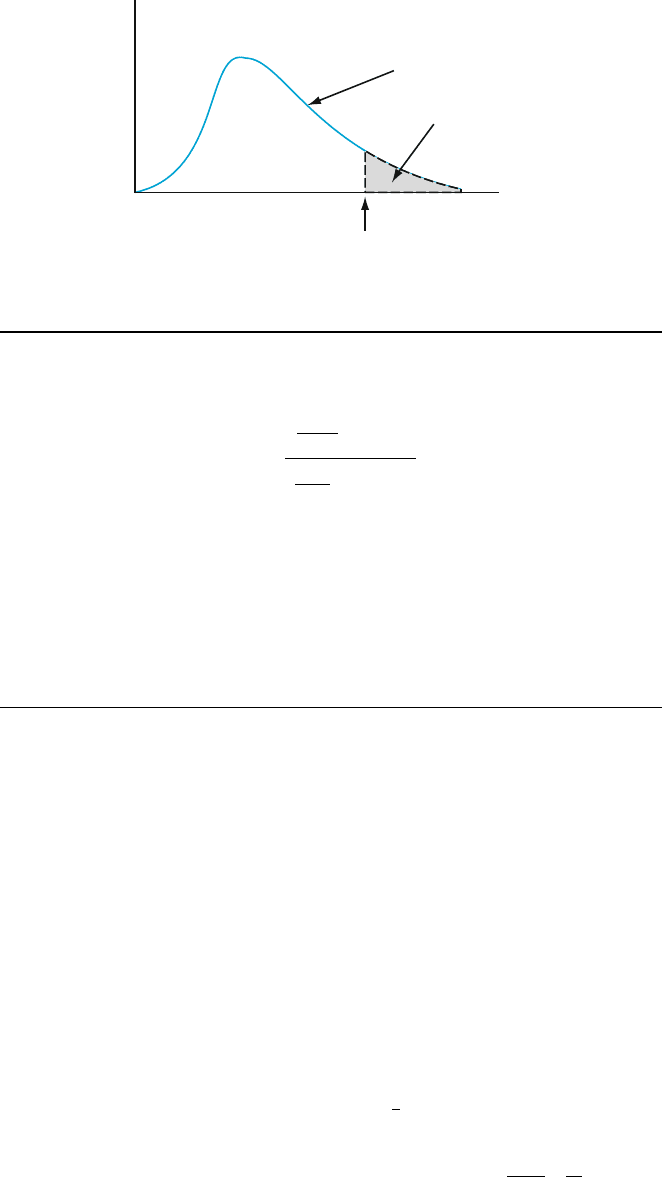
denominator df. Figure 11.3 shows an F density curve and
corresponding upper-tail critical value F
a;n
1
;n
2
. Appendix Table A.8 gives these
critical values for a ¼ .10, .05, .01, and .001. Values of n
1
are identified with different
columns of the table and the rows are labeled with various values of n
2
. For example,
the F critical value that captures upper-tail area .05 under the F curve with n
1
¼ 4and
n
2
¼ 6isF
.05,4,6
¼ 4.53, whereas F
.05,6,4
¼ 6.16 (so don’t accidentally switch
numerator and denominator df!). The key theoretical result that justifies the test
procedure is that the test statistic F has an F distribution when H
0
is true.
558 CHAPTER 11 The Analysis of Variance
THEOREM
The test statistic in single-factor ANOVA is F ¼ MSTr/MSE. We can write
this as
F ¼
SSTr
s
2
=ðI 1Þ
SSE
s
2
=IðJ 1Þ
When H
0
is true, the previous theorem implies that the numerator and
denominator of F are independent chi-squared variables divided by their
df’s, in which case F has an F distribution with I 1 numerator df and
I(J1) denominator df. The rejection region f F
a,I1,I(J1)
then specifies
an upper-tailed test that has the desired significance level a. The P-value for
an upper-tailed F test is the area under the relevant F curve (the one with
correct numerator and denominator df’s) to the right of the calculated f.
Refer to Section 10.5 to see how P-value information for F tests can be obtained
from the table of F critical values. Alternatively, statistical software packages will
automatically include the P-value with ANOVA output.
Computational Formulas
The calculations leading to f can be done efficiently by using formulas simi lar to the
computing formula for the numerator of the sample variance s
2
from Section 1.4.
The first two computational formulas here are essentially repetitions of that for-
mula with new notation. Let x
i
represent the sum (not the average, since there is no
overbar) of the x
ij
’s for fixed i (the total of the J observations in the ith sample).
Similarly, let x
::
denote the sum of all IJ observations (the grand total). We also
need a third sum of squares in addition to SSTr and SSE.
Sum of Squares df Definition Computing Formula
Total ¼ SST IJ 1
P
i
P
j
ðx
ij
x
Þ
2
P
i
P
j
x
2
ij
x
2
=IJ
Treatment ¼ SSTr I 1
P
i
P
j
ð
x
i
x
Þ
2
¼ J
P
i
ð
x
i
x
Þ
2
P
i
x
2
i
J
x
2
IJ
Error ¼ SSE I(J 1)
P
i
P
j
x
ij
x
i
2
SST SSTr
Shaded area = a
F curve for n
1
and n
2
d
f
F
a,n
1
,n
2
Figure 11.3 An
F
curve and critical value
F
a
;
n
1
;
n
2
11.1 Single-Factor ANOVA 559

Both SST and SSTr involve x
2
=IJ, which is called either the correction factor or the
correction for the mean. SST results from squaring each observation, adding these
squares, and then subtracting the correction factor. Calculation of SSTr entails
squaring each sample total (each row total from the data table), summing these
squares, dividing the sum by J, and again subtracting the correction factor. SSTr is
subtracted from SST to give SSE (it must be the case that SST SSTr), after
which MSTr, MSE, and finally f are calcul ated.
The computational formula for SSE is a consequence of the fundamental
ANOVA identity
SST ¼ SSTr þ SSE ð11:1Þ
The identity implies that once any two of the SS’s have been calculated, the
remaining one is easily obtained by addition or subtraction. The two that are
most easily calculated are SST and SSTr. The proof of the identity follow s from
squaring both sides of the relationship
x
ij
x
¼ x
ij
x
i
þ
x
i
x
ðÞ ð11:2Þ
and summing over all i and j. This gives SST on the left and SSTr and SSE as the
two extreme terms on the right; the cross-product term is easily seen to be zero
(Exercise 9).
The interpretation of the fundamental identity is an important aid to under-
standing ANOVA. SST is a measure of total vari ation in the data – the sum of all
squared deviations about the grand mean. The identity says that this total variation
can be partitioned into two pieces; it is this decompos ition of SST that gives rise to
the name “analysis of variance” (more appropriately, “analysis of variation”). SSE
measures variation that would be present (within samples) even if H
0
were true and
is thus the part of total variation that is unexplained by the status of H
0
(true or
false). SSTr is the part of total variation (between samples) that can be explained by
possible differences in the m
i
’s. If explained variation is large relative to unex-
plained variat ion, then H
0
is rejected in favor of H
a
.
Once SSTr and SSE are computed, each is divided by its associated df to
obtain a mean square (mean in the sense of average). Then F is the ratio of the two
mean squares.
MSTr ¼
SSTr
I 1
MSE ¼
SSE
IðJ 1Þ
F ¼
MSTr
MSE
ð11:3Þ
The computations are often summarized in a tabular format, called an ANOVA
table, as displayed in Table 11.2. Tables produced by statistical software custom-
arily include a P-value column to the right of f.
560 CHAPTER 11 The Analysis of Variance

Example 11.2 The accompanying data resulted from an experiment comparing the degree of
soiling for fabric copolymerized with three different mixtures of methacrylic acid
(similar data appea red in the article “Chemical Factors Affecting Soiling and Soil
Release from Cotton DP Fabric,” Am. Dyest. Rep., 1983: 25–30).
Mixture Degree of Soiling x
i
x
i
1 .56 1.12 .90 1.07 .94 4.59 .918
2 .72 .69 .87 .78 .91 3.97 .794
3 .62 1.08 1.07 .99 .93
4.69 .938
x
··
¼ 13.25
Let m
i
denote the true average degree of soiling when mixture i is used (i ¼ 1, 2, 3).
The null hypothesis H
0
: m
1
¼ m
2
¼ m
3
states that the true average degree of soiling
is identical for the three mixtures. We will carry out a test at significance level .01
to see whether H
0
should be rejected in favor of the assertion that true average
degree of soiling is not the same for all mixtures. Since I –1 ¼ 2 and I(J –1) ¼ 12,
the F critical value for the rejection region is F
.01,2,12
¼ 6.93. Squaring each of the
15 obser vations and summing gives
PP
x
2
ij
¼ð:56Þ
2
þð1:12Þ
2
þþð:93Þ
2
¼
12:1351. The values of the three sums of squares are
SST ¼ 12:1351 13:25
2
=15 ¼ 12: 1351 11:7042 ¼ :4309
SSTr ¼
1
5
½4:59
2
þ 3:97
2
þ 4:69
2
11:7042
¼ 11:7650 11:7042 ¼ :0608
SSE ¼ :4309 :0608 ¼ :3701
The remaining computations are sum marized in the accompanying ANOVA table.
Because f ¼ .99 is not at least F
.01,2,12
¼ 6.93, H
0
is not rejected at significance
level .01. The mixtures appear to be indistinguishable with respect to degree of
soiling (F
:10;2;12
¼ 2:81 ) P value>:10).
Source of Variation df Sum of Squares Mean Square f
Treatments 2 .0608 .0304 .99
Error 12 .3701 .0308
Total 14 .4309
■
When the F test causes H
0
to be rejected, the experimenter will often be
interested in further analysis to decide which m
i
’s differ from which others. Proce-
dures for doing this are called multiple comparison procedures, and several are
described in the next two sections.
Table 11.2 An ANOVA table
Source of Variation df Sum of Squares Mean Square f
Treatments I1 SSTr MSTr ¼ SSTr/(I 1) MSTr/MSE
Error I(J1) SSE MSE ¼ SSE/[I(J1)]
Total IJ1 SST
11.1 Single-Factor ANOVA 561

Testing for the Assumption of Equal Variances
One of the two assumptions for ANOVA is that the populations have equal
variances. If the likelihood ratio principle is applied to the problem of testing for
equal variances for normal data, then the result is Bartlett’s test. This is a generali-
zation of the F test for equal variances given in Section 10.5, and it is very sensitive
to the normality assumption.
The Levene test is much less sensitive to the assumption of normality. Essen-
tially, this test involves performing an ANOVA on the absolute values of the residuals,
which are the deviations x
ij
x
i
; j ¼ 1 ; 2; ...; J for each i ¼ 1, 2,..., I.That
is, a residual is the difference between an observation and its row mean (mean for
its sample). The Levene test performs an ANOVA F test using the absolute residuals
jx
ij
x
i
jin place of x
ij
. The idea is to use absolute residuals to compare the variability
of the samples.
Example 11.3
(Example 11.2
continued)
Consider the data of Example 11.2. Here are the observat ions again along with the
means and the absolute values of the residua ls.
x
i
Sjx
ij
x
i
j
Mixture 1 .56 1.12 .90 1.07 .94 .918
jresidual 1j .358 .202 .018 .152 .022 .752
Mixture 2 .72 .69 .87 .78 .91 .794
jresidual 2j .074 .104 .076 .014 .116 .384
Mixture 3 .62 1.08 1.07 .99 .93 .938
jresidual 3j .318 .142 .132 .052 .008
.652
1.788
Now apply ANOVA to the absolute residuals. The sum of all 15 squared absolute
residuals is .3701, so
SST ¼ :3701 1:788
2
=15 ¼ :3701 :2131 ¼ :1570
SSTr ¼
1
5
:752
2
þ :384
2
þ :652
2
:2131 ¼ :2276 :2131 ¼ :0145
SSE ¼ :1570 :0145 ¼ :1425
f ¼
:0145=2
:1425=12
¼ :61
Compare .61 to the critical value F
.10,2,12
¼ 2.81. Because .61 is muc h smaller than
2.81, there is no reason to doubt that the variances are equal.
■
Given that the absolute residuals are not normally distributed, it might seem
like a dumb idea to do an ANOVA on them. However, the ANOVA F-test is robust
to the assumption of normality, meaning that the assumpt ion can be relaxed
somewhat. Thus, the Levene test works in spite of the normality assumption.
Note also that the residuals are dependent because they sum to zero within each
sample (row), but this again is not a problem if the samples are of sufficient size (If
J ¼ 2, why does each sample have both absolute residuals the same?). A sample
size of 10 is sufficient for excellent accuracy in the Levene test, but smaller samples
can still give useful results when only approximate critical values are needed. This
occurs when the test value is either far beyond the nominal critical value or well
below it, as in Example 11.3.
562 CHAPTER 11 The Analysis of Variance

Some software packages perform the Levene test, but they will not neces sarily
get the same answer becau se they do not necessarily use absolute deviations from
the mean. For example, MINITAB uses absolute residuals with respect to the
median, an especially good idea in case of skewed data. By default, SAS uses the
squared deviations from the mean, although the absolute deviations from the mean
can be requested. SAS also allows absolute deviations from the median (as the BF
test, because Brown and Forsythe studied this procedure).
The ANOVA F-test is pretty robus t to both the normality and constant
variance assumptions. The test will still work under moderate departures from
these two assumptions. When the sample sizes are all the same, as we are assuming
so far, the test is especially insensitive to unequal variances. Also, there is a
generalization of the two-sample t-test of Section 10.2 for more than two samples,
and it does not demand equal variances. This test is available in JMP, R, and SAS.
If there is a major violation of assumptions, then the situation can sometimes
be corrected by a data transformation, as discussed in Section 11.3. Alternatively,
the bootstrap can be used, by generalizing the method of Section 10.6 from two
groups to several . There is also a nonparametric test (no normality required), as
discussed in Exercise 37 of Chapter 14.
Exercises Section 11.1 (1–10)
1. An experiment to compare I ¼ 5 brands of golf
balls involved using a robotic driver to hit J ¼ 7
balls of each brand. The resulting between-sample
and within-sample estimates of s
2
were MSTr ¼
123.50 and MSE ¼ 22.16, respectively.
a. State and test the relevant hypotheses using a
significance level of .05.
b. What can be said about the P-value of the test?
2. The lumen output was determined for each of I ¼ 3
different brands of 60-watt soft-white lightbulbs,
with J ¼ 8 bulbs of each brand tested. The sums
of squares were computed as SSE ¼ 4773.3 and
SSTr ¼ 591.2. State the hypotheses of interest
(including word definitions of parameters), and
use the F test of ANOVA (a ¼ .05) to decide
whether there are any differences in true average
lumen outputs among the three brands for this type
of bulb by obtaining as much information as possi-
ble about the P-value.
3. In a study to assess the effects of malaria infection on
mosquito hosts (“Plasmodium cynomolgi: Effects of
Malaria Infection on Laboratory Flight Performance
of Anopheles stephensi Mosquitos,” Exp. Parasitol.,
1977: 397–404), mosquitoes were fed on either infec-
tive or noninfective rhesus monkeys. Subsequently
the distance they flew during a 24-h period was
measured using a flight mill. The mosquitoes were
divided into four groups of eight mosquitoes each:
infective rhesus and sporozites present (IRS),
infective rhesus and oocysts present (IRD), infective
rhesus and no infection developed (IRN), and
noninfective (C). The summary data values are
x
1
¼ 4:39 IRSðÞ,
x
2
¼ 4:52 IRDðÞ,
x
3
¼
5:49 IRNðÞ,
x
4
¼ 6:36 CðÞ,
x
¼ 5:19, and
PP
x
2
ij
¼ 911:91. Use the ANOVA F test at level
.05 to decide whether there are any differences
between true average flight times for the four
treatments.
4. Consider the following summary data on the mod-
ulus of elasticity ( 10
6
psi) for lumber of three
different grades (in close agreement with values in
the article “Bending Strength and Stiffness of Sec-
ond-Growth Douglas-Fir Dimension Lumber”
(Forest Products J., 1991: 35–43), except that the
sample sizes there were larger):
Grade J
x
i
s
i
1 10 1.63 .27
2 10 1.56 .24
3 10 1.42 .26
Use this data and a significance level of .01 to test
the null hypothesis of no difference in mean modu-
lus of elasticity for the three grades.
5. The article “Origin of Precambrian Iron Forma-
tions” (Econ. Geol., 1964: 1025–1057) reports the
11.1 Single-Factor ANOVA 563

following data on total Fe for four types of iron
formation (1 ¼ carbonate, 2 ¼ silicate, 3 ¼ mag-
netite, 4 ¼ hematite).
1: 20.5 28.1 27.8 27.0 28.0
25.2 25.3 27.1 20.5 31.3
2: 26.3 24.0 26.2 20.2 23.7
34.0 17.1 26.8 23.7 24.9
3: 29.5 34.0 27.5 29.4 27.9
26.2 29.9 29.5 30.0 35.6
4: 36.5 44.2 34.1 30.3 31.4
33.1 34.1 32.9 36.3 25.5
Carry out an analysis of variance F test at signifi-
cance level .01, and summarize the results in an
ANOVA table.
6. In an experiment to investigate the performance of
four different brands of spark plugs intended for use
on a 125-cc two-stroke motorcycle, five plugs of
each brand were tested for the number of miles (at a
constant speed) until failure. The partial ANOVA
table for the data is given here. Fill in the missing
entries, state the relevant hypotheses, and carry out
a test by obtaining as much information as you can
about the P-value.
Source df Sum of squares Mean square f
Brand
Error 14,713.69
Total 310,500.76
7. A study of the properties of metal plate-connected
trusses used for roof support (“Modeling Joints
Made with Light-Gauge Metal Connector Plates,”
Forest Products J., 1979: 39–44) yielded the fol-
lowing observations on axial stiffness index (kips/
in.) for plate lengths 4, 6, 8, 10, and 12 in.:
4: 309.2 409.5 311.0 326.5 316.8 349.8 309.7
6: 402.1 347.2 361.0 404.5 331.0 348.9 381.7
8: 392.4 366.2 351.0 357.1 409.9 367.3 382.0
10: 346.7 452.9 461.4 433.1 410.6 384.2 362.6
12: 407.4 441.8 419.9 410.7 473.4 441.2 465.8
a. Check the ANOVA assumptions with a normal
plot and a test for equal variances.
b. Does variation in plate length have any effect
on true average axial stiffness? State and
test the relevant hypotheses using analysis
of variance with a ¼ .01. Display your
results in an ANOVA table. [Hint:
PP
x
2
ij
¼ 5; 241; 420:79.]
8. Six samples of each of four types of cereal grain
grown in a certain region were analyzed to deter-
mine thiamin content, resulting in the following
data (mg/g):
Wheat 5.2 4.5 6.0 6.1 6.7 5.8
Barley 6.5 8.0 6.1 7.5 5.9 5.6
Maize 5.8 4.7 6.4 4.9 6.0 5.2
Oats 8.3 6.1 7.8 7.0 5.5 7.2
a. Check the ANOVA assumptions with a normal
probability plot and a test for equal variances.
b. Test to see if at least two of the grains differ
with respect to true average thiamin content.
Use an a ¼ .05 test based on the P-value
method.
9. Derive the fundamental identity SST ¼ SSTr +
SSE by squaring both sides of Equation 11.2
and summing over all i and j.[Hint: For any
particular i,
P
j
ðx
ij
x
i
Þ¼0.]
10. In single-factor ANOVA with I treatments and
J observations per treatment, let m ¼ (1/I)Sm
i
.
a. Express Eð
X
Þ in terms of m.[Hint: X
¼
ð1=IÞ
P
X
i
]
b. Compute Eð
X
2
i
Þ.[Hint: For any rv Y; EY
2
ðÞ¼
VðYÞþ EðYÞ½
2
.]
c. Compute Eð
X
2
Þ.
d. Compute E (SSTr) and then show that
EðMSTrÞ¼s
2
þ
J
I1
P
ðm
i
mÞ
2
e. Using the result of part (d), what is E(MSTr)
when H
0
is true? When H
0
is false, how does
E(MSTr) compare to s
2
?
11.2
Multiple Comparisons in ANOVA
When the computed value of the F statistic in single-factor ANOVA is not significant,
the analysis is terminated because no differences among the m
i
’s have been identi-
fied. But when H
0
is rejected, the investigator will usually want to know which of the
564 CHAPTER 11 The Analysis of Variance

m
i
’s are different from each other. A method for carrying out this further analysis is
called a multiple comparisons procedure.
Several of the most frequently used such procedures are based on the
following central idea. First calculate a confidence interval for each pairwise
difference m
i
m
j
with i < j.ThusifI ¼ 4, the six required CIs would be for
m
1
m
2
(but not also for m
2
m
1
), m
1
m
3
, m
1
m
4
, m
2
m
3
, m
2
m
4
, and m
3
m
4
.
Then if the interval for m
1
m
2
does not include 0, conclude that m
1
and m
2
differ
significantly from each other; if the interval does include 0, the two m’s are judged
not significantly different. Following the same line of reasoning for each of the
other intervals, we end up being able to judge for each pair of m’s whether or not
they differ significantly from each other.
The procedures based on this idea differ in the method used to calculate the
various CIs. Here we present a popular method that controls the simultaneous
confidence level for all I(I – 1)/2 intervals calculated.
Tukey’s Procedure
Tukey’s procedure involves the use of another probability distribution.
DEFINITION
Let Z
1
, Z
2
,..., Z
m
be m independent standard normal rv’s and W be a chi-
squared rv, independent of the Z
i
’s, with n df. Then the distribu tion of
Q ¼
max jZ
i
Z
j
j
ffiffiffiffiffiffiffiffiffi
W=n
p
¼
maxðZ
1
; ...; Z
m
ÞminðZ
1
; ...; Z
m
Þ
ffiffiffiffiffiffiffiffiffi
W=n
p
is called the studentized range distribution. The distribution has t wo
parameters, m ¼ the number of Z
i
’s a nd n ¼ denominator df. We denote
the c ritical value that captures upper-tail area a under the density curve of
Q by Q
a,m,n
. A tabulation of these crit ical values appears in Appendix
Table A.9.
The word “range” reflects the fact that the numerator of Q is indeed the range of the
Z
i
’s. Dividing the range by
ffiffiffiffiffiffiffiffiffi
W=v
p
is the same as dividing each individual Z
i
by
ffiffiffiffiffiffiffiffiffi
W=v
p
. But Z
i
=
ffiffiffiffiffiffiffiffiffi
W=v
p
has a (Student) t distribution (Student was the pseudonym
used by the statistician Gos sett, who derived the t distribution but published his
work using the pseudonym “Student” because his employer, the Guinness Brewing
Co., would not permit publication under his own name.); “studentizing” refers to
the division by
ffiffiffiffiffiffiffiffiffi
W=v
p
.SoQ is actually the range of m variables that have the
t distribution (but they are not independent because the denominator is the same for
each one).
The identification of the quantities in the definition with single-factor
ANOVA is as follows:
Z
i
¼
X
i
m
i
s=
ffiffiffi
J
p
m ¼ IW¼
SSE
s
2
¼
IðJ 1ÞMSE
s
2
n ¼ IðJ 1Þ
11.2 Multiple Comparisons in ANOVA 565

Substituting into Q gives
Q ¼
max
X
i
m
i
s=
ffiffiffi
J
p
X
j
m
j
s=
ffiffiffi
J
p
ffiffiffiffiffiffiffiffiffiffiffiffiffiffiffiffiffiffiffiffiffiffiffiffiffiffiffiffiffiffiffiffiffiffiffiffiffiffiffiffiffiffiffiffiffiffiffi
IðJ 1ÞMSE
s
2
½IðJ 1Þ
=
r
¼
max X
i
X
j
ðm
i
m
j
Þ
ffiffiffiffiffiffiffiffiffiffiffiffiffiffiffi
MSE J
=
p
In this latter expression for Q, the denominator
ffiffiffiffiffiffiffiffiffiffiffiffiffiffiffi
MSE=J
p
is the estimated standard
deviation of
X
i
m
i
. By definition of Q and Q
a
, P(Q > Q
a
) ¼ a,so
1 a ¼ P
max X
i
X
j
ðm
i
m
j
Þ
ffiffiffiffiffiffiffiffiffiffiffiffiffiffiffi
MSE J
=
p
Q
a;I;IðJ1Þ
!
¼ P
jX
i
X
j
ðm
i
m
j
Þj
ffiffiffiffiffiffiffiffiffiffiffiffiffiffiffi
MSE J
=
p
Q
a;I;IðJ1Þ
for all i; j
!
¼ P Q
a
ffiffiffiffiffiffiffiffiffiffiffiffiffiffiffi
MSE J
=
p
X
i
X
j
ðm
i
m
j
ÞQ
a
ffiffiffiffiffiffiffiffiffiffiffiffiffiffiffi
MSE J
=
p
for all i; j
¼ P
X
i
X
j
Q
a
ffiffiffiffiffiffiffiffiffiffiffiffiffiffiffi
MSE J
=
p
m
i
m
j
X
i
X
j
þ Q
a
ffiffiffiffiffiffiffiffiffiffiffiffiffiffiffi
MSE J
=
p
for all i; j
(whew!). Replacing X
i
; X
j
, and MSE by the values calculated from the data gives
the following result.
PROPOSITION
For each i < j, form the interval
x
i
x
j
Q
a;I;IJ1ðÞ
ffiffiffiffiffiffiffiffiffiffiffiffiffiffiffi
MSE=J
p
ð11:4Þ
There are
I
2
¼ IðI 1Þ=2 such intervals: one for m
1
m
2
, another for
m
1
m
3
, ..., and the last for m
I1
m
I
. Then the simultaneous confidence
level that every interval includes the corresponding value of m
i
m
j
is
100(1 a)%. Notice that the second subscript on Q
a
is I, whereas the second
subscript on F
a
used in the F test is I1.
We will say more about the interpretation of “simultaneous” shortl y. Each interval
that doesn’t include 0 yields the conclusion that the corresponding values of m
i
and
m
j
are different—we say that m
i
and m
j
“differ significantly” from each other. For
purposes of deciding which m
i
’s differ significantly from which others (i.e., identi-
fying the intervals that don’t include 0) muc h of the arithmetic associated with
calculating the CI’s can be avoided. The following box gives details and d escribes
how differences can be displayed using an “underscoring pattern”.
TUKEY’S
PROCEDURE
FOR IDEN-
TIFYING SIG-
NIFICANTLY
DIFFERENT
m
i
’s
Select a, extract Q
a,I,I(J1)
from Appendix Table A.9, and calculate
w ¼ Q
a;I;IðJ1Þ
ffiffiffiffiffiffiffiffiffiffiffiffiffiffiffi
MSE J
=
p
. Then list the sample means in increasing order
and underline those pairs that differ by less than w. Any pair of sample means
not underscored by the same line corresponds to a pair of population or
treatment means that are judged significantly different. The quant ity w is
sometimes referred to as Tukey’s honestly significantly difference (HSD).
566 CHAPTER 11 The Analysis of Variance

Suppose, for example, that I ¼ 5 and that
x
2
<
x
5
<
x
4
<
x
1
<
x
3
Then
1. Con sider first the smallest mean
x
2
.If
x
5
x
2
w, proceed to step 2.
However, if
x
5
x
2
<w, connect these first two means with a line segment.
Then if possible extend this line segment even further to the right to the largest
x
i
that differs from
x
2
by les s than w (so the line may connect two, three, or even
more means).
2. Now move to
x
5
, and again extend a line segment to the largest
x
i
to its right
that differs from
x
5
by less than w (it may not be possible to draw this line, or
alternatively it may underscore just two means, or three, or even all four
remaining means).
3. Con tinue by moving to
x
4
and repeating, and then finally move to
x
1
.
To summarize, starting from each mean in the ordered list, a line segment is
extended as far to the right as possible as long as the difference between the
means is smaller than w. It is easily verified that a particular interval of the form
(11.4) will contain 0 if and only if the corresponding pair of sample means is
underscored by the sam e line segment.
Example 11.4 An experiment was carried out to compare five different brands of automobile oil
filters with respect to their ability to capture foreign material. Let m
i
denote the true
average amount of material captured by brand i filters (i ¼ 1, ..., 5) under
controlled conditions. A sample of nine filters of each brand was used, resulting
in the following sample mean amounts:
x
1
¼ 14:5,
x
2
¼ 13:8,
x
3
¼ 13:3,
x
4
¼ 14:3, and
x
5
¼ 13:1. Table 11.3 is the ANOVA table summarizing the first
part of the analysis.
Since F
.05,4,40
¼ 2.61, H
0
is rejected (decisively) at level .05. We now use Tukey’s
procedure to look for significant difference s among the m
i
’s. From Appendix Table
A.9, Q
.05,5,40
¼ 4.04 (the second subscript on Q is I and not I –1asinF), so
w ¼ 4:04
ffiffiffiffiffiffiffiffiffiffiffiffiffiffi
:088=9
p
¼ :4. After we arrange the five sample means in increasing
order, the two smallest can be connected by a line segment because they differ
by less than .4. However, this segment cannot be extended further to the right since
13:8 13:1 ¼ :7 :4. Moving one mean to the right, the pair
x
3
and
x
2
cannot
be underscored because these means differ by more than .4. Again moving to the
right, the next mean, 13.8, cannot be connected to any further to the right, and
finally the last two means can be underscored with the same line segment.
Table 11.3 ANOVA table for Example 11.4
Source of Variation df Sum of Squares Mean Square f
Treatments (brands) 4 13.32 3.33 37.84
Error 40 3.53 .088
Total 44 16.85
11.2 Multiple Comparisons in ANOVA 567