Devore J.L., Berk K.N. Modern Mathematical Statistics with Applications
Подождите немного. Документ загружается.


x
5
x
3
x
2
x
4
x
1
13.1 13.3 13.8 14.3 14.5
Thus brands 1 and 4 are not significantly different from each other, but are
significantly higher than the other three brands in their true aver age amo unts
captured. Brand 2 is significantly better than 3 and 5 but wor se than 1 and 4, and
brands 3 and 5 do not differ significantly.
If
x
2
¼ 14:15 rather than 13.8 with the same computed w, then the configu-
ration of underscored means would be
x
5
x
3
:
x
2
x
4
x
1
13.1 13.3 14.15 14.3 14.5
■
Example 11.5 A biologist wished to study the effects of ethanol on sleep time. A sample of 20 rats,
matched for age and other characteristics, was selected, and each rat was given an
oral injection having a particular concentration of ethanol per kg of body weight.
The rapid eye movement (REM) sleep time for each rat was then recorded for a
24-h period, with the following resu lts:
Treatment
(ethanol) REM time x
i
x
i
0 (control) 88.6 73.2 91.4 68.0 75.2 396.4 79.28
1 g/kg 63.0 53.9 69.2 50.1 71.5 307.7 61.54
2 g/kg 44.9 59.5 40.2 56.3 38.7 239.6 47.92
4 g/kg 31.0 39.6 45.3 25.2 22.7 163.8 32.76
x
¼ 1107.5
x
¼ 55.375
Does the data indi cate that the true average REM sleep time depends on the
concentration of ethanol? (This example is based on an experiment reported in
“Relationship of Ethanol Blood Level to REM and Non-REM Sleep Time and
Distribution in the Rat,” Life Sci., 1978: 839–846.)
The
x
i
’s differ rather substantially from each other, but there is also a great
deal of variability within each sample, so to answer the question precisely we must
carry out the ANOVA. With
PP
x
2
ij
¼ 68;697:6 and correction factor
x
2
= IJðÞ¼1107:5ðÞ
2
=20 ¼ 61; 327:8, the computing formulas yield
SST ¼ 68; 697:6 61 ; 327:8 ¼ 7369 :8
SSTr ¼
1
5
396:40
2
þ 307:70
2
þ 239:60
2
þ 163:80
2
61; 327:8
¼67; 210:2 61; 327:8 ¼ 5882:4
and
SSE ¼ 7369:8 5882:4 ¼ 1487:4
Table 11.4 is a SAS ANOVA table. The last column gives the P-value, which
is .0001. Actually, the P-value is .0000083, but SAS does not output anything lower
than .0001. It does not output .0000 because this could be misinterpreted to say that
the P-value is 0. Using a significance level of .05, we reject the null hypothesis H
0
:
m
1
¼ m
2
¼ m
3
¼ m
4
, since the given P-value ¼ .0001 < .05 ¼ a. True average
REM sleep time does appear to depend on ethanol concentration.
568 CHAPTER 11 The Analysis of Variance

There are I ¼ 4 treatme nts and 16 df for error, so Q
.05,4,16
¼ 4.05 and
w ¼ 4:05
ffiffiffiffiffiffiffiffiffiffiffiffiffiffi
93:0=5
p
¼ 17:47. Ordering the means and underscoring yields
x
4
x
3
x
2
x
1
32.76 47.92 61.54 79.28
The interpretation of this underscoring must be done with care , since we seem to
have concluded that treatments 2 and 3 do not differ, 3 and 4 do not differ, yet 2 and
4 do differ. The suggested way of expressing this is to say that although evidence
allows us to conclude that treatments 2 and 4 differ from each other, neither has
been shown to be significantly different from 3. Treatment 1 has a significantly
higher true average REM sleep time than any of the other treatments. This treat-
ment involves 0 ethanol (alcohol) and there is a trend toward less sleep with more
ethanol, although not all differences are significant.
Figure 11.4 shows SAS output from the application of Tukey’s procedure.
The Interpretation of a in Tukey’s Procedure
We stated previously that the simultaneous confidence level is controlled by
Tukey’s method. So what does “simultaneous” mean here? Consider calculating
a 95% CI for a population mean m based on a sample from that population and then
Table 11.4 SAS ANOVA table
Analysis of variance procedure
Dependent Variable: TIME
Sum of Mean
Source DF Squares Square F Value Pr
> F
Model 3 5882.35750 1960.78583 21.09 .0001
Error 16 1487.40000 92.96250
Corrected
Total 19 7369.75750
Alpha = 0.05 df = 16 MSE = 92.9625
Critical Value of Studentized Range = 4.046
Minimum Significant Difference = 17.446
Means with the same letter are not significantly different.
Tukey Grouping Mean N TREATMENT
A 79.280
5 0(control)
B 61.540
5 1 gm/kg
B
C
B 47.920
5 2 gm/kg
C
C
32.760
5 4 gm/kg
Figure 11.4 Tukey’s method using SAS ■
11.2 Multiple Comparisons in ANOVA 569

a 95% CI for a population proportion p based on another sample selected indepen-
dently of the first one. Prior to obtaining data, the probability that the first interval
will include m is .95, and this is also the probability that the second interval will
include p. Because the two samples are selected independently of each other, the
probability that both intervals will include the values of the respective parameters is
(.95)(.95) ¼ (.95)
2
.90. Thus the simultaneous or joint confidence level for the
two intervals is roughly 90%—if pairs of intervals are calculated over and over
again from independent samples, in the long run roughly 90% of the time the first
interval will capture m and the second will include p. Similarly, if three CIs are
calculated based on independent samples, the simultaneous confidence level will
be 100(.95)
3
% 86%. Clearly, as the number of intervals increases, the simulta-
neous confidence level that all intervals capture their respective parameters will
decrease.
Now suppose that we want to maintain the simultaneous confidence level at
95%. Then for two independent samples, the individual confidence level for each
would have to be 100
ffiffiffiffiffiffiffi
:95
p
% 97:5%. The larger the number of intervals, the
higher the individual confidence level would have to be to maintain the 95%
simultaneous level.
The tricky thing about the Tukey intervals is that they are not based on
independent samples—MSE appears in every one, and various intervals share the
same
x
i
’s (e.g., in the case I ¼ 4, three different intervals all use
x
1
). This implies
that there is no straightforward probability argument for ascertaining the simulta-
neous confidence level from the individual confidence levels. Nevertheless, if Q
.05
is used, the simultaneous confidence level is controlled at 95%, whereas using Q
.01
gives a simultaneous 99% level. To obta in a 95% simultaneous level, the individual
level for each interval must be considerably larger than 95%. Said in a slightly
different way, to obtain a 5% experimentwise or family error rate, the individual or
per-comparison error rate for each interval must be considerably smaller than .05.
MINITAB asks the user to specify the family error rate (e.g., 5%) and then includes
on output the individual error rate (see Exercise 16).
Confidence Intervals for Other Parametric Functions
In some situations, a CI is desired for a function of the m
i
’s more complicated than a
difference m
i
–m
j
. Let y ¼ Sc
i
m
i
, where the c
i
’s are constants. One such function is
1
2
ðm
1
þ m
2
Þ
1
3
ðm
3
þ m
4
þ m
5
Þ, which in the context of Example 11.4 measures the
difference between the group consi sting of the first two brands and that of the last
three brands. Because the X
ij
’s are normally distributed with E(X
ij
) ¼ m
i
and
V(X
ij
) ¼ s
2
,
^
y ¼ S
i
c
i
X
i
is normally distributed, unbiased for y, and
Vð
^
yÞ¼Vð
X
i
c
i
X
i
Þ¼
X
i
c
2
i
VðX
i
Þ¼
s
2
J
X
i
c
2
i
Estimating s
2
by MSE and forming
^
s
^
y
results in a t variable ð
^
y yÞ=
^
s
^
y
, which can
be manipulated to obtain the following 100(1 – a)% confidence interval for Sc
i
m
i
:
X
c
i
x
i
t
a=2;IðJ1Þ
ffiffiffiffiffiffiffiffiffiffiffiffiffiffiffiffiffiffiffiffiffiffiffiffiffiffiffiffiffiffi
ðMSE
X
c
2
i
Þ=J
q
ð11:5Þ
570 CHAPTER 11 The Analysis of Variance
Example 11.6
(Example 11.4
continued)
The parametric function for comparing the first two (store) brand s of oil filter with
the last three (national) brands is y ¼
1
2
ðm
1
þ m
2Þ
1
3
ðm
3
þ m
4
þ m
5
Þ, from which
X
c
2
i
¼
1
2
2
þ
1
2
2
þ
1
3
2
þ
1
3
2
þ
1
3
2
¼
5
6
With
^
y ¼
1
2
ð
x
1
þ
x
2
Þ
1
3
ð
x
3
þ
x
4
þ
x
5
Þ¼:583 and MSE ¼ .088, a 95%
interval is
:583 2:021
ffiffiffiffiffiffiffiffiffiffiffiffiffiffiffiffiffiffiffiffiffiffiffiffiffiffiffiffiffiffiffiffi
5ð:088Þ=½ð6Þð9Þ
p
¼ :583 :182 ¼ð:401;:765Þ
■
Notice that in the foregoing example the coefficients c
1
, ..., c
5
satisfy
P
c
i
¼
1
2
þ
1
2
1
3
1
3
1
3
¼ 0. When the coefficients sum to 0, the linear combina-
tion y ¼
P
c
i
m
i
is called a contrast among the means, and the analysis is available
in a number of statistical software programs.
Sometimes an experiment is carried out to compare each of several “new”
treatments to a control treatment. In such situations, a multiple comparisons
technique called Dunnett’s method is appropriate.
Exercises Section 11.2 (11–21)
11. An experiment to compare the spreading rates of
five different brands of yellow interior latex
paint available in a particular area used 4 gallons
(J ¼ 4) of each paint. The sample average
spreading rates (ft
2
/gal) for the five brands were
x
1
¼ 462:0,
x
2
¼ 512:8,
x
3
¼ 437:5,
x
4
¼ 469:3, and x
5
¼ 532:1. The computed
value of F was found to be significant at level
a ¼ .05. With MSE ¼ 272.8, use Tukey’s pro-
cedure to investigate significant differences in
the true average spreading rates between brands.
12. In Exercise 11, suppose
x
3
¼ 427:5. Now which
true average spreading rates differ significantly
from each other? Be sure to use the method of
underscoring to illustrate your conclusions, and
write a paragraph summarizing your results.
13. Repeat Exercise 12 supposing that
x
2
¼ 502:8in
addition to
x
3
¼ 427:5
14. Use Tukey’s procedure on the data in Exercise 3
to identify differences in true average flight
times among the four types of mosquitos.
15. Use Tukey’s procedure on the data of Exercise 5
to identify differences in true average total Fe
among the four types of formations (use MSE
¼ 15.64).
16. Reconsider the axial stiffness data given in Exer-
cise 7. ANOVA output from MINITAB follows:
Analysis of Variance for stiffness
Source DF SS MS F P
length 4 43993 10998 10.48 0.000
Error 30 31475 1049
Total 34 75468
Level N Mean StDev
4 7 333.21 36.59
6 7 368.06 28.57
8 7 375.13 20.83
10 7 407.36 44.51
12 7 437.17 26.00
Pooled StDev
¼ 32.39
Tukey’s pairwise comparisons
Family error rate
¼ 0.0500
Individual error rate
¼ 0.00693
Critical value
¼ 4.10
Intervals for (column level mean) -
(row level mean)
46810
6
85.0
15.4
8
92.1 57.3
8.3 43.1
10
124 89.5 82.4
23.9 10.9 18.0
12
154.2 119.3 112.2 80.0
a. Use the output (without reference to our F
table) to test the relevant hypotheses.
b. Use the Tukey intervals given in the output to
determine which means differ, and construct
the corresponding underscoring pattern.
11.2 Multiple Comparisons in ANOVA 571

17. Refer to Exercise 4. Compute a 95% t CI for the
contrast y ¼
1
2
ðm
1
þ m
2
Þm
3
18. Consider the accompanying data on plant growth
after the application of different types of growth
hormone.
1 13 17 7 14
2 21 13 20 17
Hormone 3 18 15 20 17
4 7111810
5 61115 8
a. Perform an F test at level a ¼ .05.
b. What happens when Tukey’s procedure is
applied?
19. Consider a single-factor ANOVA experiment in
which I ¼ 3, J ¼ 5,
x
1
¼ 10,
x
2
¼ 12, and
x
3
¼ 20. Find a value of SSE for which
f > F
.05,2,12
, so that H
0
: m
1
¼ m
2
¼ m
3
is
rejected, yet when Tukey’s procedure is applied
none of the m
i
’s differ significantly from each
other.
20. Refer to Exercise 19 and suppose
x
1
¼ 10,
x
2
¼ 15, and
x
3
¼ 20. Can you now find a value
of SSE that produces such a contradiction between
the F test and Tukey’s procedure?
21. The article “The Effect of Enzyme Inducing
Agents on the Survival Times of Rats Exposed to
Lethal Levels of Nitrogen Dioxide” (Toxicol.
Appl. Pharmacol., 1978: 169–174) reports the fol-
lowing data on survival times for rats exposed to
nitrogen dioxide (70 ppm) via different injection
regimens. There were J ¼ 14 rats in each group.
Regimen
x
i
(min) s
i
1. Control 166 32
2. 3-Methylcholanthrene 303 53
3. Allylisopropylacetamide 266 54
4. Phenobarbital 212 35
5. Chlorpromazine 202 34
6. p-Aminobenzoic acid 184 31
a. Test the null hypothesis that true average sur-
vival time does not depend on injection regi-
men against the alternative that there is some
dependence on injection regimen using
a ¼ .01.
b. Suppose that 100(1 a)% CIs for k different
parametric functions are computed from the
same ANOVA data set. Then it is easily ver-
ified that the simultaneous confidence level is
at least 100(1 ka)%. Compute CIs with
simultaneous confidence level at least 98%
for the contrasts m
1
–
1
5
ðm
2
þ m
3
þ m
4
þ
m
5
þ m
6
Þand
1
4
ðm
2
þ m
3
þ m
4
þ m
5
Þm
6
11.3
More on Single-Factor ANOVA
In this section, we briefly consider some additional issues relating to single-factor
ANOVA. These include an alternative description of the model parameters, b for
the F test, the relationship of the test to procedures previous ly considered, data
transformation, a random effects model, and formulas for the case of unequal
sample sizes.
An Alternative Description of the ANOVA Model
The assumptions of single-factor ANOVA can be described succinctly by means of
the “model equation”
X
ij
¼ m
i
þ e
ij
where e
ij
represents a random deviation from the population or true treatment mean
m
i
. The e
ij
’s are assumed to be independent, normally distributed rv’s (implying that
the X
ij
’s are also) with E(e
ij
) ¼ 0 [so that E(X
ij
) ¼ m
i
] and V(e
ij
) ¼ s
2
[from which
V(X
ij
) ¼ s
2
for every i and j]. An alternative description of single-factor ANOVA
will give added insight and suggest appropriate generalizations to models involving
more than one factor. Define a parameter m by
572 CHAPTER 11 The Analysis of Variance
m ¼
1
I
X
I
i¼1
m
i
and the parameters a
1
, ..., a
I
by
a
i
¼ m
i
m ði ¼ 1; ...; IÞ
Then the treatment mean m
i
can be written as m + a
i
, where m represents the true
average overall response in the experiment, and a
i
is the effect, measured as a
departure from m, due to the ith treatment. Whereas we initially had I parameters,
we now have I+1(m, a
1
, ..., a
I
). However, because
P
a
i
¼ 0 (the average
departure from the overall mean response is zero), only I of these new parameters
are independently determined, so there are as many independent parameters as
there were before. In terms of m and the a
i
’s, the model becomes
X
ij
¼ m
i
þ a
i
þ e
ij
ði ¼ 1; ...; I; j ¼ 1; ...; JÞ
In the next two sections, we will develop analogous models for two-factor ANOVA.
The claim that the m
i
’s are identical is equivalent to the equality of the a
i
’s, and
because
P
a
i
¼ 0, the null hypothesis becomes
H
0
: a
1
¼ a
2
¼¼a
I
¼ 0
In Section 11.1, it was stated that MSTr is an unbiased estimator of s
2
when
H
0
is true but otherwise tends to overestimate s
2
. More precisely,
EðMSTrÞ¼s
2
þ
J
I 1
X
a
2
i
When H
0
is true,
P
a
2
i
¼ 0soE(MSTr) ¼ s
2
(MSE is unbiased whether or not H
0
is true). If
P
a
2
i
is used as a measure of the extent to which H
0
is false, then a larger
value of
P
a
2
i
will result in a greater tendency for MSTr to overestimate s
2
. More
generally, formulas for expected mean squares for multifactor models are used to
suggest how to form F ratios to test various hypotheses .
Proof of the Formula for E(MSTr) For any rv Y, E(Y
2
) ¼ V(Y) + [E(Y)]
2
, so
EðSSTrÞ¼E
1
J
X
i
X
2
i
1
IJ
X
2
!
¼
1
J
X
i
EðX
2
i
Þ
1
IJ
EðX
2
Þ
¼
1
J
X
i
VðX
i
Þþ½EðX
i
Þ
2
no
1
IJ
VðX
Þþ½EðX
Þ
2
no
¼
1
J
X
i
Js
2
þ½Jðm þ a
i
Þ
2
no
1
IJ
IJs
2
þðIJmÞ
2
no
¼ Is
2
þ IJm
2
þ 2mJ
X
i
a
i
þ J
X
i
a
2
i
s
2
IJm
2
¼ðI 1Þs
2
þ J
X
i
a
2
i
ðsince
X
a
i
¼ 0Þ
The result then follows from the relationship MSTr ¼ SSTr/(I–1). ■
11.3 More on Single-Factor ANOVA 573
b for the F Test
Consider a set of parameter values a
1
, a
2
, ..., a
I
for which H
0
is not true. The
probability of a type II error, b, is the probability that H
0
is not rejected when that
set is the set of true values. One might think that b would have to be determined
separately for each different configuration of a
i
’s. Fortunately, since b for the F test
depends on the a
i
’s and s
2
only through
P
a
2
i
=s
2
it can be simultaneously
evaluated for many different alternatives . For example,
P
a
2
i
¼ 4 for each of the
following sets of a
i
’s for which H
0
is false, so b is identical for all three alternatives:
1. a
1
¼1, a
2
¼1, a
3
¼ 1, a
4
¼ 1
2. a
1
¼
ffiffiffi
2
p
, a
2
¼
ffiffiffi
2
p
, a
3
¼ 0, a
4
¼ 0
3. a
1
¼
ffiffiffi
3
p
, a
2
¼
ffiffiffiffiffiffiffiffi
1=3
p
, a
3
¼
ffiffiffiffiffiffiffiffi
1=3
p
, a
4
¼
ffiffiffiffiffiffiffiffi
1=3
p
The quantity J
P
a
2
i
=s
2
is called the noncentrality parameter for one-way
ANOVA (because when H
0
is false the test statistic has a noncentral F distribution
with this as one of its parameters), and b is a decreasing function of the value of this
parameter. Thus, for fixed values of s
2
and J, the null hypothesis is more likely to
be rejected for alternatives far from H
0
(large
P
a
2
i
) than for alternatives close to
H
0
. For a fixed value of
P
a
2
i
, b decreases as the sample size J on each treatment
increases, and it increases as the variance s
2
increases (since greater underlying
variability makes it more difficult to detect any given departure from H
0
).
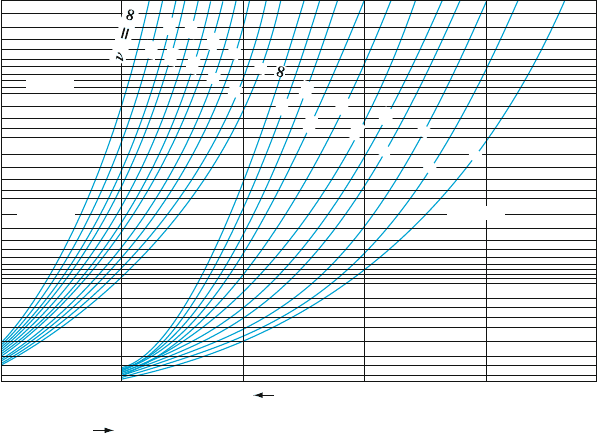
Because hand computation of b and sample size determination for the F tes t
are quite difficult (as in the case of t tests), statisticians have constructed sets of
curves from which b can be obtained. Sets of curves for numerator df n
1
¼ 3and
n
1
¼ 4 are displayed in Figures. 11.5 and 11.6, respectively. After the values of s
2
and
the a
i
’s for which b is desired are specified, these are used to compute the value of
f,wheref
2
¼ (J/I)
P
a
2
i
/s
2
. We then enter the appropriate set of curves at the
60
60
30
30
20
20
15
15
12
12
10
9
8
7
6
10
9
8
7
6
54321
12 3
.99
.98
.97
.96
.95
.94
.92
.90
.80
.70
.60
.50
.40
.30
.10
2
Power = 1 − b
f (for a = .01)
f (for a = .05)
a = .05
a = .01
n
1
= 3
Figure 11.5 Power curves for the ANOVA
F
test (n
1
¼ 3)
(E. S. Pearson and H. O. Hartley, “Charts of the Power Function for Analysis of Variance Tests,
Derived from the Non-central
F
Distribution,” Biometrika, vol. 38, 1951: 112, by permission
of Biometrika Trustees.)
574 CHAPTER 11 The Analysis of Variance
value of f on the horizontal axis, move up to the curve associated with error df n
2
,
and move over to the value of power on the vertical axis. Finally, b ¼ 1 – power.
Example 11.7 The effects of four different heat treatments on yield point (tons/in
2
) of steel ingots
are to be investigated. A total of eight ingots will be cast using each treatment.
Suppose the true standard deviation of yield point for any of the four treatments is
s ¼ 1. How likely is it that H
0
will not be rejected at level .05 if three of the treatments
have the same expected yield point and the other treatment has an expected yield
point that is 1 ton/in.
2
greater than the common value of the other three (i.e., the fourth
yield is on average 1 standard deviation above those for the first three treatments)?
Suppose that m
1
¼ m
2
¼ m
3
and m
4
¼ m
1
+1,m ¼ðSm
i
Þ=4 ¼ m
1
þ
1
4
. Then
a
1
¼ m
1
m ¼
1
4
, a
2
¼
1
4
, a
3
¼
1
4
, a
4
¼
3
4
so
f
2
¼
8
4
1
4
2
þ
1
4
2
þ
1
4
2
þ
3
4
2
"#
¼
3
2
and f ¼ 1.22. The degrees of freedom are n
1
¼ I –1¼ 3 and n
2
¼ I(J –1)¼ 28,
so interpolating visually between n
2
¼ 20 and n
2
¼ 30 gives power .47 and
b .53. This b is rather large, so we might decide to increase the value of J.
How many ingots of each type would be required to yield b .05 for the alterna-
tive under consideration? By trying different values of J, we can verify that J ¼ 24
will meet the requirement, but any smaller J will not.
■
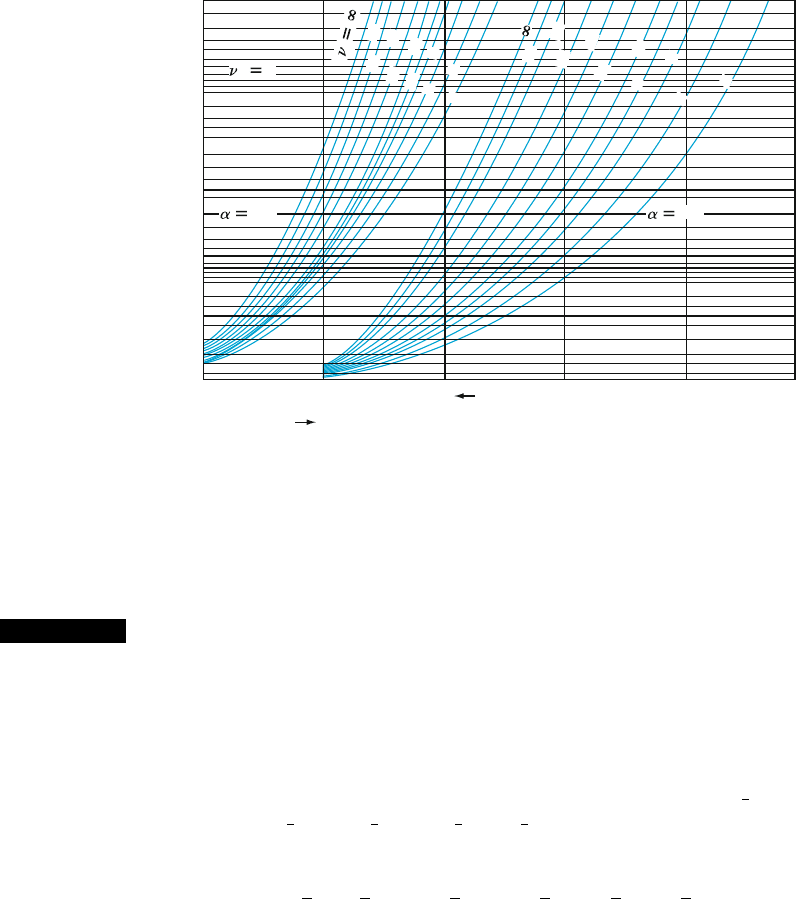
As an alternative to the use of power curves, many statistical packages have a
function that calculates the cumulative area under a noncentral F curve (inputs F
a
,
numerator df, denominator df, and f
2
), and this area is b. In addition, MINITAB 16
60
60
30
30
20
20
15
15
12
12
10
9
8
7
6
10
9
8
7
6
.01 .05
123
12345
.99
.98
.97
.96
.95
.94
.92
.90
.80
.70
.60
.50
.40
.30
.10
1
4
Power = 1 − b
f (for a = .01)
f (for a = .05)
2
Figure 11.6 Power curves for the ANOVA
F
test (n
1
¼ 4)
(E. S. Pearson and H. O. Hartley, “Charts of the Power Function for Analysis of Variance Tests, Derived
from the Non-central
F
Distribution,”
Biometrika
, vol. 38, 1951: 112, by permission of Biometrika
Trustees.)
11.3 More on Single-Factor ANOVA
575

does something rather different. The user is asked to specify the maximum differ-
ence between m
i
’s rather than the individual means. For example, we might wish to
calculate the power of the test with a ¼ .05, s ¼ 1, I ¼ 4, J ¼ 2, m
1
¼ 100,
m
2
¼ 101, m
3
¼ 102, and m
4
¼ 106. Then the maximum difference is 106 –
100 ¼ 6. However, the power depends not only on this maximum difference but
on the values of all the m
i
’s. In this situation MINITAB calculates the smallest
possible value of power subject to m
1
¼ 100 and m
4
¼ 106, which occurs when the
two other m’s are both halfway between 100 and 106. This power is .86, so we can
say that the power is at least .86 and b is at most .14 when the two most extreme m’s
are separated by 6. The software will also determine the necessary common sample
size if maximum difference and minimum power are specified. The R package has
a function that allows specification of all I of the means, along with the other
parameters. The function calculates whichever parameter is omitted. For example,
in the above scenario with a ¼ .05, s ¼ 1, I ¼ 4, J ¼ 2, m
1
¼ 100, m
2
¼ 101,
m
3
¼ 102, and m
4
¼ 106, the function calculates power ¼ .89.
Relationship of the F Test to the t Test
When the number of populations is just I ¼ 2, the ANOVA F is testing H
0
: m
1
¼ m
2
versus H
a
: m
1
6¼ m
2
. In this case, a two-taile d, two-sample t test can also be used. In
Section 10.2, we mentioned the pooled t test, which requires equal variances, as an
alternative to the two-sample t procedure. With a little algebra, it can be shown that
the single-factor ANOVA F test and the two-tailed pooled t test are equivalent; for
any given data set, the P-values for the two tests will be identical, so the same
conclusion will be reached by either test.
The two-s ample t test is more flexible than the F test when I ¼ 2 for two
reasons. First, it is not based on the assumption that s
1
¼ s
2
; second, it can be used
to test H
a
: m
1
> m
2
(an upper-tailed t test) or H
a
: m
1
< m
2
as well as H
a
: m
1
6¼ m
2
.As
mentioned at the end of Section 11.1, there is a generalization of the two-sample
t test for I 3 samples with population variances not necessarily the same.
Single-Factor ANOVA When Sample Sizes Are Unequal
When the sample sizes from each population or treatment are not equal, let J
1
, J
2
, ...,
J
I
denote the I sample sizes and let n ¼ S
i
J
i
denote the total number of observations.
The accompanying box gives ANOVA formulas and the test procedure.
SST ¼
X
I
i¼1
X
J
i
j¼1
ðX
ij
X
Þ
2
¼
X
I
i¼1
X
J
i
j¼1
X
2
ij
1
n
X
2
df ¼ n 1
SSTr ¼
X
I
i¼1
X
J
i
j¼1
ðX
i
X
Þ
2
¼
X
I
i¼1
1
J
i
X
2
i
1
n
X
2
df ¼ I 1
SSE ¼
X
I
i¼1
X
J
i
j¼1
ðX
ij
X
i
Þ
2
¼ SST SSTr df ¼
X
ðJ
i
1Þ¼n I
576 CHAPTER 11 The Analysis of Variance

Test statistic value:
f ¼
MSTr
MSE
where MSTr ¼
SSTr
I 1
and MSE ¼
SSE
n I
Rejection region: f F
a;I1;nI
The correction factor (CF) X
2
=n is subtracted when computing both SST and SSTr.
These formulas are derived in the same way (see Exercise 28) as the similar
formulas in Section 11.1, except that it is harder here to show that MSTr/MSE
has the F distribution under H
0
.
Example 11.8 The article “On the Development of a New Approach for the Determination of
YieldStrengthinMg-BasedAlloys”(Light Metal Age, Oct. 1998: 51–53) pre-
sented the following data on elastic modulus (GPa) obtained by a new ultrasonic
method for specimens of an alloy produced using three different casting
processes.
Process Observations J
i
x
i·
x
i
Permanent molding 45.5 45.3 45.4 44.4 44.6 43.9 44.6 44.0 8 357.7 44.71
Die casting 44.2 43.9 44.7 44.2 44.0 43.8 44.6 43.1 8 352.5 44.06
Plaster molding 46.0 45.9 44.8 46.2 45.1 45.5
6 273.5 45.58
22 983.7
Let m
1
, m
2
, and m
3
denote the true average elastic moduli for the three different
processes under the given circumstances. The relevant hypotheses are H
0
: m
1
¼
m
2
¼m
3
versus H
a
: at least two of the m
i
’s are different. The test statistic is, of course,
F ¼ MSTr/MSE, based on I–1 ¼ 2 numerator df and n–I¼ 22 – 3 ¼ 19
denominator df. Relevant quantities include
XX
x
2
ij
¼ 43; 998:73 CF ¼
983:7
2
22
¼ 43; 984:80
SST ¼ 43 ; 998:73 43 ; 984:80 ¼ 13:93
SSTr ¼
357:7
2
8
þ
352:5
2
8
þ
273:5
2
6
43; 984:80 ¼ 7:93
SSE ¼ 13:93 7:93 ¼ 6:00
The rem aining computations are displayed in the accompanying ANOVA table.
Since F
.001,2,19
¼ 10.16 < 12.56 ¼ f, the P-value is sma ller than .001. Thus the
null hypothesis should be rejected at any reasonable significance level; there is
compelling evid ence for concluding that true average elastic modulus somehow
depends on which casting process is used.
11.3 More on Single-Factor ANOVA 577