Devore J.L., Berk K.N. Modern Mathematical Statistics with Applications
Подождите немного. Документ загружается.


resulted in t ¼ 2.51 and P-value ¼ .019. Does
the appropriate test procedure described in this
chapter yield this value of t and the stated
P-value?
b. Is there substantial evidence for concluding
that true average strength for males exceeds
that for females by more than 25 N? State
and test the relevant hypotheses.
97. The article “Pine Needles as Sensors of Atmo-
spheric Pollution” (Environ. Monitor., 1982:
273–286) reported on the use of neutron-activity
analysis to determine pollutant concentration in
pine needles. According to the article’s authors,
“These observations strongly indicated that for
those elements which are determined well by the
analytical procedures, the distribution of concentra-
tion is lognormal. Accordingly, in tests of signifi-
cance the logarithms of concentrations will be
used.” The given data refers to bromine concentra-
tion in needles taken from a site near an oil-fired
steam plant and from a relatively clean site. The
summary values are means and standard deviations
of the log-transformed observations.
Site
Sample
Size
Mean Log
Concentration
SD of Log
Concentration
Steam
plant
8 18.0 4.9
Clean 9 11.0 4.6
Let m
1
be the true average log concentration at
the first site, and define m
2
analogously for the
second site.
a. Use the pooled t test (based on assuming nor-
mality and equal standard deviations) to decide
at significance level .05 whether the two con-
centration distribution means are equal.
b. If s
1
and s
2
, the standard deviations of the two
log concentration distributions, are not equal,
would m
1
and m
2
, the means of the concentra-
tion distributions, be the same if m
1
¼ m
2
?
Explain your reasoning.
98. Torsion during hip external rotation (ER) and
extension may be responsible for certain kinds of
injuries in golfers and other athletes. The article
“Hip Rotational Velocities during the Full Golf
Swing” (J. Sport Sci. Med., 2009: 296–299)
reported on a study in which peak ER velocity
and peak IR (internal rotation) velocity (both in
deg/s) were determined for a sample of 15 female
collegiate golfers during their swings. The follow-
ing data was supplied by the article’s authors.
Golfer ER IR diff z perc
1 130.6 98.9 31.7 1.28
2 125.1 115.9 9.2 0.97
3 51.7 161.6 109.9 0.34
4 179.7 196.9 17.2 0.73
5 130.5 170.7 40.2 0.34
6 101.0 274.9 173.9 0.97
7 24.4 275.0 250.6 1.83
8 231.1 275.7 44.6 0.17
9 186.8 214.6 27.8 0.52
10 58.5 117.8 59.3 0.00
11 219.3 326.7 107.4 0.17
12 113.1 272.9 159.8 0.73
13 244.3 429.1 184.8 1.28
14 184.4 140.6 43.8
1.83
15 199.2 345.6 146.4 0.52
a. Is it plausible that the differences came from a
normally distributed population?
b. The article reported that MeanðSD) ¼
145:368:0ðÞfor ER velocity and ¼
227.8(96.6) for IR velocity. Based just on
this information, could a test of hypotheses
about the difference between true average IR
velocity and true average ER velocity be car-
ried out? Explain.
c. Do an appropriate hypothesis test about the
difference between true average IR velocity
and true average ER velocity and interpret the
result.
99. The accompanying summary data on the ratio of
strength to cross-sectional area for knee extensors
is taken from the article “Knee Extensor and Knee
Flexor Strength: Cross-Sectional Area Ratios in
Young and Elderly Men” ( J. Gerontol., 1992:
M204–M210).
Group
Sample
Size
Sample
Mean
Standard
Error
Young 13 7.47 .22
Elderly men 12 6.71 .28
Does this data suggest that the true average ratio
for young men exceeds that for elderly men?
Carry out a test of appropriate hypotheses using
a ¼ .05. Be sure to state any assumptions neces-
sary for your analysis.
548
CHAPTER 10 Inferences Based on Two Samples
100. The accompanying data on response time
appeared in the article “The Extinguishment of
Fires Using Low-Flow Water Hose Streams—
Part II” (Fire Techn., 1991: 291–320). The
samples are independent, not paired.
Good
visibility
.43 1.17 .37 .47 .68 .58 .50 2.75
Poor
visibility
1.47 .80 1.58 1.53 4.33 4.23 3.25 3.22
The authors analyzed the data with the pooled
t test. Does the use of this test appear justified?
[Hint: Check for normality. The normal scores
for n ¼ 8 are 1.53, .89, .49, .15, .15, .49,
.89, and 1.53.]
101. The accompanying data on the alcohol content of
wine is representative of that reported in a study
in which wines from the years 1999 and 2000
were randomly selected and the actual content
was determined by laboratory analysis (London
Times, Aug. 5, 2001).
Wine 123456
Actual 14.2 14.5 14.0 14.9 13.6 12.6
Label 14.0 14.0 13.5 15.0 13.0 12.5
The two-sample t test gives a test statistic value
of .62 and a two-tailed P-value of .55. Does this
convince you that there is no significant difference
between true average actual alcohol content and
true average content stated on the label? Explain.
102. The article “The Accuracy of Stated Energy
Contents of Reduced-Energy, Commercially
Prepared Foods” (J. Am. Diet. Assoc., 2010:
116–123) presented the accompanying data on
vendor-stated gross energy and measured value
(both in kcal) for 10 different supermarket
convenience meals):
Meal 123456789 10
Stated 180 220 190 230 200 370 250 240 80 180
Measured 212 319 231 306 211 431 288 265 145 228
Obtain a 95% confidence interval for the differ-
ence of population means. By roughly what per-
centage are the actual calories higher than the
stated value?
Note that the article calls this a convenience
sample and suggests that therefore it should have
limited value for inference. However, even if the
ten meals were a random sample from their local
store, there could still be a problem in drawing
conclusions about a purchase at your store.
103. How does energy intake compare to energy
expenditure? One aspect of this issue was con-
sidered in the article “Measurement of Total
Energy Expenditure by the Doubly Labelled
Water Method in Professional Soccer Players”
(J. Sports Sci., 2002: 391–397), which contained
the accompanying data (MJ/day).
Player 1234567
Expenditure 14.4 12.1 14.3 14.2 15.2 15.5 17.8
Intake 14.6 9.2 11.8 11.6 12.7 15.0 16.3
Test to see whether there is a significant differ-
ence between intake and expenditure. Does the
conclusion depend on whether a significance
level of .05, .01, or .001 is used?
104. An experimenter wishes to obtain a CI for the
difference between true average breaking
strength for cables manufactured by company I
and by company II. Suppose breaking strength is
normally distributed for both types of cable with
s
1
¼ 30 psi and s
2
¼ 20 psi.
a. If costs dictate that the sample size for the
type I cable should be three times the sample
size for the type II cable, how many observa-
tions are required if the 99% CI is to be no
wider than 20 psi?
b. Suppose a total of 400 observations is to be
made. How many of the observations should
be made on type I cable samples if the width
of the resulting interval is to be a minimum?
105. An experiment to determine the effects of tempera-
ture on the survival of insect eggs was described in
the article “Development Rates and a Temperature-
Dependent Model of Pales Weevil” (Environ.
Entomol., 1987: 956–962). At 11
C, 73 of 91 eggs
survived to the next stage of development. At 30
C,
102 of 110 eggs survived. Do the results of this
experiment suggest that the survival rate (propor-
tion surviving) differs for the two temperatures?
Calculate the P-value and use it to test the appro-
priate hypotheses.
106. The insulin-binding capacity (pmol/mg protein)
was measured for four different groups of rats:
(1) nondiabetic, (2) untreated diabetic, (3) diabetic
treated with a low dose of insulin, (4) diabetic
treated with a high dose of insulin. The accompa-
nying table gives sample sizes and sample stan-
dard deviations. Denote the sample size for the ith
treatment by n
i
and the sample variance by
S
2
i
ði ¼ 1; 2; 3; 4Þ. Assuming that the true variance
for each treatment is s
2
, construct a pooled esti-
mator of s
2
that is unbiased, and verify using rules
Supplementary Exercises 549

of expected value that it is indeed unbiased. What
is your estimate for the following actual data?
[Hint: Modify the pooled estimator S
2
p
from Sec-
tion 10.2.]
Treatment
1234
Sample Size 16 18 8 12
Sample SD .64 .81 .51 .35
107. Suppose a level .05 test of
H
0
: m
1
m
2
¼ 0
versus
H
a
: m
1
m
2
> 0 is to be performed,
assuming s
1
¼ s
2
¼ 10 and normality of both
distributions, using equal sample sizes (m ¼ n).
Evaluate the probability of a type II error when
m
1
m
2
¼ 1 and n ¼ 25, 100, 2500, and 10,000.
Can you think of real problems in which the
difference m
1
m
2
¼ 1 has little practical signif-
icance? Would sample sizes of n ¼ 10,000 be
desirable in such problems?
108. The following data refers to airborne bacteria
count (number of colonies/ft
3
) both for m ¼ 8
carpeted hospital rooms and for n ¼ 8 uncar-
peted rooms (“Microbial Air Sampling in a
Carpeted Hospital,” J. Environ. Health, 1968:
405). Does there appear to be a difference in
true average bacteria count between carpeted
and uncarpeted rooms?
Carpeted 11.8 8.2 7.1 13.0 10.8 10.1 14.6 14.0
Uncarpeted 12.1 8.3 3.8 7.2 12.0 11.1 10.1 13.7
Suppose you later learned that all carpeted rooms
were in a veterans’ hospital, whereas all uncarpeted
rooms were in a children’s hospital. Would you be
able to assess the effect of carpeting? Comment.
109. Researchers sent 5000 resumes in response to job
ads that appeared in the Boston Globe and Chicago
Tribune. The resumes were identical except that
2500 of them had “white sounding” first names,
such as Brett and Emily, whereas the other 2500
had “black sounding” names such as Tamika and
Rasheed. The resumes of the first type elicited 250
responses and the resumes of the second type only
167 responses (these numbers are very consistent
with information that appeared in a January 15,
2003, report by the Associated Press). Does this
data strongly suggest that a resume with a “black”
name is less likely to result in a response than is a
resume with a “white” name?
110. McNemar’s test, developed in Exercise 55, can
also be used when individuals are paired
(matched) to yield n pairs and then one member
of each pair is given treatment 1 and the other is
given treatment 2. Then X
1
is the number of pairs
in which both treatments were successful, and
similarly for X
2
, X
3
, and X
4
. The test statistic
for testing equal efficacy of the two treatments
is given by ðX
2
X
3
Þ=
ffiffiffiffiffiffiffiffiffiffiffiffiffiffiffiffi
X
2
þ X
3
p
, which has
approximately a standard normal distribution
when
H
0
is true. Use this to test whether the
drug ergotamine is effective in the treatment of
migraine headaches.
Ergotamine
SF
Placebo S 44 34
F 46 30
The data is fictitious, but the conclusion agrees
with that in the article “Controlled Clinical Trial
of Ergotamine Tartrate” (British Med. J., 1970:
325–327).
111. Let X
1
, ... , X
m
be a random sample from a
Poisson distribution with parameter l
1
, and let
Y
1
, ... , Y
n
be a random sample from another
Poisson distribution with parameter l
2
. We wish
to test
H
0
: l
1
l
2
¼ 0 against one of the three
standard alternatives. Since m ¼ l for a Poisson
distribution, when m and n are large the large-
sample z test of Section 10.1 can be used. How-
ever, the fact that Vð
XÞ¼l=n suggests that a
different denominator should be used in standar-
dizing
X Y. Develop a large-sample test proce-
dure appropriate to this problem, and then apply
it to the following data to test whether the plant
densities for a particular species are equal in two
different regions (where each observation is the
number of plants found in a randomly located
square sampling quadrat having area 1 m
2
, so for
region 1, there were 40 quadrats in which one
plant was observed, etc.):
Frequency
01234567
Region 1 28 40 28 17 8 2 1 1 m ¼ 125
Region 2 14 25 30 18 49 2 1 1 n ¼ 140
550
CHAPTER 10 Inferences Based on Two Samples

112. Referring to Exercise 111, develop a large-
sample confidence interval formula for l
1
l
2
.
Calculate the interval for the data given there
using a confidence level of 95%.
113. Let R
1
be a rejection region with significance
level a for testing
H
01
: y ∈ O
1
versus
H
a1
: y =2
O
1
, and let R
2
be a level a rejection region for
testing
H
02
: y ∈ O
2
versus
H
a2
: y =2 O
2
, where O
1
and O
2
are two disjoint sets of possible values of
y. Now consider testing
H
0
: y ∈ O
1
[ O
2
versus
the alternative
H
a
: y =2 O
1
[ O
2
. The proposed
rejection region for this latter test is R
1
\R
2
. That
is,
H
0
is rejected only if both
H
01
and
H
02
can
be rejected. This procedure is called a union–
intersection test (UIT).
a. Show that the UIT is a level a test.
b. As an example, let m
T
denote the mean value
of a particular variable for a generic (test)
drug, and m
R
denote the mean value of this
variable for a brand-name (reference) drug. In
bioequivalence testing, the relevant hypoth-
eses are
H
0
: m
T
/m
R
d
L
or m
T
/m
R
d
U
(not
bioequivalent) versus
H
a
: d
L
< m
T
/m
R
< d
U
(bioequivalent). The limits d
L
and d
U
are
standards set by regulatory agencies; for cer-
tain purposes the FDA uses .80 and 1.25 ¼
1/.8, respectively. By taking logarithms and
letting ¼ ln(m), t ¼ ln(d), the hypotheses
become
H
0
: either
T
R
t
L
or t
U
versus
H
a
: t
L
<
T
R
< t
U
. With this
setup, a type I error involves saying the
drugs are bioequivalent when they are not.
The FDA mandates a ¼ .05.
Let D be an estimator of
T
R
with stan-
dard error S
D
such that standardized variable
T ¼ [D (
T
R
)]/S
D
has a t distribution
with v df. The standard test procedure is
referred to as TOST for “two one-sided
tests,” and is based on the two test statistics
T
U
¼ (D t
U
)/S
D
and T
L
¼ (D t
L
)/S
D
.
If v ¼ 20, state the appropriate conclusion
in each of the following cases: (1) t
L
¼ 2.0,
t
U
¼1.5; (2) t
L
¼ 1.5, t
U
¼2.0; (3)
t
L
¼ 2.0, t
U
¼2.0.
Bibliography
See the bibliography at the end of Chapter 8.
Bibliography 551

CHAPTER ELEVEN
The Analysis
of Variance
Introduction
In studying methods for the analy‘sis of quantitative data, we first focused on
problems involving a single sample of numbers and then turned to a comparative
analysis of two different samples. Now we are ready for the analysis of several
samples.
The analysis of variance, or more briefly ANOVA, refers broadly to a collection
of statistical procedures for the analysis of quantitative responses. The simplest
ANOVA problem is referred to variously as a single-factor, single-classification,or
one-way ANOVA and involves the analysis of data sampled from two or more
numerical populations (distributions). The characteristic that labels the populations
is called the factor under study, and the populations are referred to as the levels of
the factor. Examples of such situations include the following:
1. An experiment to study the effects of five different brands of gasoline on
automobile engine operating efficiency (mpg)
2. An experiment to study the effects of four different sugar solutions (glucose,
sucrose, fructose, and a mixture of the three) on bacterial growth
3. An experiment to investigate whether hardwood concentration in pulp (%) has
an effect on tensile strength of bags made from the pulp
4. An experiment to decide whether the color density of fabric specimens depends
on the amount of dye used
J.L. Devore and K.N. Berk, Modern Mathematical Statistics with Applications, Springer Texts in Statistics,
DOI 10.1007/978-1-4614-0391-3_11,
#
Springer Science+Business Media, LLC 2012
552

In (1) the factor of interest is gasoline brand, and there are five different
levels of the factor. In (2) the factor is sugar, with four levels (or five, if a control
solution containing no sugar is used). In both (1) and (2), the factor is qualitative in
nature, and the levels correspond to possible categories of the factor. In (3) and (4),
the factors are concentration of hardwood and amount of dye, respectively; both
these factors are quantitative in nature, so the levels identify different settings of
the factor. When the factor of interest is quantitative, statistical techniques from
regression analysis (discussed in Chapter 12) can also be used to analyze the data.
In this chapter we first introduce single-factor ANOVA. Section 11.1 presents
the
F
test for testing the null hypothesis that the popul ation means are identical.
Section 11.2 considers further analysis of the data when
H
0
has been rejected.
Section 11.3 covers some other aspec ts of single-factor ANOVA. Many experimen-
tal situations involve study ing the simultaneous impact of more than one factor.
Various aspects of two-factor ANOVA are considered in the last two sections of the
chapter.
11.1
Single-Factor ANOVA
Single-factor ANOVA focuses on a comparison of two or more populations. Let
I ¼ the number of treatments being compared
m
1
¼ the mean of population 1 (or the true average response when
treatment 1 is applied)
.
.
.
m
I
¼ the mean of population I (or the true average response when
treatment I is applied)
Then the hypotheses of interest are
H
0
: m
1
¼ m
2
¼¼m
I
versus
H
a
: at least two of the m
i
’s are different
If I ¼ 4, H
0
is true only if all four m
i
’s are iden tical. H
a
would be true, for example,
if m
1
¼ m
2
6¼ m
3
¼ m
4
,ifm
1
¼ m
3
¼ m
4
6¼ m
2
, or if all four m
i
’s differ from each
other.
A test of these hypotheses requires that we have available a random sample
from each population or treatment.
Example 11.1 The article “Compression of Single-Wall Corrugated Shipping Container s Using
Fixed and Floating Test Platens” (J. Test. Eval., 1992: 318–320) describes an
experiment in which several different types of boxes were compared with respect
to compression strength (lb). Table 11.1 presents the results of a single-fa ctor
ANOVA experiment involving I ¼ 4 types of boxes (the sample means and
standard deviations are in good agreement with values given in the article).
11.1 Single-Factor ANOVA 553
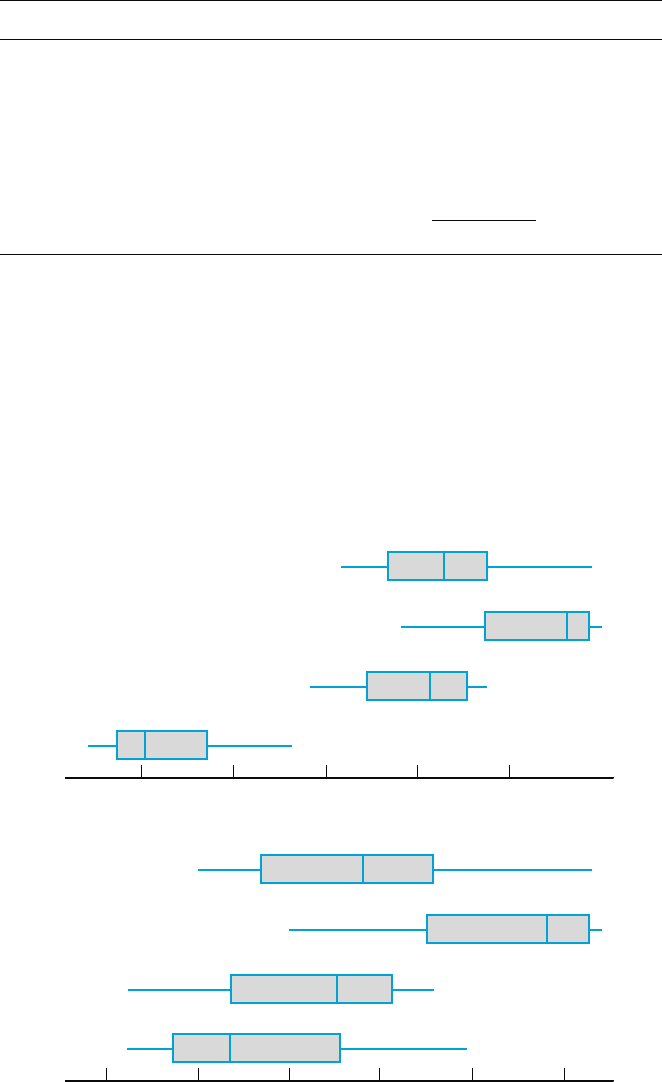
With m
i
denoting the true average compression strength for boxes of type i (i ¼ 1, 2,
3, 4), the null hypothesis is H
0
: m
1
¼ m
2
¼ m
3
¼ m
4
. Figure 11.1(a) shows a
comparative boxplot for the four samples. There is a substantial amount of overlap
among observations on the first three types of boxes, but compression strengths for
the fourth type appear considerably smaller than for the other types. This suggests
that H
0
is not true. The comparative boxplot in Figure 11.1(b) is based on adding 120
Table 11.1 The data and summary quantities for Example 11.1
Type of box Compression strength (lb) Sample mean Sample SD
1 655.5 788.3 734.3 713.00 46.55
721.4 679.1 699.4
2 789.2 772.5 786.9 756.93 40.34
686.1 732.1 774.8
3 737.1 639.0 696.3 698.07 37.20
671.7 717.2 727.1
4 535.1 628.7 542.4 562.02 39.87
559.0 586.9 520.0
Grand mean ¼
682.50
630
4
3
2
1
660 690 750720 780
550
4
3
2
1
600 650
a
b
700 750
Figure 11.1 Boxplots for Example 11.1: (a) original data; (b) altered data
554
CHAPTER 11 The Analysis of Variance

to each observation in the fourth sample (giving mean 682.02 and the same standard
deviation) and leaving the other observations unaltered. It is no longer obvious
whether H
0
is true or false. In situations such as this, we need a formal test
procedure.
■
Notation and Assumptions
In two-sample problems, we used the letters X and Y to designate the observations
in the two samples. Because this is cumbersome for three or more samples, it is
customary to use a single letter with two subscripts. The first subscript identifies the
sample number, corresponding to the population or treatment being sampled, and
the second subscript denotes the position of the observation within that sample. Let
X
ij
¼ the random variable (rv) denoting the jth measurement from the ith
population
x
ij
¼ the observed value of X
ij
when the experiment is performed
The observed data is usually displayed in a rectangular table, such as
Table 11.1 . There samples from the different populations appear in different rows
of the table, and x
i,j
is the jth number in the ith row. For example, x
2,3
¼ 786.9 (the
third observation from the secon d population), and x
4,1
¼ 535.1. When there is no
ambiguity, we will write x
ij
rather than x
i,j
(e.g., if there were 15 observations on
each of 12 treatments, x
112
could mean x
1,12
or x
11,2
). It is assumed that the X
ij
’
s
within any particular sample are independent—a random sample from the ith
population or treatment distribution— and that different samples are independent
of each other.
In some experiments, different samples contain different numbers of obser-
vations. However, the concepts and methods of single-factor ANOVA are most
easily developed for the case of equal sample sizes. Unequal sample sizes will be
considered in Section 11.3. Restricting ourselves for the moment to equal sample
sizes, let J denote the number of observations in each sample (J ¼ 6 in Example
11.1). The data set consists of IJ observations. The individual sample means will
be denoted by
X
1
; X
2
; ..., X
I
. That is,
X
i
¼
P
J
j¼1
X
ij
J
i ¼ 1; 2; ...; I
The dot in place of the second subscript signifies that we have added over all values
of that subscript while holding the other subscript value fixed, and the horizontal
bar indicates division by J to obtain an average. Similarly, the average of all IJ
observations, called the grand mean,is
X
¼
P
I
i¼1
P
J
j¼1
X
ij
IJ
For the strength data in Table 11. 1 ,
x
1
¼ 713:00,
x
2
¼ 756:93,
x
3
¼ 698:07,
x
4
¼ 562:02, and
x
¼ 682:50. Additionally, let S
2
1
; S
2
2
; ...; S
2
I
represent the sample
variances:
11.1 Single-Factor ANOVA 555
S
2
i
¼
P
J
j¼1
ðX
ij
X
i
Þ
2
J 1
i ¼ 1; 2; ...; I
From Example 11.1, s
1
¼ 46.55, s
2
1
¼ 2166:90, and so on.
ASSUMPTIONS
The I population or treatment distributions are all normal with the same
variance s
2
. That is, each X
ij
is normally distributed with
EðX
ij
Þ¼m
i
VðX
ij
Þ¼s
2
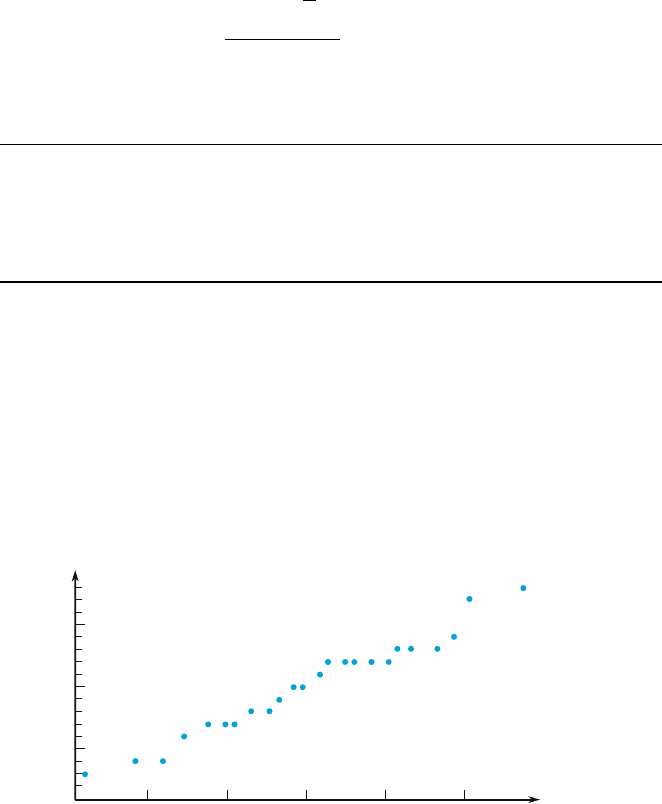
In previous chapters, a normal probability plot was suggested for checking
normality. The individual sample sizes in ANOVA are typically too small for I
separate plots to be informat ive. A single plot can be constructed by subtracting
x
1
from each observation in the first sample,
x
2
from each observation in the second,
and so on, and then plotting these IJ deviations against the z percentiles. The
deviations are called residuals so this plot is the normal plot of the residuals.
Figure 11.2 gives the plot for the residuals of Example 11.1. The straightness of the
pattern gives strong support to the normality assumption.
At the end of the section we discuss Levene’s test for the equal variance
assumption. For the moment, a rough rule of thumb is that if the largest s is not
much more than twice the smallest s, it is reasonable to assume equal variances.
This is especially true if the sample sizes are equal or close to equal. In Example
11.1, the largest s is only about 1.25 times the smallest.
Sums of Squares and Mean Squares
If H
0
is true the J observations in each sample come from a normal population
distribution with the same mean value m, in which case the sample means
x
1
;
x
2
; ...
x
I
: should be reasonably close. The test procedure is based on comparing
−1.4 −.7 0 .7 1.4
50
−50
0
z percentile
Deviation
Figure 11.2 A normal probability plot based on the data of Example 11.1
556
CHAPTER 11 The Analysis of Variance

a measure of differences among these sample means (“between-samples” variation)
to a measure of variation calculated from within each sample. These measures
involve quantities called sums of squares.
DEFINITION
The treatment sum of squares SSTr is given by
SSTr ¼ J
X
i
ðX
i
X
Þ
2
¼ J½ðX
1
X
Þ
2
þþðX
I
X
Þ
2
and the error sum of squares SSE is
SSE ¼
X
i
X
j
ðX
ij
X
i
Þ
2
¼
X
j
ðX
1j
X
1
Þ
2
þþ
X
j
ðX
Ij
X
I
Þ
2
¼ðJ 1ÞS
2
1
þðJ 1ÞS
2
2
þþðJ 1ÞS
2
I
¼ðJ 1Þ½S
2
1
þ S
2
2
þþS
2
I
Now recall a result from Section 6.4 :ifX
1
, ..., X
n
is a random sample from a normal
distribution with mean m and variance s
2
, then the sample mean X and the sample
variance S
2
are independent. Also, X is normally distributed, and (n1)S
2
/s
2
[i.e.,
P
X
i
XðÞ
2
=s
2
] has a chi-squared distribution with n 1 df. That is, dividing
the sum of squares
P
X
i
XðÞ
2
by s
2
gives a chi-squared random variable. Similar
results hold in our ANOVA situation.
THEOREM
When the basic assumptions of this section are satisfied, SSE/s
2
has a chi-
squared distribution with I(J – 1) df (each sample contributes J–1 df and df’s
add because the samples are independent). Furthermore, when H
0
is true,
SSTr/s
2
has a chi-squared distribution with I – 1 df [there are I deviations
X
1
X
; ...; X
I
X
but 1 df is lost because
P
i
ðX
i
X
Þ¼0]. Lastly,
SSE and SSTr are independent rando m variables.
If we let Y
i
¼ X
i
; i ¼ 1; ...; I,thenY
1
, Y
2
, ..., Y
I
are independent and normally
distributed with the same mean under H
0
and with variance s
2
/J. Thus, by the key
result from Section 6.4, I 1ðÞS
2
Y
= s
2
=JðÞhas a chi-squared distribution with I –1df.
Furthermore, I 1ðÞS
2
Y
= s
2
=JðÞ¼J
P
X
i
X
ðÞ
2
=s
2
¼ SSTr=s
2
, so SSTr=s
2
w
2
I1
. Independence of SSTr and SSE follows from the fact that SSTr is based on the
individual sample means whereas SSE is based on the sample variances, and
X
i
is
independent of S
2
i
for each i.
The expected value of a chi-squared variable with
n
df is just
n
.Thus
E
SSE
s
2
¼ IðJ 1Þ)E
SSE
IðJ 1Þ
¼ s
2
11.1 Single-Factor ANOVA 557