Devore J.L., Berk K.N. Modern Mathematical Statistics with Applications
Подождите немного. Документ загружается.


Source of Variation df Sum of Squares Mean Square f
Treatments 2 7.93 3.965 12.56
Error 19 6.00 .3158
Total 21 13.93
■
Multiple Comparisons When Sample Sizes Are Unequal
There is more controversy among statisticians regarding which multiple compar-
isons procedure to use when sample sizes are unequal than there is in the case of
equal sample sizes. The procedure that we present here is recommended in the
excellent book Beyond ANOVA: Basics of Applied Statistics (see the chapter
bibliography) for use when the I sample sizes J
1
, J
2
, ..., J
I
are reasonably close
to each other (“mild imbalance”). It modifies Tukey’s method by using averages of
pairs of 1/J
i
’s in place of 1/J.
Let
w
ij
¼ Q
a;I;nI
ffiffiffiffiffiffiffiffiffiffiffiffiffiffiffiffiffiffiffiffiffiffiffiffiffiffiffiffiffiffiffi
MSE
2
1
J
i
þ
1
J
j
s
Then the probability is approximately 1–a that
X
i
X
j
w
ij
m
i
m
j
X
i
X
j
þ w
ij
for every i and j (i ¼ 1, ..., I and j ¼ 1, ..., I) with i 6¼ j.
The simultaneous confidence level 100(1 – a)% is only approximate rather than
exact as it is with equal sample sizes. The underscoring method can still be used,
but now the w
ij
factor used to decide whether
x
i
and
x
j:
can be connected will
depend on J
i
and J
j
.
Example 11.9
(Example 11.8
continued)
The sample sizes for the elastic modulus data were J
1
¼ 8, J
2
¼ 8, J
3
¼ 6, and
I ¼ 3, n – I ¼ 19, MSE ¼ .316. A simultaneous confidence level of approximately
95% requires Q
.05,3,19
¼ 3.59, from which
w
12
¼ 3:59
ffiffiffiffiffiffiffiffiffiffiffiffiffiffiffiffiffiffiffiffiffiffiffiffiffiffiffi
:316
2
1
8
þ
1
8
s
¼ :713 w
13
¼ :771 w
23
¼ :771
Since
x
1
x
2
¼ 44:71 44:06 ¼ :65 < w
12
, m
1
and m
2
are judged not signifi-
cantly different. The accompanying underscoring scheme shows that m
1
and m
3
differ significantly, as do m
2
and m
3
.
2. Die 1. Permanent 3. Plaster
44.06 44.71 45.58
■
578 CHAPTER 11 The Analysis of Variance

Data Transformation
The use of ANOVA methods can be invalidated by substantial differences in the
variances s
2
1
; ...; s
2
I
(which until now have been assumed equal with common
value s
2
). It sometimes happens that VðX
ij
Þ¼s
2
i
¼ gðm
i
Þ, a known function of m
i
(so that when H
0
is false, the variances are not equal). For example, if X
ij
has a
Poisson distribution with parameter l
i
(approximately normal if l
i
10), then
m
i
¼ l
i
and s
2
i
¼ l
i
,sog(m
i
) ¼ m
i
is the known function. In such cases, one can
often transform the X
ij
’s to h(X
ij
)’s so that they will have approximately equal
variances (while hopef ully leaving the transformed variables approximately nor-
mal), and then the F test can be used on the transf ormed observations. The basic
idea is that, if h(·) is a smooth function, then we can express it approximately using
the first terms of a Taylor series, h(X
ij
) h(m
i
)+h
0
(m
i
)(X
ij
– m
i
). Then V[h(X
ij
)]
V(X
ij
)·[h
0
(m
i
)]
2
¼ g(m
i
) [h
0
(m
i
)]
2
. We now wish to find the function h(·) for which
g(m
i
)·[h
0
(m
i
)]
2
¼ c (a constant) for every i. Solving this for h
0
(m
i
) and integr ating
gives the following result:
PROPOSITION
If V(X
ij
) ¼ g(m
i
), a known functi on of m
i
, then a transformation h(X
ij
) that
“stabilizes the variance” so that V[h(X
ij
)] is approximately the same for each i
is given by h(x) /
R
[g(x)]
1/2
dx.
In the Poisson case, g(x) ¼ x,soh(x) should b e proportional to
R
x
1/2
dx ¼
2 x
1/2
. Thus Poisson data should be transformed to hðx
ij
Þ¼
ffiffiffiffiffi
x
ij
p
before the analysis.
A Random Effects Model
The single-factor problems considered so far have all been assumed to be exam ples
of a fixed effects ANOVA model. By this we mean that the chosen levels of the
factor under study are the only ones considered relevant by the experimenter. The
single-factor fixed effects model is
X
ij
¼ m
i
þ a
i
þ e
ij
X
a
i
¼ 0 ð11:6Þ
where the e
ij
’s are random and both m and the a
i
’s are fixed parameters whose
values are unknown.
In some single-factor problems, the particular levels studied by the experi-
menter are chosen, either by design or through sampling, from a large population of
levels. For example, to study the effects on tas k performance time of using different
operators on a particular machine, a sample of five operators might be chosen from
a large pool of operators. Similarly, the effect of soil pH on the yield of maize plants
might be studied by using soils with four specific pH values chosen from among the
many possible pH levels. When the levels used are selected at random from a larger
population of possible levels, the factor is said to be random rather than fixed, and
the fixed effects model (11.6) is no longer appropriate. An analogous random
effects model is obtained by replacing the fixed a
i
’s in (11.6) by random variables.
The resulting model description is
11.3 More on Single-Factor ANOVA 579

X
ij
¼ m þ A
i
þ e
ij
with EðA
i
Þ¼Eðe
ij
Þ¼0
Vðe
ij
Þ¼s
2
VðA
i
Þ¼s
2
A
ð11:7Þ
with all A
i
’s and e
ij
’s normally distributed and independent of each other.
The condition E(A
i
) ¼ 0in(11.7) is similar to the condition Sa
i
¼ 0in(11.6); it
states that the expected or average effect of the ith level measured as a departure
from m is zero.
For the random effects model (11.7), the hypothesis of no effects due to
different levels is H
0
: s
2
A
¼ 0 which says that different levels of the factor contrib-
ute nothing to variability of the response. Although the hypotheses in the single-
factor fixed and random effects models are different, they are tested in exactly the
same way, by forming F ¼ MSTr/MSE and rejecting H
0
if f F
a,I–1,n–I
. This can
be justified intuitively by noting that E(MSE) ¼ s
2
(as for fixed effects), whereas
EðMSTr) ¼ s
2
þ
1
I 1
n
P
J
2
i
n
s
2
A
ð11:8Þ
where J
1
, J
2
,..., J
I
are the sample sizes and n ¼ SJ
i
. The factor in parentheses on
the right side of (11.8) is nonnegative, so once again E(MSTr) ¼ s
2
if H
0
is true
and E(MSTr) > s
2
if H
0
is false.
Example 11.10 The study of nondestructive forces and stresses in materials furnishes important
information for efficient design. The article “Zero-Force Travel-Time Parameters
for Ultrasonic Head-Waves in Railroad Rail” (Mater. Eval., 1985: 854–858)
reports on a study of travel time for a type of wave that results from longitudinal
stress of rails used for railroad track. Three measurements were made on each of six
rails randomly selected from a population of rails. The investigators used random
effects ANOVA to decide whether some variation in travel time could be attributed
to “between-rail variability.” The data is given in the accompanying table (each
value, in nanoseconds, resulted from subtracting 36.1 ms from the original obser-
vation) along with the derived ANOVA table. The value of the F ratio is highly
significant, so H
0
: s
2
A
¼ 0 is rejected in favor of the conclusion that differences
between rails are a source of travel-time variability.
Source of
Variation
df
Sum of
Squares
Mean
Square
f
Treatments 5 9310.5 1862.1 115.2
Error 12 194.0 16.17
Total 17 9504.5
■
Rail Travel time x
i·
1 555354162
226373295
3 789185254
4 92 100 96 288
5 495150150
6808583
248
x
··
¼ 1197
580
CHAPTER 11 The Analysis of Variance

Exercises Section 11.3 (22–34)
22. The following data refers to yield of tomatoes (kg/
plot) for four different levels of salinity; salinity
level here refers to electrical conductivity (EC),
where the chosen levels were EC ¼ 1.6, 3.8, 6.0,
and 10.2 nmhos/cm:
1.6: 59.5 53.3 56.8 63.1 58.7
3.8: 55.2 59.1 52.8 54.5
6.0: 51.7 48.8 53.9 49.0
10.2: 44.6 48.5 41.0 47.3 46.1
Use the F test at level a ¼ .05 to test for any
differences in true average yield due to the differ-
ent salinity levels.
23. Apply the modified Tukey’s method to the data in
Exercise 22 to identify significant differences
among the m
i
’s.
24. The following partial ANOVA table is taken from
the article “Perception of Spatial Incongruity” (J.
Nerv. Ment. Dis., 1961: 222) in which the abilities
of three different groups to identify a perceptual
incongruity were assessed and compared. All indi-
viduals in the experiment had been hospitalized to
undergo psychiatric treatment. There were 21
individuals in the depressive group, 32 individuals
in the functional “other” group, and 21 individuals
in the brain-damaged group. Complete the
ANOVA table and carry out the F test at level
a ¼ .01.
Source df Sum of Squares Mean Square f
Groups 76.09
Error
Total 1123.14
25. Lipids provide much of the dietary energy in the
bodies of infants and young children. There is a
growing interest in the quality of the dietary lipid
supply during infancy as a major determinant of
growth, visual and neural development, and long-
term health. The article “Essential Fat Require-
ments of Preterm Infants” (Amer. J. Clin. Nutrit.,
2000: 245S–250S) reported the following data on
total polyunsaturated fats (%) for infants who were
randomized to four different feeding regimens:
breast milk, corn-oil-based formula, soy-oil-based
formula, or soy-and-marine-oil-based formula:
Regimen
Sample
Size
Sample
Mean
Sample
SD
Breast milk 8 43.0 1.5
CO 13 42.4 1.3
SO 17 43.1 1.2
SMO 14 43.5 1.2
a. What assumptions must be made about the four
total polyunsaturated fat distributions before
carrying out a single-factor ANOVA to decide
whether there are any differences in true aver-
age fat content?
b. Carry out the test suggested in part (a). What
can be said about the P-value?
26. Samples of six different brands of diet/imitation
margarine were analyzed to determine the level of
physiologically active polyunsaturated fatty acids
(PAPFUA, in percentages), resulting in the fol-
lowing data:
Imperial 14.1 13.6 14.4 14.3
Parkay 12.8 12.5 13.4 13.0 12.3
Blue Bonnet 13.5 13.4 14.1 14.3
Chiffon 13.2 12.7 12.6 13.9
Mazola 16.8 17.2 16.4 17.3 18.0
Fleischmann’s 18.1 17.2 18.7 18.4
(The preceding numbers are fictitious, but the
sample means agree with data reported in the Jan-
uary 1975 issue of Consumer Reports.)
a. Use ANOVA to test for differences among the
true average PAPFUA percentages for the dif-
ferent brands.
b. Compute CIs for all (m
i
– m
j
)’s.
c. Mazola and Fleischmann’s are corn-based,
whereas the others are soybean-based. Compute
a CI for
m
1
þ m
2
þ m
3
þ m
4
4
m
5
þ m
6
2
[Hint: Modify the expression for Vð
^
yÞ that led to
(11.5) in the previous section.]
27. Although tea is the world’s most widely consumed
beverage after water, little is known about its
nutritional value. Folacin is the only B vitamin
11.3 More on Single-Factor ANOVA 581

present in any significant amount in tea, and
recent advances in assay methods have made
accurate determination of folacin content feasible.
Consider the accompanying data on folacin con-
tent for randomly selected specimens of the four
leading brands of green tea.
Brand Observations
1 7.9 6.2 6.6 8.6 8.9 10.1 9.6
2 5.7 7.5 9.8 6.1 8.4
3 6.8 7.5 5.0 7.4 5.3 6.1
4 6.4 7.1 7.9 4.5 5.0 4.0
(Data is based on “Folacin Content of Tea,” J.
Amer. Dietetic Assoc. , 1983: 627–632.) Does this
data suggest that true average folacin content is the
same for all brands?
a. Carry out a test using a ¼ .05 via the P-value
method.
b. Assess the plausibility of any assumptions
required for your analysis in part (a).
c. Perform a multiple comparisons analysis to
identify significant differences among brands.
28. In single-factor ANOVA with sample sizes J
i
(i ¼
1, ..., I), show that SSTr ¼
P
J
i
ðX
i
X
Þ
2
¼
P
i
J
i
X
2
i
nX
2
,wheren ¼
P
J
i
.
29. When sample sizes are equal (J
i
¼ J), the para-
meters a
1
, a
2
,..., a
I
of the alternative parameteri-
zation are restricted by Sa
i
¼ 0. For unequal
sample sizes, the most natural restriction is
SJ
i
a
i
¼ 0. Use this to show that
E(MSTr) ¼ s
2
þ
1
I 1
X
J
i
a
2
i
What is E(MSTr) when H
0
is true? [This expec-
tation is correct if SJ
i
a
i
¼ 0 is replaced by the
restriction Sa
i
¼ 0 (or any other single linear
restriction on the a
i
’s used to reduce the model
to I independent parameters), but SJ
i
a
i
¼ 0
simplifies the algebra and yields natural estimates
for the model parameters (in particular,
^
a
i
¼
x
i
x
).]
30. Reconsider Example 11.7 involving an investiga-
tion of the effects of different heat treatments on
the yield point of steel ingots.
a. If J ¼ 8 and s ¼ 1, what is b for a level
.05 F test when m
1
¼ m
2
, m
3
¼ m
1
– 1, and m
4
¼ m
1
+ 1?
b. For the alternative of part (a), what value of J is
necessary to obtain b ¼ .05?
c. If there are I ¼ 5 heat treatments, J ¼ 10, and
s ¼ 1, what is b for the level .05 F test when
four of the m
i
’s are equal and the fifth differs by
1 from the other four?
31. For unequal sample sizes,, the noncentrality para-
meter is
P
J
i
a
2
i
=s
2
and f
2
¼ð1=IÞ
P
J
i
a
2
i
=s
2
.
Referring to Exercise 22, what is the power of the
test when m
2
¼ m
3
, m
1
¼ m
2
– s,andm
4
¼ m
2
+ s?
32. In an experiment to compare the quality of four
different brands of reel-to-reel recording tape, five
2400-ft reels of each brand (A–D) were selected
and the number of flaws in each reel was deter-
mined.
A: 10 5 12 14 8
B: 14 12 17 9 8
C: 13 18 10 15 18
D: 17 16 12 22 14
It is believed that the number of flaws has approx-
imately a Poisson distribution for each brand. Ana-
lyze the data at level .01 to see whether the
expected number of flaws per reel is the same for
each brand.
33. Suppose that X
ij
is a binomial variable with para-
meters n and p
i
(so it is approximately normal
when np
i
10 and nq
i
10). Then since m
i
¼
np
i
, VðX
ij
Þ¼s
2
i
¼ np
i
ð1 p
i
Þ¼m
i
ð1 m
i
=nÞ.
How should the X
ij
’s be transformed so as to
stabilize the variance? [Hint: g(m
i
) ¼ m
i
(1 – m
i
/n).]
34. Simplify E(MSTr) for the random effects model
when J
1
¼ J
2
¼ ¼ J
I
¼ J.
11.4
Two-Factor ANOVA with K
ij
¼ 1
In many experimental situations there are two factors of simultaneous interest. For
example, suppose an investigator wishes to study permeability of woven material
used to construct automobile air bags (related to the ability to absorb energy).
582 CHAPTER 11 The Analysis of Variance
An experiment might be carried out using I ¼ 4 temperature levels (10
C, 15
C,
20
C, 25
C) and J ¼ 3 levels of fabric denier (420-D, 630-D, 840-D).
When factor A consists of I levels and factor B consists of J levels, there are IJ
different combinations (pairs) of levels of the two factors, each called a treatment.
With K
ij
¼ the number of observations on the treatment consisting of factor A at
level i and factor B at level j, we focus in this section on the case K
ij
¼ 1, so that the
data consists of IJ observations. We will first discuss the fixed effects model, in
which the only levels of interest for the tw o factors are those actually represented in
the experiment. The case in which one or both factors are random is discussed
briefly at the end of the section.
Example 11.11 Is it really as easy to remove marks on fabrics from erasable pens as the word
erasable might imply? Consider the following data from an experiment to compare
three different brands of pens and four different wash treatments with respect to
their ability to remove marks on a particular type of fabric (based on “An Ass ess-
ment of the Effects of Treatment, Time, and Heat on the Removal of Erasable Pen
Marks from Cotton and Cotton/Polyester Blend Fabrics,” J. Test. Eval., 1991:
394–397). The response variable is a quantitative indicator of overall specimen
color change; the lower this value, the more marks were removed.
Washing treatment
1 2 3 4 Total
1 .97 .48 .48 .46 2.39
Brand of Pen 2 .77 .14 .22 .25 1.38
3 .67 .39 .57 .19 1.82
Total 2.41 1.01 1.27 .90 5.59
Is there any difference in the true average amount of color change due either to the
different brand s of pen or to the different washing treatments?
■
As in single-factor ANOVA, double subscripts are used to identify random
variables and observed values. Let
X
ij
¼ the random variable (rv) denoting the measurement when factor A is
held at level i and factor B is held at level j
x
ij
¼ the observed value of X
ij
The x
ij
’s are usually presented in a two-way table in which the ith row contains the
observed values when factor A is held at level i and the jth column cont ains the
observed values when factor B is held at level j. In the erasable-pen experiment of
Example 11.11, the number of levels of factor A is I ¼ 3, the number of levels of
factor B is J ¼ 4, x
13
¼ .48, x
22
¼ .14, and so on.
Whereas in single-factor ANOVA we were interested only in row means and
the grand mean, here we are interested also in colu mn means. Let
X
i
¼
the average of data obtained
when factor A is held at level i
¼
P
J
j¼1
X
ij
J
11.4 Two-Factor ANOVA with K
ij
¼ 1 583

X
j
¼
the average of data obtained
when factor B is held at level j
¼
P
I
i¼1
X
ij
I
X
¼ the grand mean ¼
P
I
i¼1
P
J
j¼1
X
ij
IJ
with observed values
x
i
,
x
j
,and
x
. Totals rather than averages are denoted by
omitting the horizontal bar (so x
j
¼
P
i
x
ij
, etc.). Intuitively, to see whether there is
any effect due to the levels of factor A, we should compare the observed
x
i
’s with each
other, and information about the different levels of factor B should come from the
x
j
’s.
The Model
Proceeding by analogy to single-factor ANOVA, one’s first inclination in specify-
ing a model is to let m
ij
¼ the true average response when factor A is at level i and
factor B at level j, giving IJ mean parameters. Then let
X
ij
¼ m
ij
þ e
ij
where e
ij
is the random amount by which the obser ved value differs from its
expectation and the e
ij
’s are assumed normal and independent with common vari-
ance s
2
. Unfortunately, there is no valid test procedure for this choice of parameters.
The reason is that under the alternative hypothesis of interest, the m
ij
’s are free to
take on any values whatsoever, whereas s
2
can be any value greater than zero, so that
there are IJ + 1 freely varying parameters. But there are only IJ observations, so
after using each x
ij
as an estimate of m
ij
, there is no way to estimate s
2
.
To rectify this problem of a model having more parameters than observed
values, we must specify a model that is realistic yet involves relatively few
parameters.
Assume the existence of I parameters a
1
, a
2
,..., a
I
and J parameters
b
1
, b
2
,..., b
J
such that
X
ij
¼ a
i
þ b
j
þ e
ij
ði ¼ 1; ...; I; j ¼ 1; ...; JÞð11:9Þ
so that
m
ij
¼ a
i
þ b
j
ð11:10Þ
Including s
2
, there are now I + J + 1 model parameters, so if I 3 and J 3,
there will be fewer parameters than observations [in fact, we will shortly modify
(11.10) so that even I ¼ 2 and/or J ¼ 2 will be accommodated].
The model specified in (11.9) and (11.10) is called an additive model
because each mean response m
ij
is the sum of an effect due to factor A at level i
(a
i
) and an effect due to factor B at level j (b
j
). The difference between mean
584 CHAPTER 11 The Analysis of Variance
responses for factor A at level i and level i
0
when B is held at level j is m
ij
– m
i
0
j
.
When the model is additive,
m
ij
m
i
0
j
¼ða
i
þ b
j
Þða
i
0
þ b
j
Þ¼a
i
a
i
0
which is independent of the level j of the second factor. A similar result holds for
m
ij
– m
ij
0
. Thus additivity means that the difference in mean responses for two levels
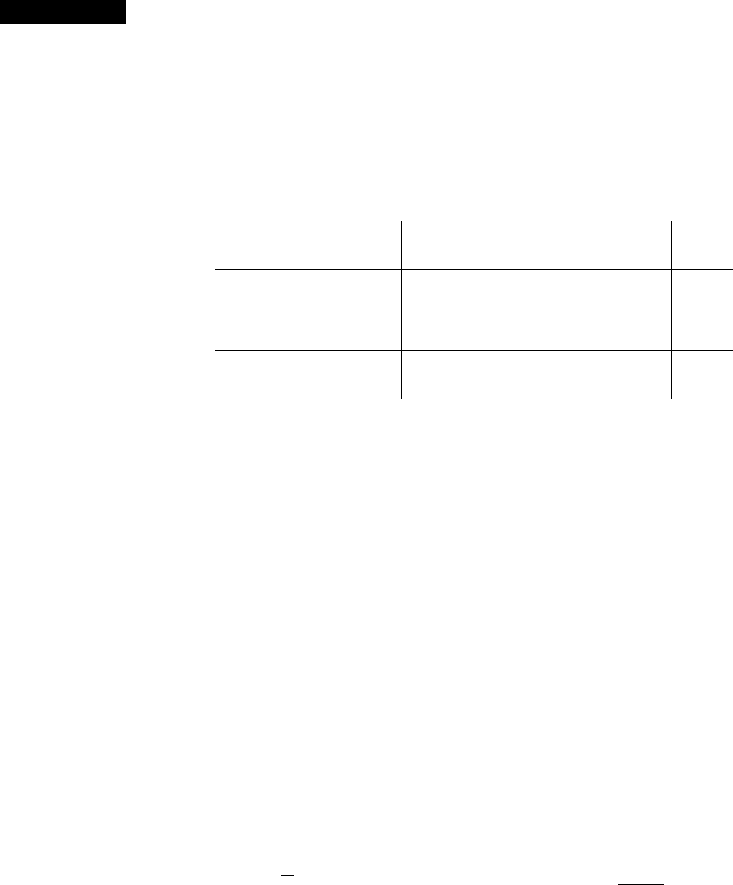
of one of the factors is the same for all levels of the other factor. Figure 11.7(a) shows a
set of mean responses that satisfy the condition of additivity (which implies parallel
lines), and Figure 11.7(b) shows a nonadditive configuration of mean responses.
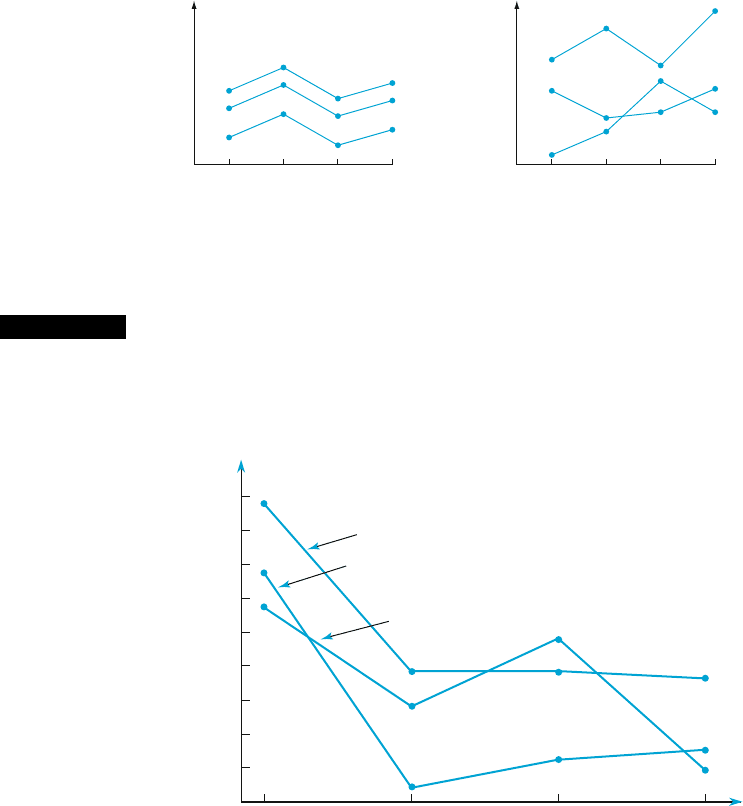
Example 11.12
(Example 11.11
continued)
When we plot the observed x
ij
’s in a manner analogous to that of Figure 11.7,we
get the result shown in Figur e 11.8. Although there is some “crossing over” in the
observed x
ij
’s, the configuration is reasonably representative of what would be
expected under additivity with just one observation per treatment.
12
3
4
Levels of A
12
3
4
Levels of A
ab
Levels of B
Mean response
Levels of B
Mean response
Figure 11.7 Mean responses for two types of model: (a) additive; (b) nonadditive
Color change
.4
.3
.1
.2
1 2
Washin
g
treatment
Brand 1
3 4
.5
.6
.7
.8
.9
1.0
Brand 2
Brand 3
Figure 11.8 Plot of data from Example 11.11 ■
11.4 Two-Factor ANOVA with K
ij
¼ 1 585

Expression (11.10) is not quite the final model description because the a
i
’s
and b
j
’s are not uniquely determined. Following are two different configur ations of
the a
i
’s and b
j
’s that yield the same additive m
ij
’s.
b
1
¼ 1 b
2
¼ 4 b
1
¼ 2 b
2
¼ 5
a
1
¼ 1 m
11
¼ 2 m
12
¼ 5 a
1
¼ 0 m
11
¼ 2 m
12
¼ 5
a
2
¼ 2 m
21
¼ 3 m
22
¼ 6 a
2
¼ 1 m
21
¼ 3 m
22
¼ 6
By subtracting any constant c from all a
i
’s and adding c to all b
j
’s, other config-
urations corresponding to the same additive model are obtained. This nonunique-
ness is eliminated by use of the following model.
X
ij
¼ m þ a
i
þ b
j
þ e
ij
ð11:11Þ
where
P
I
i¼1
a
i
¼ 0,
P
J
j¼1
b
j
¼ 0 and the e
ij
’s are assumed independent,
normally distributed, with mean 0 and common variance s
2
.
This is analogous to the alternative choice of parame ters for single-factor ANOVA
discussed in Section 11.3. It is not difficult to verify that (11.11) is an additive
model in which the parameters are uniquely determined (e.g., for the m
ij
’s men-
tioned previously, m ¼ 4, a
1
¼ –.5, a
2
¼ .5, b
1
¼1.5, and b
2
¼ 1.5). Notice that
there are only I – 1 independently determined a
i
’s and J – 1 independently
determined b
j
’s, so (including m)(11.11) specifies I + J – 1 mean parameters.
The interpretation of the parameters of (11.11) is straightforward: m is the true
grand mean (mean response averaged over all levels of both factors), a
i
is the effect
of factor A at level i (measured as a deviation from m), and b
j
is the effect of factor B
at level j. Unbiased (and maximum likelihood) estimators for these parameters are
^
m ¼
X
^
a
i
¼ X
i
X
^
b
j
¼ X
j
X
There are two different hypotheses of interest in a two-factor experiment with
K
ij
¼ 1. The first, denoted by H
0A
, states that the different levels of factor A have
no effect on true average response. The second, denoted by H
0B
, asserts that there is
no factor B effect.
H
0A
: a
1
¼ a
2
¼¼a
I
¼ 0
versus H
aA
: at least one a
i
6¼ 0
H
0B
: b
1
¼ b
2
¼¼b
J
¼ 0
versus H
aB
: at least one b
j
6¼ 0
ð11:12Þ
(No factor A effect implies that all a
i
’s are equal, so they must all be 0 since they
sum to 0, and similarly for the b
j
’s.)
586 CHAPTER 11 The Analysis of Variance

Test Procedures
The description and analysi s now follow closely that for single-factor ANOVA.
The relevant sums of squares and their computing forms are given by
SST ¼
X
I
i¼1
X
J
j¼1
ðX
ij
X
Þ
2
¼
X
I
i¼1
X
J
j¼1
X
2
ij
1
IJ
X
2
df ¼ IJ 1
SSA ¼
X
I
i¼1
X
J
j¼1
ðX
i
X
Þ
2
¼
1
J
X
I
i¼1
X
2
i
1
IJ
X
2
df ¼ I 1
SSB ¼
X
I
i¼1
X
J
j¼1
ðX
j
X
Þ
2
¼
1
I
X
J
j¼1
X
2
j
1
IJ
X
2
df ¼ J 1
SSE ¼
X
I
i¼1
X
J
j¼1
ðX
ij
X
i
X
j
þ X
Þ
2
df ¼ðI 1ÞðJ 1Þ
ð11:13Þ
and the fundamental identity
SST ¼ SSA þ SSB þ SSE ð11:14Þ
allows SSE to be determined by subtraction.
The expression for SSE results from replacing m, a
i
, and b
j
in
S½X
ij
ðm þ a
i
þ b
j
Þ
2
by their respective estimators. Error df is IJ – number of
mean parameters estimated ¼ IJ –[1+(I –1)+(J – 1)] ¼ (I – 1)(J – 1). As in
single-factor ANOVA, total variation is split into a part (SSE) that is not explained
by either the truth or the falsity of H
0A
or H
0B
and two parts that can be explained by
possible falsi ty of the two null hypotheses.
Forming F ratios as in single-factor ANOVA, we can show as in Section 11.1
that if H
0A
is true, the corresponding F ratio has an F distribution with numerator
df ¼ I – 1 and denominator df ¼ (I –1)(J – 1); an analogous result applies when
testing H
0B
.
Hypotheses Test Statistic Value Rejection Region
H
0A
versus H
aA
f
A
¼
MSA
MSE
f
A
F
a
;I1;ðI1ÞðJ1Þ
H
0B
versus H
aB
f
B
¼
MSB
MSE
f
B
F
a
;J1;ðI1ÞðJ1Þ
Example 11.13
(Example 11.12
continued)
The x
i
’s (row totals) and x
j
’s (column totals) for the color change data are displayed
along the right and bottom margins of the data table in Example 11.11. In addition,
PP
x
2
ij
¼ 3:2987 and the correction factor is x
2
= IJðÞ¼5:59ðÞ
2
=12 ¼ 2:6040.
The sums of squares are then
11.4 Two-Factor ANOVA with K
ij
¼ 1 587