Devore J.L., Berk K.N. Modern Mathematical Statistics with Applications
Подождите немного. Документ загружается.

SST ¼ 3:2987 2:6040 ¼ :6947
SSA ¼
1
4
½2:39
2
þ 1:38
2
þ 1:82
2
2:6040 ¼ :1282
SSB ¼
1
3
½2:41
2
þ 1:01
2
þ 1:27
2
þ :90
2
2:6040 ¼ :4797
SSE ¼ :6947 ð:1282 þ :4797Þ¼:0868
The accompanying ANOVA table (Table 11.5) summarizes further calculations.
The critical value for testing H
0A
at level of significance .05 is F
.05,2,6
¼ 5.14.
Since 4.43 < 5.14, H
0A
cannot be rejected at significance level .05. Based on this
(small) data set, we cannot conclude that true average color change depends on
brand of pen. Because F
.05,3,6
¼ 4.76 and 11.05 4.76, H
0B
is rejected at signifi-
cance level .05 in favor of the assertion that color change varies with washing
treatment. A statistical computer package gives P-values of .066 and .007 for these
two tests.
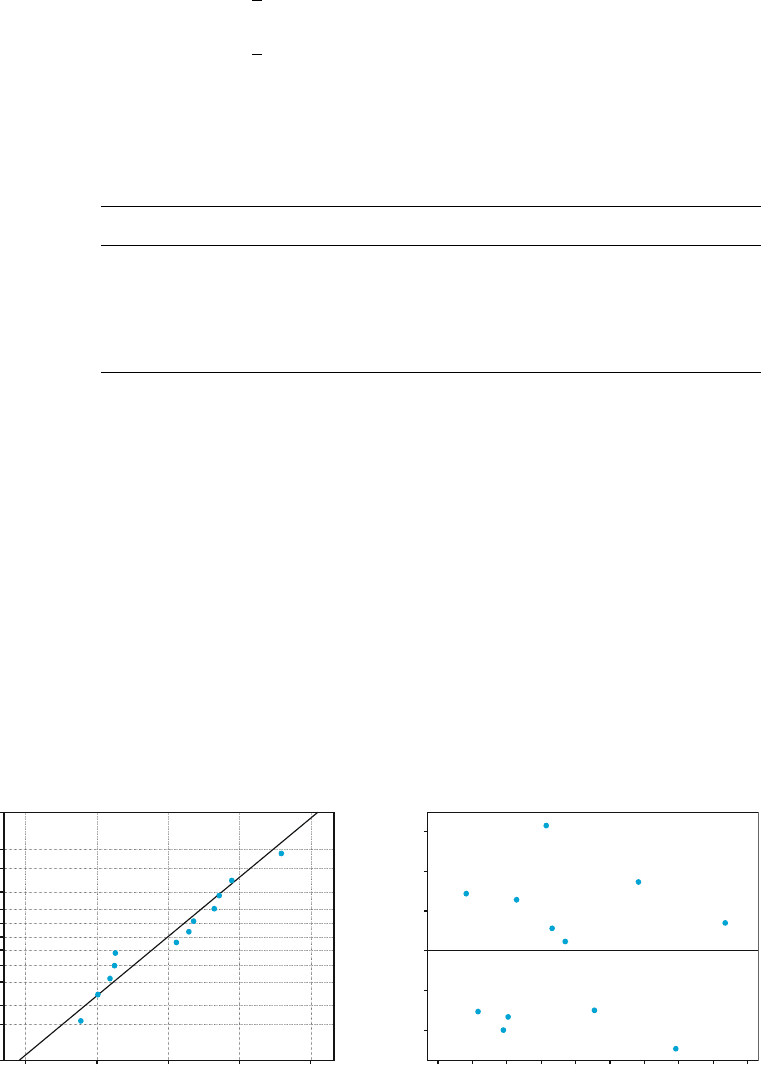
How can plausibility of the normality and constant variance assumptions be
investigated graphically? Define the predicted valu es (also called fitted values)
^
x
ij
¼
^
m þ
^
a
i
þ
^
b
j
¼
x
þð
x
i
x
Þþð
x
j
x
Þ¼
x
i
þ
x
j
x
, and the residuals
(the differences between the observations and predicted values)
x
ij
^
x
ij
¼ x
ij
x
i
x
j
þ
x
. We can check the normality assumption with a nor-
mal plot of the residuals, Figure 11.9(a), and we can check the constant variance
assumption with a plot of the residuals against the fitt ed values, Figure 11.9(b).
Table 11.5 ANOVA table for Example 11.13
Source of Variation df Sum of Squares Mean Square f
Factor A (pen brand) I1 ¼ 2 SSA ¼ .1282 MSA ¼ .0641 f
A
¼ 4.43
Factor B (wash
treatment)
J1 ¼ 3 SSB ¼ .4797 MSB ¼ .1599 f
B
¼ 11.05
Error (I1)(J1) ¼ 6 SSE ¼ .0868 MSE ¼ .01447
Total IJ1 ¼ 11 SST ¼ .6947
Residual
99
95
90
80
70
60
30
1
40
5
50
20
10
Normal Probability Plot of the Residuals
ab
Fitted Value
0.15
0.10
0.05
0.0
−0.5
−0.10
Residuals Versus the Fitted Values
Percent
Residual
0.20.10.0−0.1−0.2
0.1 0.2 0.3 0.4 0.5 0.6 0.7 0.8 0.9 1.0
Figure 11.9 Plots from MINITAB for Example 11.13
588
CHAPTER 11 The Analysis of Variance

The normal plot is reasonably straight, so there is no reason to question
normality for this data set. On the plot of the residua ls against the fitted values, we
are looking for differences in vertical spread as we move horizontally across the
graph. For example, if there were a narrow range for small fitted values and a
wide range for high fitted values, this would suggest that the variance is higher for
larger responses (this happens often, and it can sometimes be cured by replacing
each observation by its logarithm). No such problem occurs here, so there is no
evidence against the constant variance assumption.
■
Expected Mean Squares
The plausibility of using the F tests just described is demonstrated by determining
the expected mean squares. After some tedious algebra,
E(MSE) ¼ s
2
(when the model is additive)
E(MSA) ¼ s
2
þ
J
I 1
X
I
i¼1
a
2
i
E(MSB) ¼ s
2
þ
I
J 1
X
J
j¼1
b
2
j
When H
0A
is true, MSA is an unbiased estimator of s
2
,soF is a ratio of two unbiased
estimators of s
2
. When H
0A
is false, MSA tends to overestimate s
2
,soH
0A
should be
rejected when the ratio F
A
is too large. Similar comments apply to MSB and H
0B
.
Multiple Comparisons
When either H
0A
or H
0B
has been rejected, Tukey’s procedure can be used to
identify significant differences between the levels of the factor under investigation.
The steps in the analysis are identical to those for a single-fa ctor ANOVA:
1. For comparing levels of factor A, obtain Q
a,I,(I1)(J1)
.
For comparing levels of factor B, obtain Q
a, J,(I1)(J1)
.
2. Compute
w ¼ Q·(estimated standard deviation of the sample means being compared)
¼
Q
a;I;ðI1ÞðJ1Þ
ffiffiffiffiffiffiffiffiffiffiffiffiffiffiffi
MSE J
=
p
for factor A comparisons
Q
a; J;ðI1ÞðJ1Þ
ffiffiffiffiffiffiffiffiffiffiffiffiffiffi
MSE I
=
p
for factor B comparisons
(
(because, e.g., the sta ndard deviation of
X
i
is s=
ffiffiffi
J
p
).
3. Ar range the sample means in increasing order, underscor e those pairs differing
by less than w, and identify pairs not underscored by the same line as
corresponding to significantly different levels of the given factor.
Example 11.14
(Example 11.13
continued)
Identification of significa nt differences among the four washing treatments requires
Q
.05,4,6
¼ 4.90 and w ¼ 4.90
ffiffiffiffiffiffiffiffiffiffiffiffiffiffiffiffiffiffiffi
:01447=3
p
¼ :340. The four factor B sample means
(column averages) are now listed in increasing order, and any pair differing by less
than .340 is underscored by a line segment:
11.4 Two-Factor ANOVA with K
ij
¼ 1 589

x
4
x
2
x
3
x
1
.300 .337 .423 .803
Washing treatment 1 is significantly worse than the other three treatments, but no
other significant differences are identified. In particular, it is not apparent which
among treatments 2, 3, and 4 is best at removing marks.
■
Randomized Block Experiments
In using single-factor ANOVA to test for the presence of effects due to the
I different treatments under study, once the IJ subjects or experimental units have
been chosen, treatments should be allocated in a completely random fashion. That
is, J subjects should be chosen at random for the first treatment, then another
sample of J chosen at random from the remaining IJ – J subjects for the second
treatment, and so on.
It frequently happens, though, that subjects or exper imental units exhibit
differences with respect to other characteristics that may affect the observed
responses. For example, some patients might be healthier than others. When this
is the case, the presence or absence of a significant F value may be due to these
differences rather than to the presence or absence of factor effects. This was the
reason for introducing a paired experim ent in Chapter 10. The generalization of the
paired experiment to I > 2 is called a randomized block experiment. An extrane-
ous factor, “blocks,” is constructed by dividi ng the IJ units into J groups with I units
in each group. This grouping or blocking is done in such a way that within each
block, the I units are homogeneous with respect to other factor s thought to affect the
responses. Then within each homogeneous block, the I treatments are rando mly
assigned to the I units or subjects in the block.
Example 11.15 A consumer product-testing organization wished to compare the annual power
consumption for five different brand s of dehumidifier. Because power consumption
depends on the prevailing humi dity level, it was decided to monitor each brand at
four different levels ranging from moderate to heavy humidity (thus blocking on
humidity level). Within each level, brand s were randomly assigned to the five
selected locations. The resulting amount of power consumption (annual kWh)
appears in Table 11.6.
Table 11.6 Power consumption data for Example 11.15
Blocks (humidity level)
Treatments (brands) 1 2 3 4 x
i
x
i
1 685 792 838 875 3190 797.50
2 722 806 893 953 3374 843.50
3 733 802 880 941 3356 839.00
4 811 888 952 1005 3656 914.00
5 828 920 978 1023 3749 937.25
x
·j
3779 4208 4541 4797 17,325
590
CHAPTER 11 The Analysis of Variance

Since
PP
x
2
ij
¼ 15;178;901:00 and x
2
=ðIJÞ¼15;007;781:25
SST ¼ 15;178;901:00 15;007;781:25 ¼ 171;119:75
SSA ¼
1
4
½60;244;04915;007;781:25 ¼ 53;231:00
SSB ¼
1
5
½75;619;99515;007;781:25 ¼ 116;217 :75
and
SSE ¼ 171;119:75 53;231:00 116;217:75 ¼ 1671:00
The ANOVA calculations are summarized in Table 11.7
Since F
.05,4,12
¼ 3.26 and f
A
¼ 95.57 3.26, H
0
is rejected in favor of H
a
, and
we conclude that power consumption does depend on the brand of humidifier.
To identify significantly different brands, we use Tukey’s procedure. Q
.05,5,12
¼
4.51 and w ¼ 4.51
ffiffiffiffiffiffiffiffiffiffiffiffiffiffiffiffiffiffiffi
139:25=4
p
¼ 26:6.
x
1
x
3
x
2
x
4
x
5
797.50 839.00 843.50 914.00 937.25
The underscoring indicates that the brands can be divided into three groups with
respect to power consumption.
Because the block factor is of secondary interest, F
.05,3,12
is not needed,
though the computed value of F
B
is cle arly highly significant. Figure 11.10
shows SAS output for this data. Notice that in the first part of the ANOVA table,
the sums of squares (SS’s) for treatments (brands) and blocks (humidity levels) are
combined into a single “model” SS.
In many experimental situations in which treatments are to be applied to
subjects, a single subject can receive all I of the treatments. Blocking is then often
done on the subjects themselves to control for variability between subjects; each
subject is then said to act as its own control. Social scientists sometimes refer to
such experiments as repeated-measures designs. The “units” within a block are then
the different “instances” of treatment application. Similarly, blocks are often taken
as different time periods, locations, or observers.
Table 11.7 ANOVA table for Example 11.15
Source of Variation df Sum of Squares Mean Square f
Treatments (brands) 4 53,231.00 13,307.75 f
A
¼ 95.57
Blocks 3 116,217.75 38,739.25 f
B
¼ 278.20
Error 12 1671.00 139.25
Total 19 171,119.75
11.4 Two-Factor ANOVA with K
ij
¼ 1 591
In most randomized block experiments in which subjects serve as blocks, the
subjects actually participating in the experiment are selected from a large popula-
tion. The subjects then contribute random rather than fixed effects. This does not
affect the procedure for comparing treatments when K
ij
¼ 1 (one observation per
“cell,” as in this section), but the procedure is altered if K
ij
¼ K > 1. We will
shortly consid er two-factor models in which effects are random.
More on Blocking When I ¼ 2, either the F test or the paired differences t test can
be used to analyze the data. The resulting conclusion will not depend on which
procedure is used, since T
2
¼ F and t
2
a=2;n
¼ F
a;1;n
Just as with pairing, blocking entails both a potential gain and a potential loss
in precision. If there is a great deal of heterogeneity in experimental units, the value
of the variance parameter s
2
in the one-way model will be large. The effect of
blocking is to filter out the variation represented by s
2
in the two-way model
appropriate for a randomized block experiment. Other things being equal, a smaller
Analysis of Variance Procedure
Dependent Variable: POWERUSE
Sum of Mean
Source DF Squares Square F Value Pr > F
Model 7 169448.750 24206.964 173.84 0.0001
Error 12 1671.000 139.250
Corrected Total 19 171119.750
R-Square C.V. Root MSE POWERUSE Mean
0.990235 1.362242 11.8004 866.25000
Source DF Anova SS Mean Square F Value Pr > F
BRAND 4 53231.000 13307.750 95.57 0.0001
HUMIDITY 3 116217.750 38739.250 278.20 0.0001
Alpha = 0.05 df = 12 MSE = 139.25
Critical Value of Studentized Range = 4.508
Minimum Significant Difference = 26.597
Means with the same letter are not significantly different.
Tukey Grouping
A
A
A
B
B
B
C
Mean
937.250
914.000
843.500
839.000
797.500
N
4
4
4
4
4
BRAND
5
4
2
3
1
Figure 11.10 SAS output for consumption data ■
592 CHAPTER 11 The Analysis of Variance

value of s
2
results in a test that is more likely to detect departures from H
0
(i.e., a
test with greater power).
However, other things are not equal here, since the single-factor F test is
based on I(J – 1) degrees of freedom (df) for error, whereas the two-factor F test is
based on (I – 1)(J – 1) df for error. Fewer degrees of freedom for error results in a
decrease in power, essentially because the denominator estimator of s
2
is not as
precise. This loss in degrees of freedom can be especially serious if the experi-
menter can afford only a small number of observations. Nevertheless, if it appears
that blocking will significantly reduce variability, it is probably worth the loss in
degrees of freedom.
Models for Random Effects
In many experiments, the actual levels of a factor used in the experiment, rather
than being the only ones of interest to the experimenter, have been selected from a
much larger population of possible levels of the factor. In a two-factor situation,
when this is the case for both factors, a random effects model is appropriate. The
case in which the levels of one factor are the only ones of interest and the levels of
the other factor are selected from a population of levels leads to a mixed effects
model. The two-factor random effects model when K
ij
¼ 1is
X
ij
¼ m þ A
i
þ B
j
þ e
ij
i ¼ 1; :::; I; j ¼ 1; :::; JðÞ
where the A
i
’s, B
j
’s, and e
ij
’s are all independent, normally distributed rv’s
with mean 0 and variances s
2
A
,s
2
B
, and s
2
, respectively.
The hypotheses of interest are then H
0A
: s
2
A
¼ 0 (level of factor A does not contrib-
ute to variation in the response) versus H
aA
: s
2
A
> 0 and H
0B
: s
2
B
¼ 0 versus
H
aB
: s
2
B
> 0. Whereas E(MSE) ¼ s
2
as before, the expected mean squares for
factors A and B are now
E MSAðÞ¼s
2
þ Js
2
A
E MSBðÞ¼s
2
þ Is
2
B
Thus when H
0A
(H
0B
) is true, F
A
(F
B
) is still a ratio of two unbiased estimators of s
2
.
It can be shown that a test with significance level a for H
0A
versus H
aA
still rejects
H
0A
if f
A
F
a,I1,(I1)(J1)
, and, similarly, the same proce dure as before is used to
decide between H
0B
and H
aB
.
For the case in which factor A is fixed and factor B is random, the mixed
model is
X
ij
¼ m þ a
i
þ B
j
þ e
ij
i ¼ 1; :::; I; j ¼ 1; :::; JðÞ
where
P
a
i
¼ 0, and the B
j
’s, and e
ij
’s are all independent, normally
distributed rv’s with mean 0 and variances s
2
B
and s
2
, respective ly.
11.4 Two-Factor ANOVA with K
ij
¼ 1 593
Now the two null hypotheses are
H
0A
: a
1
¼¼a
I
¼ 0 and H
0B
: s
2
B
¼ 0
with expected mean squar es
E MSEðÞ¼s
2
E MSAðÞ¼s
2
þ
J
I 1
X
a
2
i
E MSBðÞ¼s
2
þ Is
2
B
The test procedures for H
0A
versus H
aA
and H
0B
versus H
aB
are exactly as before.
For example, in the analysis of the color change data in Example 11.11, if the
four wash treatments were randomly selected, then because f
B
¼ 11.05 and
F
.05,3,6
¼ 4.76, H
0B
: s
2
B
¼ 0 is rejected in favor of H
aB
: s
2
B
> 0. An estimate of
the “variance component” s
2
B
is then given by (MSB – MSE)/I ¼ .0485.
Summarizing, when K
ij
¼ 1, although the hypotheses and expected
mean squares differ from the case of both effects fixed, the test procedures are
identical.
Exercises Section 11.4 (35–48)
35. The number of miles of useful tread wear (in
1000’s) was determined for tires of each of five
different makes of subcompact car (factor A,
with I ¼ 5) in combination with each of four
different brands of radial tires (factor B, with
J ¼ 4), resulting in IJ ¼ 20 observations. The
values SSA ¼ 30.6, SSB ¼ 44.1, and SSE ¼
59.2 were then computed. Assume that an addi-
tive model is appropriate.
a. Test H
0
: a
1
¼ a
2
¼ a
3
¼ a
4
¼ a
5
¼ 0 (no
differences in true average tire lifetime due
to makes of cars) versus H
a
: at least one
a
i
6¼ 0 using a level .05 test.
b. H
0
: b
1
¼ b
2
¼ b
3
¼ b
4
¼ 0 (no differences
in true average tire lifetime due to brands of
tires) versus H
a
: at least one b
j
6¼ 0 using a
level .05 test.
36. Four different coatings are being considered for
corrosion protection of metal pipe. The pipe will
be buried in three different types of soil. To
investigate whether the amount of corrosion
depends either on the coating or on the type of
soil, 12 pieces of pipe are selected. Each piece is
coated with one of the four coatings and buried in
one of the three types of soil for a fixed time,
after which the amount of corrosion (depth of
maximum pits, in .0001 in.) is determined. The
depths are shown in this table:
Soil Type (B)
123
Coating (A)
1 64 49 50
2 53 51 48
3 47 45 50
4 51 43 52
a. Assuming the validity of the a dditive model,
carry out the ANOVA analysis using an
ANOVA table to see whether the amount of
corrosion depends on either the type of coat-
ing used or the type of soil. Use a ¼ .05.
b. Compute
^
m;
^
a
1
;
^
a
2
;
^
a
3
;
^
a
4
;
^
b
1
;
^
b
2
; and
^
b
3
37. The data set shown below is from the article
“Compounding of Discriminative Stimuli from
the Same and Different Sensory Modalities”
(J. Exp. Anal. Behav., 1971: 337–342). Rat
response was maintained by fixed interval sche-
dules of reinforcement in the presence of a tone or
two separate lights. The lights were of either mod-
erate (L1) or low (L2) intensity. Observations are
given as the mean number of responses emitted by
594
CHAPTER 11 The Analysis of Variance
each subject during single and compound stimuli
presentations over a 4-day period. Carry out an
appropriate analysis.
38. In an experiment to see whether the amount of
coverage of light-blue interior latex paint
depends either on the brand of paint or on the
brand of roller used, 1 gallon of each of four
brands of paint was applied using each of three
brands of roller, resulting in the following data
(number of square feet covered).
Roller Brand
123
1 454 446 451
Paint 2 446 444 447
Brand 3 439 442 444
4 444 437 443
a. Construct the ANOVA table. [Hint: The com-
putations can be expedited by subtracting 400
(or any other convenient number) from each
observation. This does not affect the final
results.]
b. State and test hypotheses appropriate for
deciding whether paint brand has any effect
on coverage. Use a ¼ .05.
c. Repeat part (b) for brand of roller.
d. Use Tukey’s method to identify significant
differences among brands. Is there one brand
that seems clearly preferable to the others?
e. Check the normality and constant variance
assumptions graphically.
39. In an experiment to assess the effect of the angle
of pull on the force required to cause separation
in electrical connectors, four different angles
(factor A) were used and each of a sample of
five connectors (factor B) was pulled once at
each angle (“A Mixed Model Factorial Experi-
ment in Testing Electrical Connectors,” Indust.
Qual. Control, 1960: 12–16). The data appears in
the accompanying table.
B
12345
A
0
45.3 42.2 39.6 36.8 45.8
2
44.1 44.1 38.4 38.0 47.2
4
42.7 42.7 42.6 42.2 48.9
6
43.5 45.8 47.9 37.9 56.4
Does the data suggest that true average separa-
tion force is affected by the angle of pull? State
and test the appropriate hypotheses at level .01
by first constructing an ANOVA table (SST
¼ 396.13, SSA ¼ 58.16, and SSB ¼ 246.97).
40. A particular county employs three assessors who
are responsible for determining the value of resi-
dential property in the county. To see whether
these assessors differ systematically in their
assessments, 5 houses are selected, and each
assessor is asked to determine the market value
of each house. With factor A denoting assessors
(I ¼ 3) and factor B denoting houses (J ¼ 5),
suppose SSA ¼ 11.7, SSB ¼ 113.5, and SSE
¼ 25.6.
a. Test H
0
: a
1
¼ a
2
¼ a
3
¼ 0 at level .05. (H
0
states that there are no systematic differences
among assessors.)
b. Explain why a randomized block experiment
with only 5 houses was used rather than a
one-way ANOVA experiment involving a
total of 15 different houses with each assessor
asked to assess 5 different houses (a different
group of 5 for each assessor).
Subject
Stimulus 1 2 3 4 x
i
x
i
L1 8.0 17.3 52.0 22.0 99.3 24.8
L2 6.9 19.3 63.7 21.6 111.5 27.9
Tone (T) 9.3 18.8 60.0 28.3 116.4 29.1
L1 + L2 9.2 24.9 82.4 44.9 161.4 40.3
L1 + T 12.0 31.7 83.8 37.4 164.9 41.2
L2 + T 9.4 33.6 96.6 40.6 180.2 45.1
x
j
54.8 145.6 438.5 194.8 833.7
11.4 Two-Factor ANOVA with K
ij
¼ 1 595

41. The article “Rate of Stuttering Adaptation
Under Two Electro-Shock Conditions” (Behav.
Res. Therapy, 1967: 49–54) gives adaptation
scores for three different treatments: (1) no
shock, (2) shock following each stuttered
word, and (3) shock during each moment of
stuttering. These treatments were used on each
of 18 stutterers.
a. Summary statistics include x
1
¼ 905; x
2
¼
913; x
3
¼ 936; x
¼ 2754;
P
j
x
2
j
¼ 430; 295
and
PP
x
2
ij
¼ 143; 930. Construct the
ANOVA table and test at level .05 to see
whether true average adaptation score
depends on the treatment given.
b. Judging from the F ratio for subjects (factor
B), do you think that blocking on subjects was
effective in this experiment? Explain.
42. The article “The Effects of a Pneumatic Stool
and a One-Legged Stool on Lower Limb Joint
Load and Muscular Activity During Sitting and
Rising” (Ergonomics, 1993: 519–535) gives the
accompanying data on the effort required of a
subject to arise from four different types of stools
(Borg scale). Perform an analysis of variance
using a ¼ .05, and follow this with a multiple
comparisons analysis if appropriate.
Subject
1 23456789
x
i
Type
of
Stool
1 121077898798.56
2 15 14 14 11 11 11 12 11 13 12.44
3 12 13 13 10 8 11 12 8 10 10.78
4 10 12 9 9 7 10 11 7 8 9.22
43. The strength of concrete used in commercial
construction tends to vary from one batch to
another. Consequently, small test cylinders of
concrete sampled from a batch are “cured” for
periods up to about 28 days in temperature- and
moisture-controlled environments before
strength measurements are made. Concrete is
then “bought and sold on the basis of strength
test cylinders” (ASTM C 31 Standard Test
Method for Making and Curing Concrete Test
Specimens in the Field). The accompanying
data resulted from an experiment carried out to
compare three different curing methods with
respect to compressive strength (MPa). Analyze
this data.
Batch Method A Method B Method C
1 30.7 33.7 30.5
2 29.1 30.6 32.6
3 30.0 32.2 30.5
4 31.9 34.6 33.5
5 30.5 33.0 32.4
6 26.9 29.3 27.8
7 28.2 28.4 30.7
8 32.4 32.4 33.6
9 26.6 29.5 29.2
10 28.6 29.4 33.2
44. Check the normality and constant variance assump-
tions graphically for the data of Example 11.15.
45. Suppose that in the experiment described in Exer-
cise 40 the five houses had actually been selected
at random from among those of a certain age and
size, so that factor B is random rather than fixed.
Test H
0
: s
2
B
¼ 0 versus H
a
: s
2
B
> 0 using a level
.01 test.
46. a. Show that a constant d can be added to (or
subtracted from) each x
ij
without affecting
any of the ANOVA sums of squares.
b. Suppose that each x
ij
is multiplied by a nonzero
constant c. How does this affect the ANOVA
sums of squares? How does this affect the
values of the F statistics F
A
and F
B
? What
effect does “coding” the data by y
ij
¼ cx
ij
+d
have on the conclusions resulting from the
ANOVA procedures?
47. Use the fact that EX
ij
¼ m þ a
i
þ b
j
with Sa
i
¼
Sb
j
¼ 0 to show that E(X
i
X
) ¼ a
i
, so that
^
a
i
¼ X
i
X
is an unbiased estimator for a
i
.
48. The power curves of Figures 11.5 and 11.6 can be
used to obtain b ¼ P(type II error) for the F test in
two-factor ANOVA. For fixed values of a
1
, a
2
, ...,
a
I
, the quantity f
2
¼ðJ=IÞ
P
a
2
i
=s
2
is computed.
Then the figure corresponding to v
1
¼ I–1is
entered on the horizontal axis at the value f, the
power is read on the vertical axis from the curve
labeled v
2
¼ (I–1)(J–1), and b ¼ 1 – power.
a. For the corrosion experiment described in
Exercise 36, find b when a
1
¼ 4, a
2
¼ 0, a
3
¼
a
4
¼2, and s ¼ 4. Repeat for a
1
¼ 6,
a
2
¼ 0, a
3
¼ a
4
¼3, and s ¼ 4.
b. By symmetry, what is b for the test of H
0B
versus
H
aB
in Example 11.11 when b
1
¼ .3, b
2
¼ b
3
¼ b
4
¼ –.1, and s ¼ .3?
596 CHAPTER 11 The Analysis of Variance

11.5
Two-Factor ANOVA with K
ij
> 1
In Section 11.4, we analyzed data from a two-factor exper iment in which there
was one observation for each of the IJ combinations of levels of the two factors. To
obtain valid test procedures, the m
ij
’s were assumed to have an
additive struct ure with m
ij
¼ m þ a
i
þ b
j
, Sa
i
¼ Sb
j
¼ 0. Additivity means that
the difference in true average responses for any two levels of the factors is the
same for each level of the other factor. For example, m
ij
m
i
0
j
¼
ðm þ a
i
þ b
j
Þðm þ a
i
0
þ b
j
Þ¼a
i
a
i
0
independent of the level j of the second
factor. This is shown in Figure 11.7(a), in which the lines connecting true average
responses are parallel.
Figure 11.7(b) depicts a set of true average responses that does not have
additive structure. The lines connecting these m
ij
’s are not parallel, which
means that the difference in true average responses for different levels of one
factor does depend on the level of the other factor. When additivity does not
hold, we say that there is interaction between the different levels of the factors.
The assumption of additivity allowed us in Section 11.4 to obtain an estimator of
the random error variance s
2
(MSE) that was unbiased whether or not either null
hypothesis of interest was true. When K
ij
> 1 for at least one (i, j) pair, a valid
estimator of s
2
can be obtained without assuming additivity. In specifying the
appropriate model and deriving test procedures, we will focus on the case K
ij
¼ K
> 1, so the number of observations per “cell” (for each combination of levels)
is constant.
Parameters for the Fixed Effects Model with Interaction
Rather than use the m
ij
’s themselves as model parameters, it is usual to use an
equivalent set that reveals more clearly the role of interaction. Let
m ¼
1
IJ
X
i
X
j
m
ij
m
i
¼
1
J
X
j
m
ij
m
j
¼
1
I
X
i
m
ij
ð11:15Þ
Thus m is the expected response averaged over all levels of both factors (the true
grand mean),
m
i
is the expected resp onse averaged over leve ls of the second factor
when the first factor A is held at level i, and similarly for
m
j
. Now d efine
a
i
¼
m
i
m ¼ the effect of factor A at level i
b
j
¼
m
j
m ¼ the effect of factor B at level j
g
ij
¼ m
ij
ðm þ a
i
þ b
j
Þ
ð11:16Þ
from which
m
ij
¼ m þ a
i
þ b
j
þ g
ij
ð11:17Þ
11.5 Two-Factor ANOVA with K
ij
> 1 597