Devore J.L., Berk K.N. Modern Mathematical Statistics with Applications
Подождите немного. Документ загружается.


(e.g., constant pressure and a fixed angle). The
accompanying table shows the two lifetimes
(min) obtained for each brand–surface combina-
tion. In addition,
PPP
x
2
ijk
¼ 11; 499; 492 and
PP
x
2
ij
¼ 22; 982; 552.
Writing Surface
Brand
of Pen
123x
i..
1 709, 659 713, 726 660, 645 4112
2 668, 685 722, 740 692, 720 4227
3 659, 685 666, 684 678, 750 4122
4 698, 650 704, 666 686, 733 4137
x
.j.
5413 5621 5564 16,598
Carry out an appropriate ANOVA, and state your
conclusions.
54. The accompanying data was obtained in an experi-
ment to investigate whether compressive strength
of concrete cylinders depends on the type of cap-
ping material used or variability in different batches
(“The Effect of Type of Capping Material on the
Compressive Strength of Concrete Cylinders,”
Proceedings ASTM, 1958: 1166–1186). Each num-
ber is a cell total (x
ij.
)basedonK ¼ 3 observations.
Batch
Capping
Material
12345
1 1847 1942 1935 1891 1795
2 1779 1850 1795 1785 1626
3 1806 1892 1889 1891 1756
In addition,
PPP
x
2
ijk
¼ 16;815;853 and
PP
x
2
ij
¼ 50;443;409. Obtain the ANOVA
table and then test at level .01 the hypotheses
H
0G
versus H
aG
, H
0A
versus H
aA
, and H
0B
versus
H
aB
, assuming that capping is a fixed effect and
batches is a random effect.
55. a. Show that Eð
X
i
X
Þ¼a
i
, so that X
i
X
is an unbiased estimator for a
i
(in the fixed
effects model).
b. With
^
g
ij
¼ X
ij
X
i
X
j
þ X
, show that
^
g
ij
is an unbiased estimator for g
ij
(in the fixed
effects model).
56. Show how a 100(1 – a)% t CI for a
i
a
0
i
can be
obtained. Then compute a 95% interval for a
2
– a
3
using the data from Example 11.16. [Hint: With
y ¼ a
2
– a
3
, the result of Exercise 55(a) indicates
how to obtain
^
y. Then compute V(
^
y) and s
^
y
and
obtain an estimate of s
^
y
by using
ffiffiffiffiffiffiffiffiffiffi
MSE
p
to esti-
mate s (which identifies the appropriate number
of df).]
57. When both factors are random in a two-way
ANOVA experiment with K replications per
combination of factor levels, the expected
mean squares are E MSEðÞ¼s
2
; E MSAðÞ¼s
2
þ
Ks
2
G
þ JKs
2
A
, E MSB
ðÞ
¼ s
2
þ Ks
2
G
þ IKs
2
B
, and
E MSABðÞ¼s
2
þ Ks
2
G
a. What F ratio is appropriate for testing
H
0G
: s
2
G
¼ 0 versus H
aG
: s
2
G
> 0?
b. Answer part (a) for testing H
0A
: s
2
A
¼ 0 versus
H
aA
: s
2
A
> 0 and H
0B
: s
2
B
¼ 0 versus
H
aB
: s
2
B
> 0
Supplementary Exercises (58–70)
58. An experiment was carried out to compare flow
rates for four different types of nozzle.
a. Sample sizes were 5, 6, 7, and 6, respectively,
and calculations gave f ¼ 3.68. State and test
the relevant hypotheses using a ¼ .01.
b. Analysis of the data using a statistical com-
puter package yielded P-value ¼ .029. At
level .01, what would you conclude, and
why?
59. The article “Computer-Assisted Instruction Aug-
mented with Planned Teacher/Student Contacts”
(J. Exper. Ed., Winter 1980–1981: 120–126)
compared five different methods for teaching
descriptive statistics. The five methods were tra-
ditional lecture and discussion (L/D), pro-
grammed textbook instruction (R), programmed
text with lectures (R/L), computer instruction
(C), and computer instruction with lectures
(C/L). Forty-five students were randomly
608
CHAPTER 11 The Analysis of Variance

assigned, 9 to each method. After completing
the course, the students took a 1-h exam. In
addition, a 10-minute retention test was adminis-
tered 6 weeks later. Summary quantities are
given.
Exam Retention Test
Method
x
i
s
i
x
i
s
i
L/D 29.3 4.99 30.20 3.82
R 28.0 5.33 28.80 5.26
R/L 30.2 3.33 26.20 4.66
C 32.4 2.94 31.10 4.91
C/L 34.2 2.74 30.20 3.53
The grand mean for the exam was 30.82, and the
grand mean for the retention test was 29.30.
a. Does the data suggest that there is a difference
among the five teaching methods with respect
to true mean exam score? Use a ¼ .05.
b. Using a .05 significance level, test the null
hypothesis of no difference among the true
mean retention test scores for the five differ-
ent teaching methods.
60. Numerous factors contribute to the smooth run-
ning of an electric motor (“Increasing Market
Share Through Improved Product and Process
Design: An Experimental Approach,” Qual.
Engrg., 1991: 361–369). In particular, it is desir-
able to keep motor noise and vibration to a mini-
mum. To study the effect that the brand of
bearing has on motor vibration, five different
motor bearing brands were examined by instal-
ling each type of bearing on different random
samples of six motors. The amount of motor
vibration (measured in microns) was recorded
when each of the 30 motors was running. The
data for this study follows. State and test the
relevant hypotheses at significance level .05,
and then carry out a multiple comparisons analy-
sis if appropriate.
Mean
Brand 1: 13.1 15.0 14.0 14.4 14.0 11.6 13.68
Brand 2: 16.3 15.7 17.2 14.9 14.4 17.2 15.95
Brand 3: 13.7 13.9 12.4 13.8 14.9 13.3 13.67
Brand 4: 15.7 13.7 14.4 16.0 13.9 14.7 14.73
Brand 5: 13.5 13.4 13.2 12.7 13.4 12.3 13.08
61. An article in the British scientific journal Nature
(“Sucrose Induction of Hepatic Hyperplasia in
the Rat,” August 25, 1972: 461) reports on an
experiment in which each of five groups consist-
ing of six rats was put on a diet with a different
carbohydrate. At the conclusion of the experi-
ment, the DNA content of the liver of each rat
was determined (mg/g liver), with the following
results:
Carbohydrate
x
i
Starch 2.58
Sucrose 2.63
Fructose 2.13
Glucose 2.41
Maltose 2.49
a. Assuming also that
PP
x
2
ij
¼ 183:4, is the
true average DNA content affected by the
type of carbohydrate in the diet? Construct
an ANOVA table and use a .05 level of sig-
nificance.
b. Construct a t CI for the contrast
y ¼ m
1
ðm
2
þ m
3
þ m
4
þ m
5
Þ=4
which measures the difference between the
average DNA content for the starch diet and
the combined average for the four other diets.
Does the resulting interval include zero?
c. What is b for the test when true average DNA
content is identical for three of the diets and
falls below this common value by 1 standard
deviation (s) for the other two diets?
62. Four laboratories (1–4) are randomly selected
from a large population, and each is asked to
make three determinations of the percentage of
methyl alcohol in specimens of a compound
taken from a single batch. Based on the accom-
panying data, are differences among laboratories
a source of variation in the percentage of methyl
alcohol? State and test the relevant hypotheses
using significance level .05.
1: 85.06 85.25 84.87
2: 84.99 84.28 84.88
3: 84.48 84.72 85.10
4: 84.10 84.55 84.05
Supplementary Exercises 609

63. The critical flicker frequency (cff) is the highest
frequency (in cycles/sec) at which a person can
detect the flicker in a flickering light source. At
frequencies above the cff, the light source appears
to be continuous even though it is actually flicker-
ing. An investigation carried out to see whether
true average cff depends on iris color yielded the
following data (based on the article “The Effects
of Iris Color on Critical Flicker Frequency,” J.
Gen. Psych., 1973: 91–95):
Iris Color
1. Brown 2. Green 3. Blue
26.8 26.4 25.7
27.9 24.2 27.2
23.7 28.0 29.9
25.0 26.9 28.5
26.3 29.1 29.4
24.8 28.3
25.7
24.5
J
i
856
x
i
204.7 134.6 169.0
x
i
25.59 26.92 28.17
n ¼ 19 x
¼ 508:3
a. State and test the relevant hypotheses at signif-
icance level .05 by using the F table to obtain
an upper and/or lower bound on the P-value.
[Hint:
PP
x
2
ij
¼ 13; 659:67 and
CF ¼ 13; 598:36.]
b. Investigate differences between iris colors
with respect to mean cff.
64. Recall from Section 11.2 that if c
1
, c
2
, ..., c
I
are
numbers satisfying Sc
i
¼ 0 then Sc
i
m
i
¼ c
1
m
1
+
+c
I
m
I
is called a contrast in the m
i
’s. Notice
that with c
1
¼ 1, c
2
¼1, c
3
¼ ¼ c
I
¼ 0,
Sc
i
m
i
¼ m
1
– m
2
, which implies that every pair-
wise difference between m
i
’s is a contrast (so is,
e.g., m
1
– .5m
2
– .5m
3
). A method attributed to
Scheffe
´
gives simultaneous CIs with simultaneous
confidence level 100(1 – a)% for all possible
contrasts (an infinite number of them!). The inter-
val for Sc
i
m
i
is
P
c
i
x
i
ffiffiffiffiffiffiffiffiffiffiffiffiffiffiffiffiffiffiffiffiffiffiffiffiffiffiffiffiffiffiffiffiffiffiffiffiffiffiffiffiffiffiffiffiffiffiffiffiffiffiffiffiffiffiffiffiffiffi
ðI 1ÞF
a;I1;nI
MSE
P
c
2
i
=J
i
p
Using the critical flicker frequency data of Exer-
cise 63, calculate the Scheffe
´
intervals for the
contrasts m
1
– m
2
, m
1
– m
3
, m
2
– m
3
, and
.5m
1
+ .5 m
2
– m
3
(the last contrast compares
blue to the average of brown and green). Which
contrasts differ significantly from 0, and why?
65. Four types of mortars—ordinary cement mortar
(OCM), polymer impregnated mortar (PIM), resin
mortar (RM), and polymer cement mortar
(PCM)—were subjected to a compression test to
measure strength (MPa). Three strength observa-
tions for each mortar type are given in the article
“Polymer Mortar Composite Matrices for Mainte-
nance-Free Highly Durable Ferrocement” (J. Fer-
rocement, 1984: 337–345) and are reproduced
here. Construct an ANOVA table. Using a .05
significance level, determine whether the data sug-
gests that the true mean strength is not the same for
all four mortar types. If you determine that the true
mean strengths are not all equal, use Tukey’s
method to identify the significant differences.
OCM: 32.15 35.53 34.20
PIM: 126.32 126.80 134.79
RM: 117.91 115.02 114.58
PCM: 29.09 30.87 29.80
66. In single-factor ANOVA, suppose the x
ij
’s are
“coded” by y
ij
¼ cx
ij
+d. How does the value of
the F statistic computed from the y
ij
’s compare to
the value computed from the x
ij
’s? Justify your
assertion.
67. In Example 11.10, subtract x
i
from each observa-
tion in the ith sample (i ¼ 1, ..., 6) to obtain a set
of 18 residuals. Then construct a normal probabil-
ity plot and comment on the plausibility of the
normality assumption.
68. The results of a study on the effectiveness of line
drying on the smoothness of fabric were summar-
ized in the article “Line-Dried vs. Machine-Dried
Fabrics: Comparison of Appearance, Hand, and
Consumer Acceptance” (Home Econ. Res. J.,
1984: 27–35). Smoothness scores were given for
nine different types of fabric and five different
drying methods: (1) machine dry, (2) line dry,
(3) line dry followed by 15-min tumble, (4) line
dry with softener, and (5) line dry with air move-
ment. Regarding the different types of fabric as
blocks, construct an ANOVA table.
a. Using a .05 significance level, test to see
whether there is a difference in the true mean
smoothness score for the drying methods.
610
CHAPTER 11 The Analysis of Variance

b. Make a plot like Figure 11.8 with fabric on the
horizontal axis. Discuss the result of part (a) in
terms of the plot.
c. Did the two methods involving the dryer yield
significantly smoother fabric compared to the
other three?
Drying method
Fabric 12345
Crepe 3.3 2.5 2.8 2.5 1.9
Double knit 3.6 2.0 3.6 2.4 2.3
Twill 4.2 3.4 3.8 3.1 3.1
Twill mix 3.4 2.4 2.9 1.6 1.7
Terry 3.8 1.3 2.8 2.0 1.6
Broadcloth 2.2 1.5 2.7 1.5 1.9
Sheeting 3.5 2.1 2.8 2.1 2.2
Corduroy 3.6 1.3 2.8 1.7 1.8
Denim 2.6 1.4 2.4 1.3 1.6
69. The water absorption of two types of mortar used
to repair damaged cement was discussed in the
article “Polymer Mortar Composite Matrices for
Maintenance-Free, Highly Durable Ferrocement”
(J. Ferrocement, 1984: 337–345). Specimens of
ordinary cement mortar (OCM) and polymer
cement mortar (PCM) were submerged for vary-
ing lengths of time (5, 9, 24, or 48 h), and water
absorption (% by weight) was recorded. With
mortar type as factor A (with two levels) and
submersion period as factor B (with four levels),
three observations were made for each factor level
combination. Data included in the article was used
to compute the sums of squares, which were SSA
¼ 322.667, SSB ¼ 35.623, SSAB ¼ 8.557, and
SST ¼ 372.113. Use this information to construct
an ANOVA table. Test the appropriate hypotheses
at a .05 significance level.
70. Four plots were available for an experiment to
compare clover accumulation for four different
sowing rates (“Performance of Overdrilled Red
Clover with Different Sowing Rates and Initial
Grazing Managements,” New Zeal. J. Exper.
Agric., 1984: 71–81). Since the four plots had
been grazed differently prior to the experiment
and it was thought that this might affect clover
accumulation, a randomized block experiment
was used with all four sowing rates tried on a
section of each plot. Use the given data to test
the null hypothesis of no difference in true mean
clover accumulation (kg DM/ha) for the different
sowing rates.
a. Test to see if the different sowing rates
make a difference in true mean clover accumu-
lation.
b. Make appropriate plots to go with your analy-
sis in (a): Make a plot like the one in Figure
11.8, make a normal plot of the residuals, and
plot the residuals against the predicted values.
Explain why, based on the plots, the assump-
tions do not appear to be satisfied for this data
set.
c. Repeat part (a) replacing the observations with
their natural logarithms.
d. Repeat the plots of (b) for the analysis in (c).
Do the logged observations appear to satisfy
the assumptions better?
e. Summarize your conclusions for this experi-
ment. Does mean clover accumulation increase
with increasing sowing rate?
Sowing Rate (kg/ha)
Plot 3.6 6.6 10.2 13.5
1 1155 2255 3505 4632
2 123 406 564 416
3 68 416 662 379
4 62 75 362 564
Bibliography
Miller, Rupert, Beyond ANOVA: The Basics of Applied
Statistics, Wiley, New York, 1986. An excellent
source of information about assumption checking
and alternative methods of analysis
Montgomery, Douglas, Design and Analysis of
Experiments (7th ed.), Wiley, New York, 2009.
An up-to-date presentation of ANOVA models
and methodology.
Kutner, Michael, Christopher Nachtsheim, John Neter,
and William Li, Applied Linear Statistical Models
(5th ed.), McGraw-Hill, New York, NY, 2005. The
second half of this book contains a well-presented
Bibliography 611
survey of ANOVA; the level is comparable to that
of the present text, but the discussion is more com-
prehensive, making the book an excellent reference
Ott, R. Lyman, and Michael Longnecker, An Introduc-
tion to Statistical Methods and Data Analysis
(6th ed.), Cengage, Belmont, CA, 2010. Includes
several chapters on ANOVA methodology that can
profitably be read by students desiring a nonmath-
ematical exposition; there is a good chapter on
various multiple comparison methods
612
CHAPTER 11 The Analysis of Variance

CHAPTER TWELVE
Regression
and Correlation
Introduction
The general objective of a regression analysis is to determine the relationship
between two (or more) variables so that we can gain information about one of
them through knowing values of the other(s). Much of mathematics is devoted to
studying variables that are
deterministically
related. Saying that
x
and
y
are related
in this manner means that once we are told the value of
x
, the value of
y
is
completely specified. For example, suppose we decide to rent a van for a day and
that the rental cost is $25.00 plus $.30 per mile driven. If we let
x
¼ the number
of miles driven and
y
¼ the rental charge, then
y
¼ 25 + .3
x
. If we drive the van
100 miles (
x
¼ 100), then
y
¼ 25 + .3(100) ¼ 55. As another example, if the
initial velocity of a particle is v
0
and it undergoes constant acceleration
a
, then
distance traveled ¼ y þ v
0
x
þ
1
2
ax
2
, where
x
¼ time.
There are many variables
x
and
y
that would appear to be related to each
other, but not in a deterministic fashion. A familiar example to many students is
given by variables
x
¼ high school grade point average (GPA) and
y
¼ college
GPA. The value of
y
cannot be determined just from knowledge of
x
, and two
different students could have the same
x
value but have very different
y
values.
Yet there is a tendency for those students who have high (low) high school GPAs
also to have high (low) college GPAs. Knowledge of a student’s high school GPA
should be quite helpful in enabling us to predict how that person will do in college.
Other examples of variables related in a nondeterministic fashion include
x
¼ age of a child and
y
¼ size of that child’s vocabulary,
x
¼ size of an engine in
cubic centimeters and
y
¼ fuel efficiency for an automobile equipped with that
engine, and
x
¼ applied tensile force and
y
¼ amount of elongation in a metal strip.
Regression analysis is the part of statistics that deals with investigation of the
relationship between two or more variables related in a nondeterministic fashion.
J.L. Devore and K.N. Berk, Modern Mathematical Statistics with Applications, Springer Texts in Statistics,
DOI 10.1007/978-1-4614-0391-3_12,
#
Springer Science+Business Media, LLC 2012
613

In this chapter, we generalize a deterministic linear relation to obtain a linear
probabilistic model for relating two variables
x
and
y
. We then develop procedures
for making inferences based on data obtained from the model, and obtain a
quantitative measure (the correlation coefficient) of the extent to which the two
variables are related. Techniques for assessing the adequacy of any particular
regression model are then con sidered. We next introduce multiple regression
analysis as a way of relating
y
to two or more variables—for example, relating
fuel efficiency of an automobile to weight, engine size, number of cylinders, and
transmission type. The last section of the chapter shows how matrix algebra
techniques can be used to facilitate a concise and elegant development of regres-
sion procedures.
12.1
The Simple Linear and Logistic
Regression Models
The key idea in developing a probabilistic relationship between a dependent or
response variable y and an independent, explanatory,orpredictor variable x is to
realize that once the value of x has been fixed, there is still uncertainty in what the
resulting y value will be. That is, for a fixed value of x, we now think of the
dependent variable as being random. This random variable will be denoted by Y and
its observed value by y. For example, suppose an investigator plans a study to relate
y ¼ yearly energy usage of an industrial building (1000’s of BTUs) to x ¼ the shell
area of the building (ft
2
). If one of the buildings selected for the study has a shell
area of 25,000 ft
2
, the resulting energy usage might be 2,215,000 or it might be
2,348,000 or any one of a number of other possibilities. Since we don’t know a
priori what the value of energy usage will be (because usage is determined partly by
factors other than shell area), usage is regarded as a random variable Y.
We now relate the independent and dependent variables by an additive
model equation:
Y ¼ some particular deterministic function of x þ a random deviation
¼ f ðxÞþe
ð12:1Þ
The symbol e represents a random deviation or random “error” (random variable)
which is assumed to have mean value 0. Th is rv incorporates all variation in the
dependent variable due to factors other than x. Figure 12.1 shows the graph of a
particular f(x). Without the random deviation e, whenever x is fixed prior to making
an observation on the dependent variable, the resulting (x, y) point would fall
exactly on the graph. That is, y would be entirely determined by x. The role of
the random deviation e is to allow a non-deterministic relationship. Now if the
value of e is positive, the resulting (x, y) point falls above the graph of f(x), whereas
when e is negative, the resulting point falls below the graph. The assumption that e
has mean value 0 implies that we expect the point (x, y) to fall right on the graph,
but we virtually never see what we literally expect—the observed point will almost
always devi ate upward or downward from the graph.
614 CHAPTER 12 Regression and Correlation

How should the deterministic part of the model equation be selected?
Occasionally some sort of theoretical argument will suggest an appropriate choice
of f(x). However, in practice the specification of f(x) is almost always made by
obtaining sample data consisting of n (x, y) pairs. A picture of the resulting observa-
tions (x
1
, y
1
), (x
2
, y
2
), ...,(x
n
, y
n
), called a scatter plot, is then constructed. In this
scatter plot each (x
i
, y
i
) is represented as a point in a two-dimensional coordinate
system. The pattern of points in the plot should suggest an appropriate f(x).
Example 12.1 Visual and musculoskel etal problems associated with the use of visual display
terminals (VDTs) have become rather common in recent years. Some researchers
have focused on vertical gaze direction as a source of eye strain and irritation. This
direction is known to be closely related to ocular surface area (OSA), so a method
of measuring OSA is needed. The accompanying representative data on y ¼ OSA
(cm
2
) and x ¼ width of the palprebal fissure (i.e., the horizontal width of the eye
opening, in cm) is from the article “Analysis of Ocular Surface Area for Comfort-
able VDT Workstation Layout” (Ergonomics, 1996: 877–884). The order in which
observations were obtained was not given, so for convenience they are listed in
increasing order of x values.
Thus (x
1
, y
1
) ¼ (.40, 1.02), (x
5
, y
5
) ¼ (.57, 1.52), and so on. A MINITAB
scatter plot is shown in Figure 12.2; we used an option that produced a dotplot of both
the x values and y values individually along the right and top margins of the plot,
which makes it easier to visualize the distributions of the individual variables
y
x
e
positive
e
negative
(
x,y)
(
x,y)
Graph of
f
(
x)
⎧
⎨
⎩
Figure 12.1 Observations resulting from the model equation (12.1)
i 1 23456789101112131415
x
i
.40 .42 .48 .51 .57 .60 .70 .75 .75 .78 .84 .95 .99 1.03 1.12
y
i
1.02 1.21 .88 .98 1.52 1.83 1.50 1.80 1.74 1.63 2.00 2.80 2.48 2.47 3.05
i 16 17 18 19 20 21 22 23 24 25 26 27 28 29 30
x
i
1.15 1.20 1.25 1.25 1.28 1.30 1.34 1.37 1.40 1.43 1.46 1.49 1.55 1.58 1.60
y
i
3.18 3.76 3.68 3.82 3.21 4.27 3.12 3.99 3.75 4.10 4.18 3.77 4.34 4.21 4.92
12.1 The Simple Linear and Logistic Regression Models 615
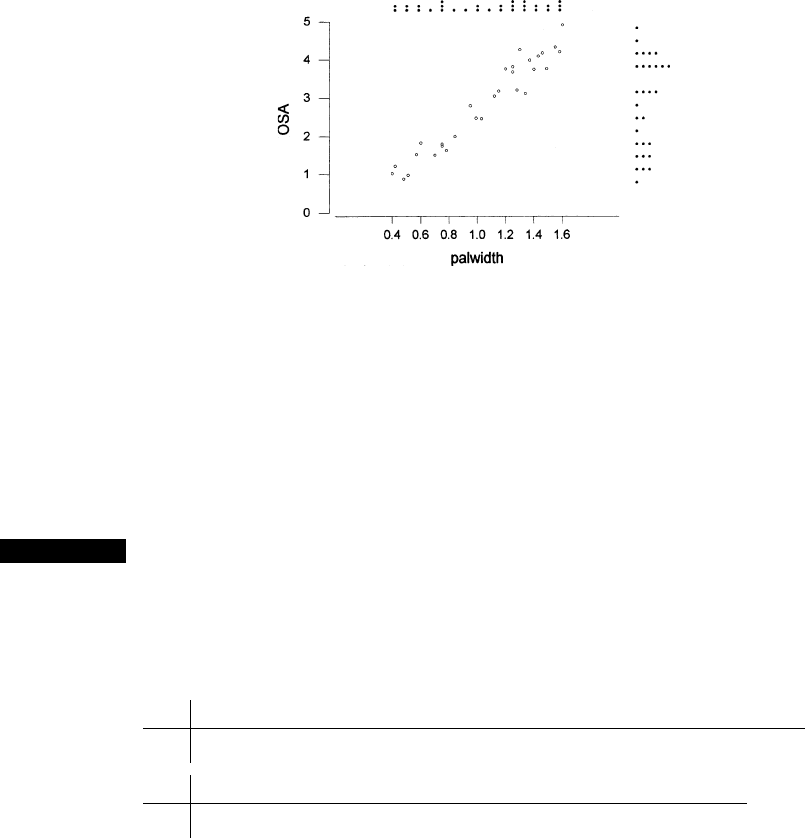
(histograms or boxplots are alternative options). Here are some things to notice about
the data and plot:
• Several observations have identical x values yet different y values (e.g.,
x
8
¼ x
9
¼ .75, but y
8
¼ 1.80 and y
9
¼ 1.74). Thus the value of y is not
determined solely by x but also by various other factors.
• There is a strong tend ency for y to increase as x increases. That is, larger values
of OSA tend to be associated with larger values of fissure width —a positive
relationship between the variables.
• It appears that the value of y could be predicted from x by finding a line that is
reasonably close to the points in the plot (the authors of the cited article
superimposed such a line on their plot). In other words, there is evidence of a
substantial (though not perfect) linear relationship between the two variables.
The horizontal and vertical axes in the scatter plot of Figure 12.2 intersect at
the point (0, 0). In many data sets, the values of x or y or the values of both variables
differ considerably from zero relative to the range(s) of the values. For example, a
study of how air conditioner efficiency is related to maximum daily outdoor
temperature might involve observations for temperatures ranging from 80
Fto
100
F. When this is the case, a more informative plot would show the appropriately
labeled axes intersecting at some point other than (0, 0).
Example 12.2 Forest growth and decline phenomena throughout the world have attracted consid-
erable public and scientific interest. The article “Relationships Among Crown
Condition, Growth, and Stand Nutrition in Seven Northern Vermont Sugarbushes”
(Canad. J. Forest Res., 1995: 386–397) included a scatter plot of y ¼ mean crown
dieback (%), one indicator of growth retardation, and x ¼ soil pH (higher pH
corresponds to more acidic soil), from which the following observations were taken:
x 3.3 3.4 3.4 3.5 3.6 3.6 3.7 3.7 3.8 3.8
y 7.3 10.8 13.1 10.4 5.8 9.3 12.4 14.9 11.2 8.0
x 3.9 4.0 4.1 4.2 4.3 4.4 4.5 5.0 5.1
y 6.6 10.0 9.2 12.4 2.3 4.3 3.0 1.6 1.0
Figure 12.2 Scatter plot from MINITAB for the data from Example 12.1, along
with dotplots of x and y values
■
616 CHAPTER 12 Regression and Correlation
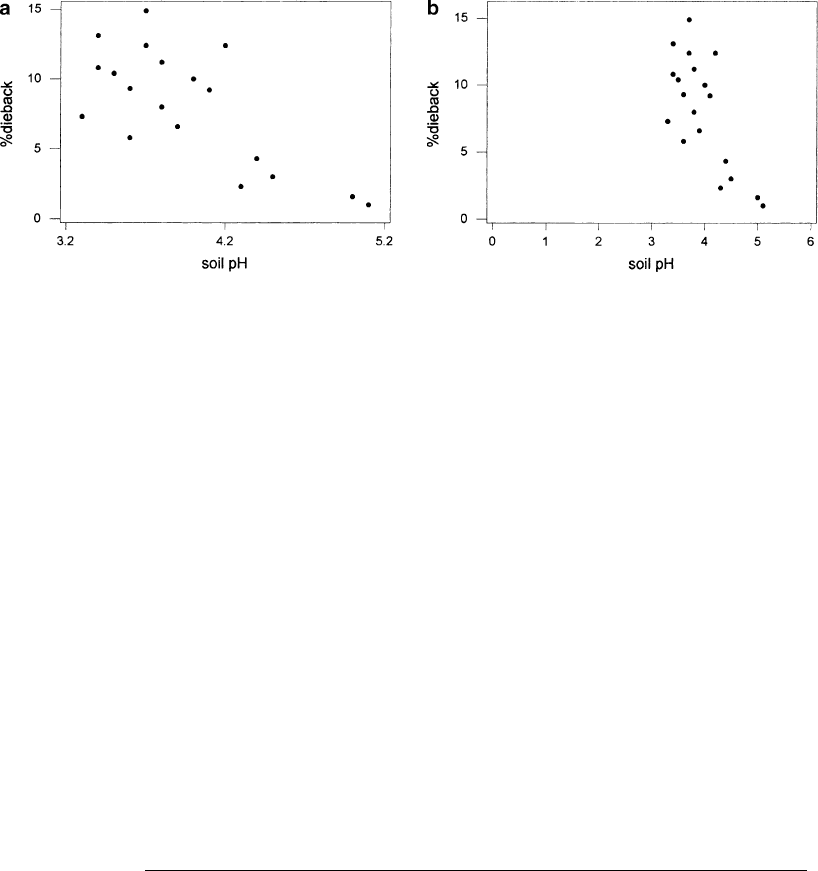
Figure 12.3 shows two MINITAB scatter plots of this data. In Figure 12.3a,
MINITAB selected the scale for both axes. We obtained Figure 12.3b by specifying
minimum and maximum values for x and y so that the axes would intersect roughly
at the point (0, 0). The second plot is more crowded than the first one; such
crowding can make it more difficult to ascertain the general nature of any relation-
ship. For example, it can be more difficult to spot curvature in a crowded plot.
Large values of percentage dieback tend to be associated with low soil pH, a
negative or inverse relationship. Furthermore, the two variables appear to be at least
approximately linearly related, although the points would be spread out about any
straight line drawn through the plot.
■
A Linear Probabilistic Model
For a deterministic linear relationship y ¼ b
0
+ b
1
x, the slope coefficient b
1
is the
guaranteed increase in y when x increases by one unit and the intercept coefficient
b
0
is the value of y when x ¼ 0. A graph of y ¼ b
0
+ b
1
x is of course a straight line.
The slope gives the amount by which the line rises or falls when we move one unit
to the right, and the intercept is the height at which the line crosses the vertical axis.
For example, the line y ¼ 100 5x specifies an increase of 5 (i.e., a decrease of 5)
for each one-unit increase in x, and the vertical intercept of the line is 100. When a
scatter plot of bivariate data consisting of n (x, y) pairs shows a reasonably
substantial linear pattern, it is natural to specify f(x) in the model equation (12.1)
to be a linear function. Rather than assuming that the dependent variable itself is a
linear function of x, the model assumes that the expected value of Y is a linear
function of x. For any fixed x value, the observed value of Y will deviate by a
random amount from its expected value.
THE SIMPLE
LINEAR
REGRESSION
MODEL
There are parameters b
0
, b
1
, and s
2
such that for any fixed value of the
independent variable x, the dependent variable is related to x through the
model equation
Y ¼ b
0
þ b
1
x þ e
Figure 12.3 MINITAB scatter plots of data in Example 12.2
12.1 The Simple Linear and Logistic Regression Models 617